
|
|||||
|
 | |
| |
| |
| |
| |
| |
|
Gene: SUMO2 |
Gene summary for SUMO2 |
| Gene information | Species | Human | Gene symbol | SUMO2 | Gene ID | 6613 |
| Gene name | small ubiquitin like modifier 2 | |
| Gene Alias | HSMT3 | |
| Cytomap | 17q25.1 | |
| Gene Type | protein-coding | GO ID | GO:0006139 | UniProtAcc | P61956 |
Top |
Malignant transformation analysis |
| Identification of the aberrant gene expression in precancerous and cancerous lesions by comparing the gene expression of stem-like cells in diseased tissues with normal stem cells |
| Entrez ID | Symbol | Replicates | Species | Organ | Tissue | Adj P-value | Log2FC | Malignancy |
| 6613 | SUMO2 | GSM4909281 | Human | Breast | IDC | 1.46e-15 | 3.75e-01 | 0.21 |
| 6613 | SUMO2 | GSM4909282 | Human | Breast | IDC | 7.21e-50 | 5.43e-01 | -0.0288 |
| 6613 | SUMO2 | GSM4909285 | Human | Breast | IDC | 3.41e-51 | 5.61e-01 | 0.21 |
| 6613 | SUMO2 | GSM4909286 | Human | Breast | IDC | 2.18e-16 | 3.71e-01 | 0.1081 |
| 6613 | SUMO2 | GSM4909287 | Human | Breast | IDC | 2.31e-41 | 4.12e-01 | 0.2057 |
| 6613 | SUMO2 | GSM4909288 | Human | Breast | IDC | 3.12e-12 | 3.82e-01 | 0.0988 |
| 6613 | SUMO2 | GSM4909289 | Human | Breast | IDC | 1.40e-16 | 5.60e-01 | 0.1064 |
| 6613 | SUMO2 | GSM4909290 | Human | Breast | IDC | 1.25e-25 | 4.41e-01 | 0.2096 |
| 6613 | SUMO2 | GSM4909291 | Human | Breast | IDC | 2.24e-02 | 2.21e-01 | 0.1753 |
| 6613 | SUMO2 | GSM4909293 | Human | Breast | IDC | 2.44e-05 | 2.99e-01 | 0.1581 |
| 6613 | SUMO2 | GSM4909294 | Human | Breast | IDC | 6.68e-14 | -2.26e-02 | 0.2022 |
| 6613 | SUMO2 | GSM4909295 | Human | Breast | IDC | 4.50e-06 | 2.53e-01 | 0.0898 |
| 6613 | SUMO2 | GSM4909296 | Human | Breast | IDC | 1.51e-22 | -4.94e-01 | 0.1524 |
| 6613 | SUMO2 | GSM4909297 | Human | Breast | IDC | 1.71e-36 | -6.34e-02 | 0.1517 |
| 6613 | SUMO2 | GSM4909298 | Human | Breast | IDC | 9.93e-50 | 5.31e-01 | 0.1551 |
| 6613 | SUMO2 | GSM4909301 | Human | Breast | IDC | 1.55e-02 | -1.56e-01 | 0.1577 |
| 6613 | SUMO2 | GSM4909304 | Human | Breast | IDC | 7.66e-03 | -1.84e-01 | 0.1636 |
| 6613 | SUMO2 | GSM4909307 | Human | Breast | IDC | 8.00e-23 | 3.74e-01 | 0.1569 |
| 6613 | SUMO2 | GSM4909308 | Human | Breast | IDC | 3.04e-60 | 6.04e-01 | 0.158 |
| 6613 | SUMO2 | GSM4909309 | Human | Breast | IDC | 5.62e-11 | 1.25e-01 | 0.0483 |
| Page: 1 2 3 4 5 6 7 8 9 10 11 12 13 14 15 16 |
| Tissue | Expression Dynamics | Abbreviation |
| Breast | 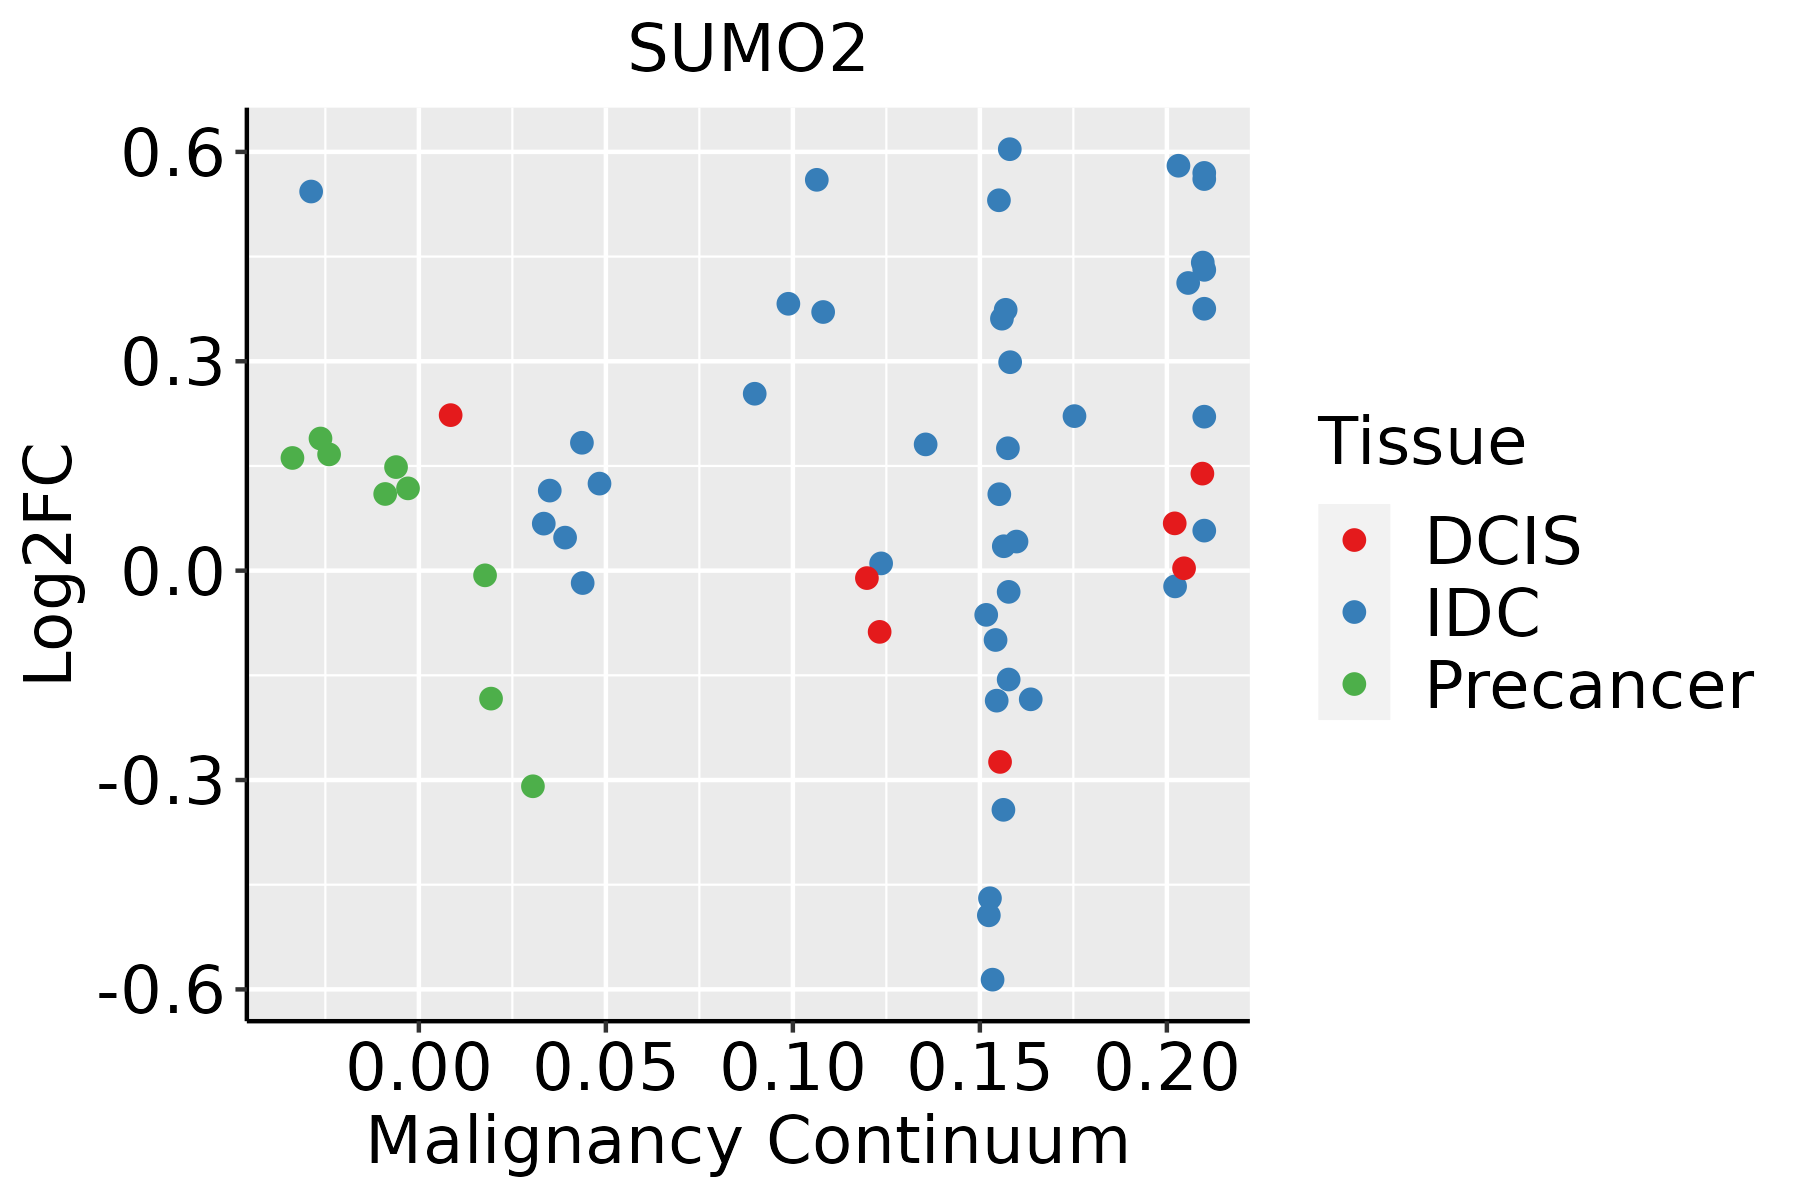 | IDC: Invasive ductal carcinoma |
| DCIS: Ductal carcinoma in situ | ||
| Precancer(BRCA1-mut): Precancerous lesion from BRCA1 mutation carriers | ||
| Cervix | 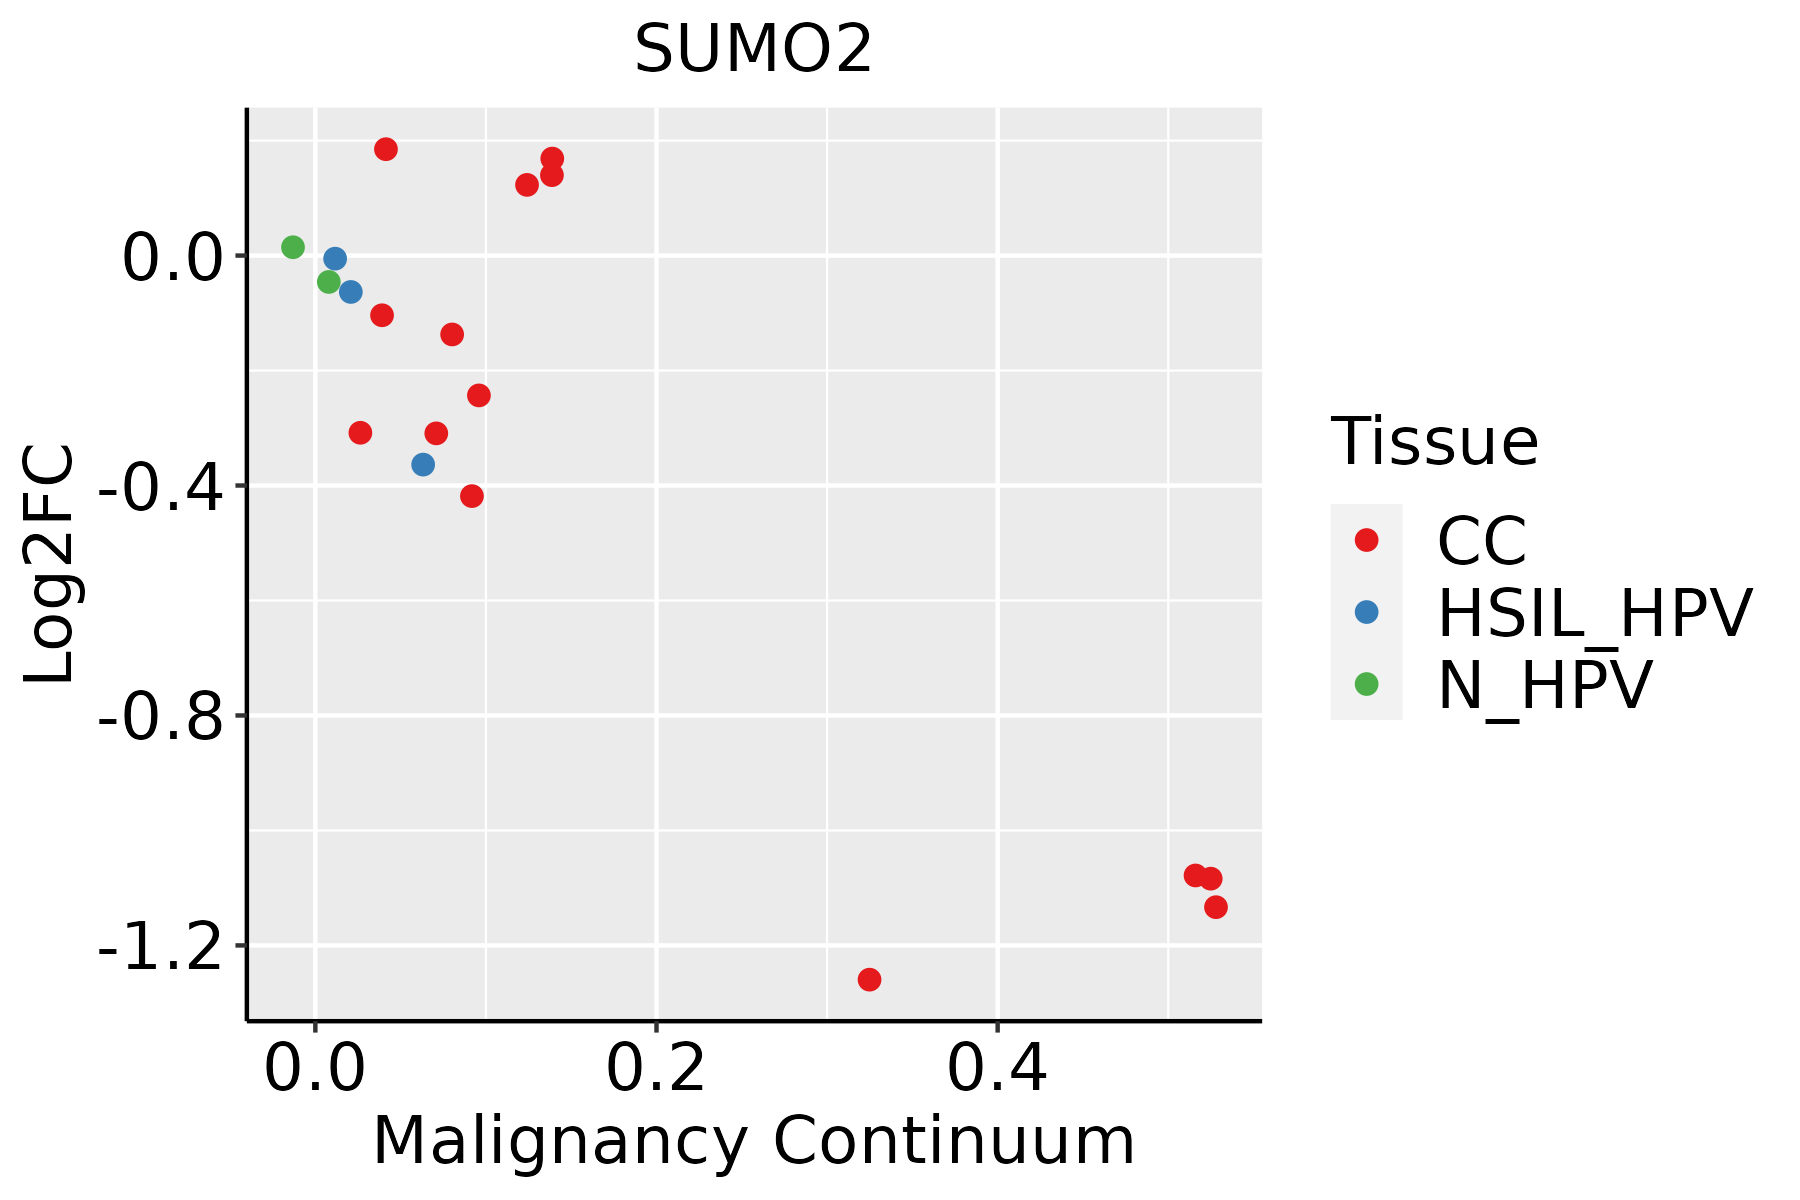 | CC: Cervix cancer |
| HSIL_HPV: HPV-infected high-grade squamous intraepithelial lesions | ||
| N_HPV: HPV-infected normal cervix | ||
| Colorectum (GSE201348) |  | FAP: Familial adenomatous polyposis |
| CRC: Colorectal cancer | ||
| Colorectum (HTA11) |  | AD: Adenomas |
| SER: Sessile serrated lesions | ||
| MSI-H: Microsatellite-high colorectal cancer | ||
| MSS: Microsatellite stable colorectal cancer | ||
| Endometrium | 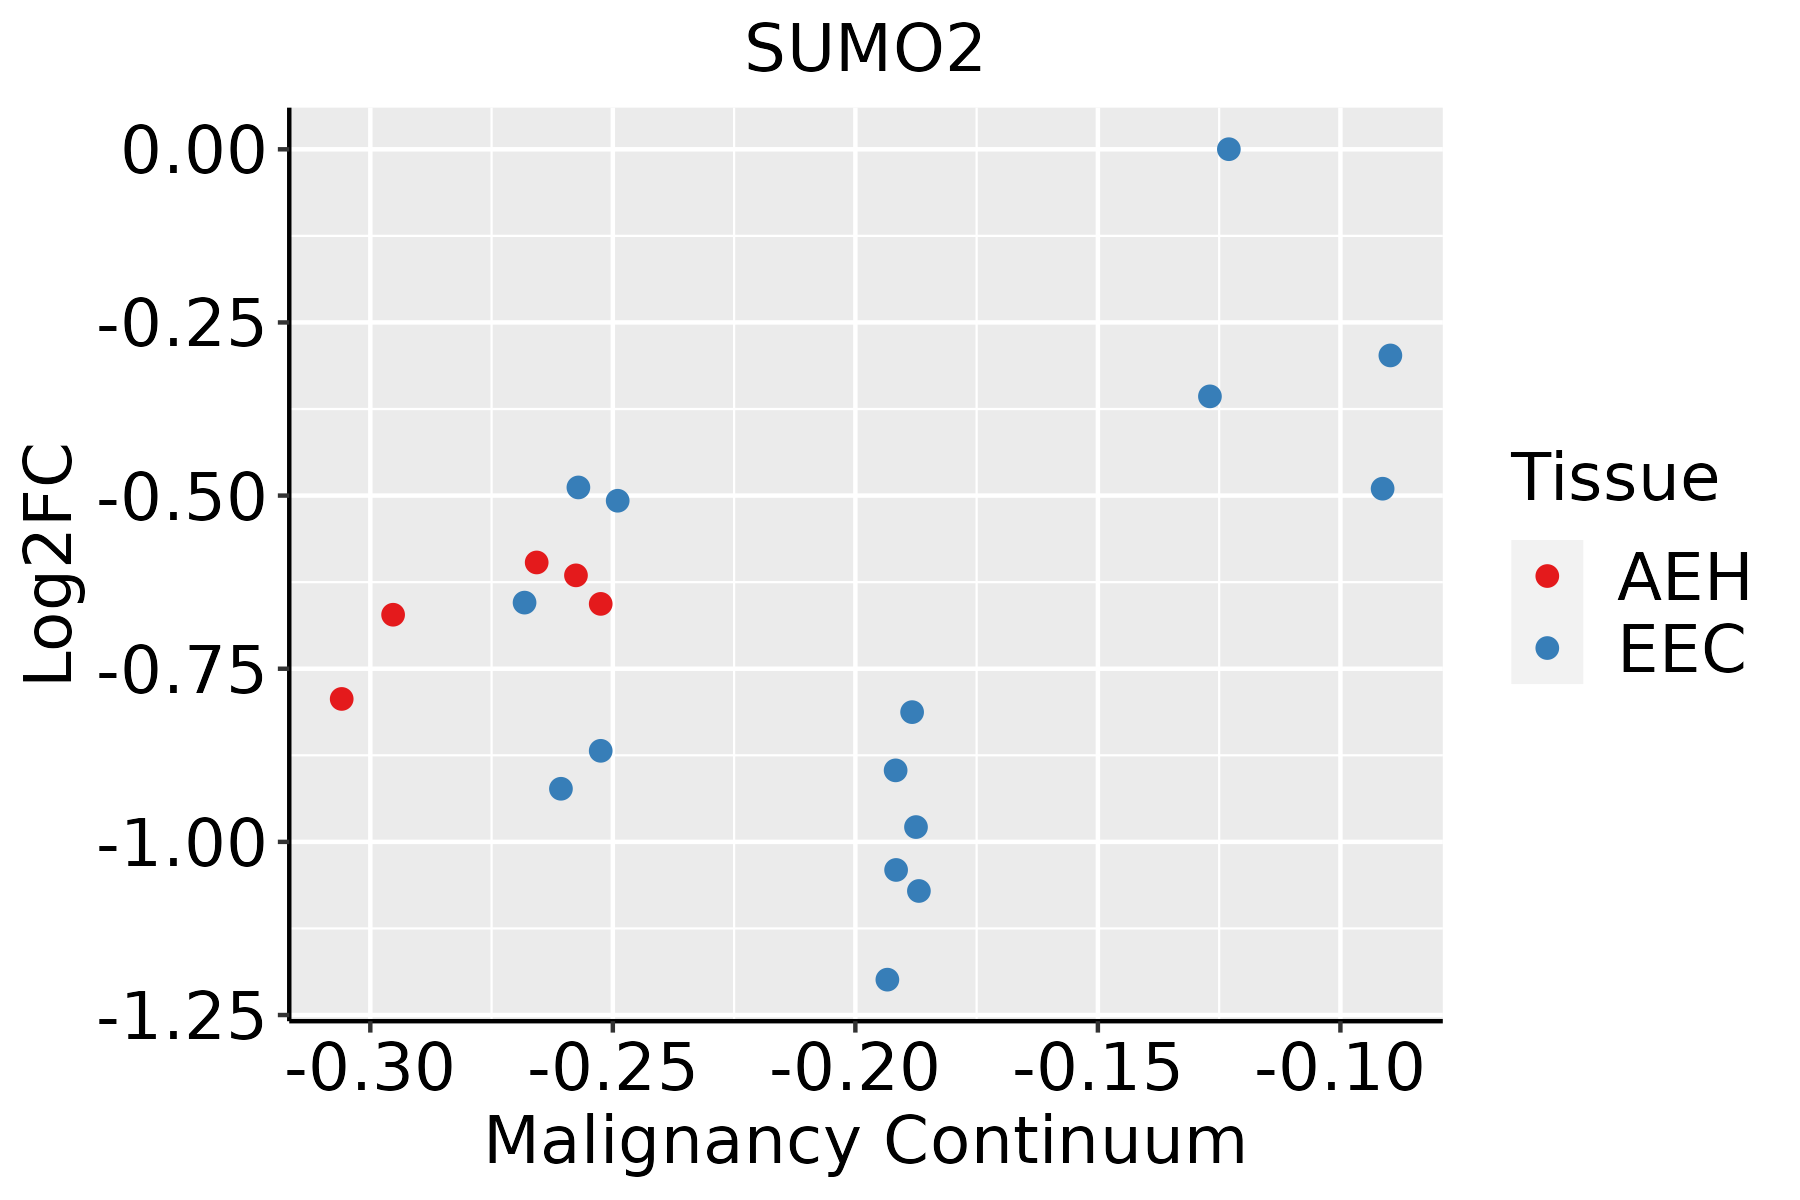 | AEH: Atypical endometrial hyperplasia |
| EEC: Endometrioid Cancer | ||
| Esophagus | 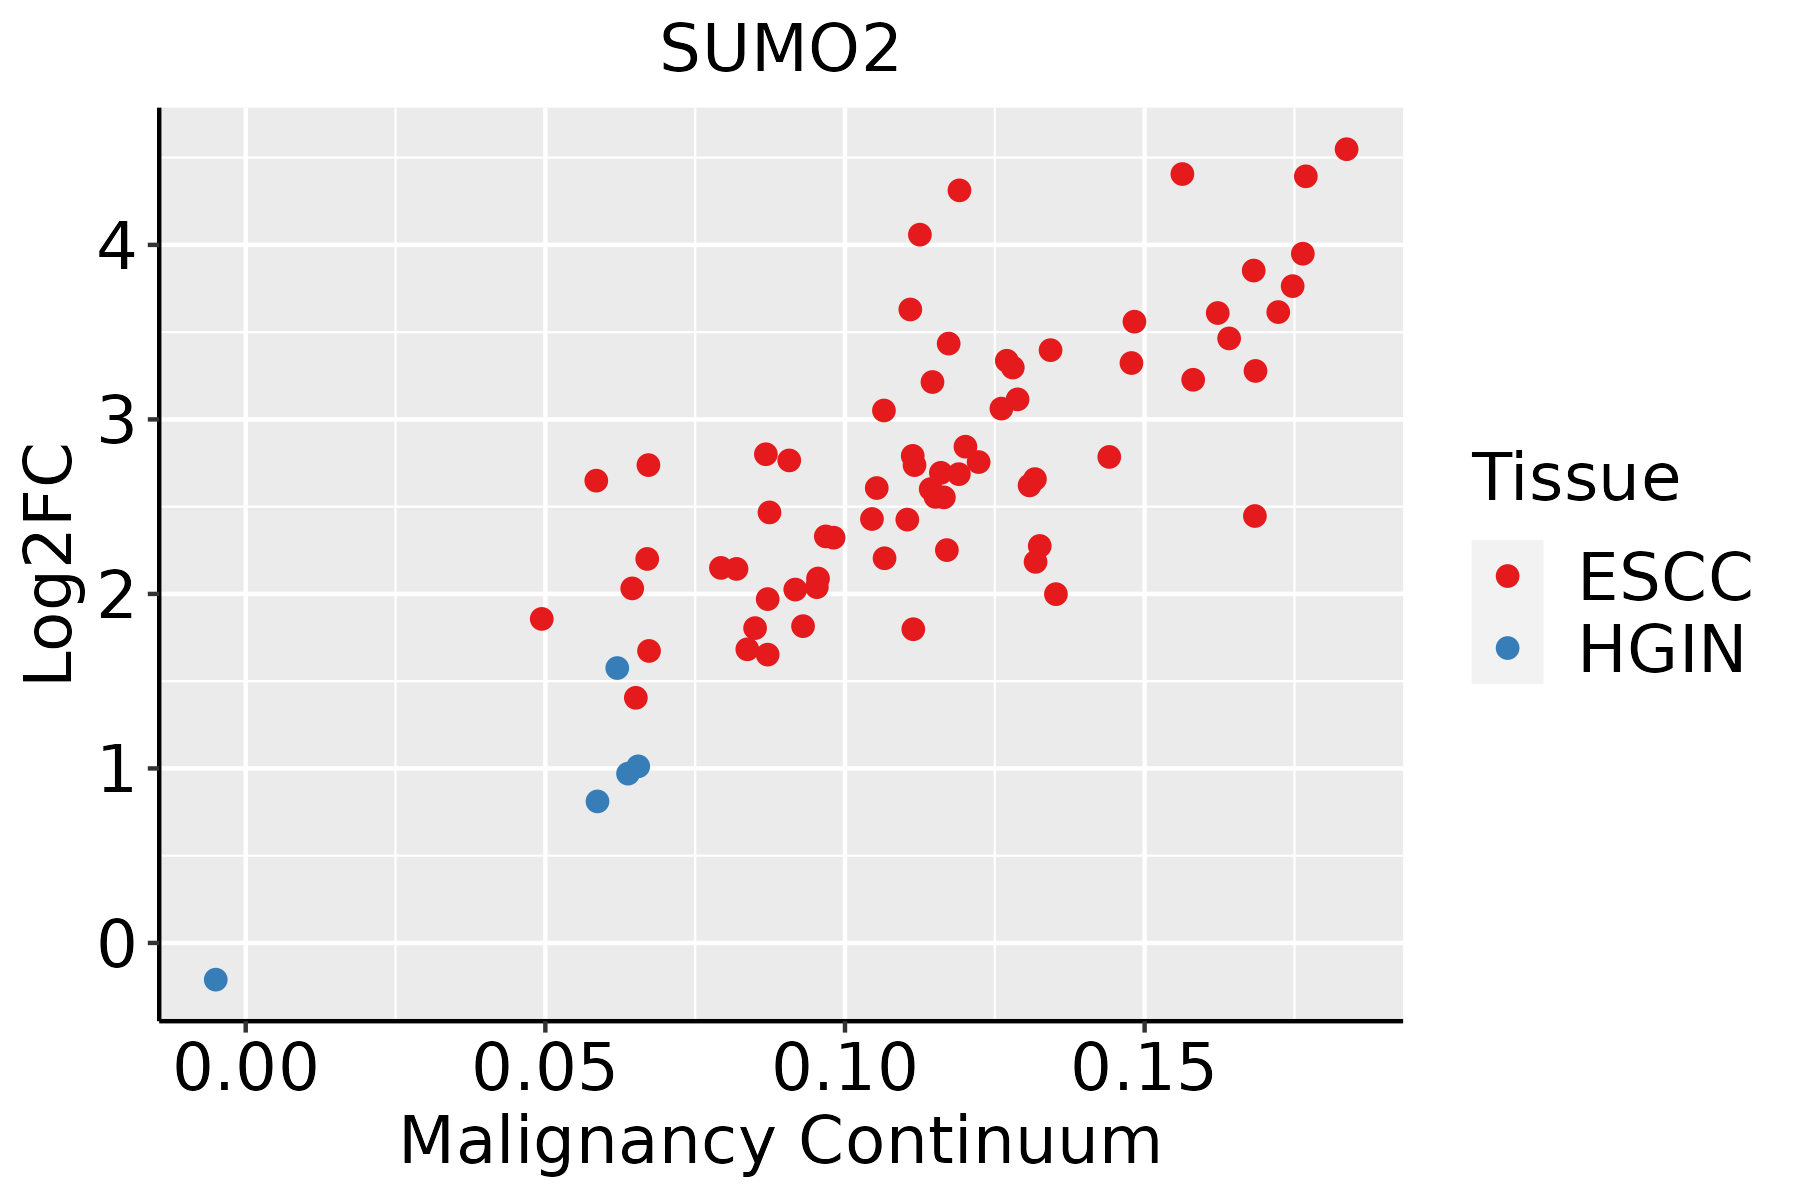 | ESCC: Esophageal squamous cell carcinoma |
| HGIN: High-grade intraepithelial neoplasias | ||
| LGIN: Low-grade intraepithelial neoplasias | ||
| GC |  | CAG: Chronic atrophic gastritis |
| CAG with IM: Chronic atrophic gastritis with intestinal metaplasia | ||
| CSG: Chronic superficial gastritis | ||
| GC: Gastric cancer | ||
| SIM: Severe intestinal metaplasia | ||
| WIM: Wild intestinal metaplasia | ||
| Liver | 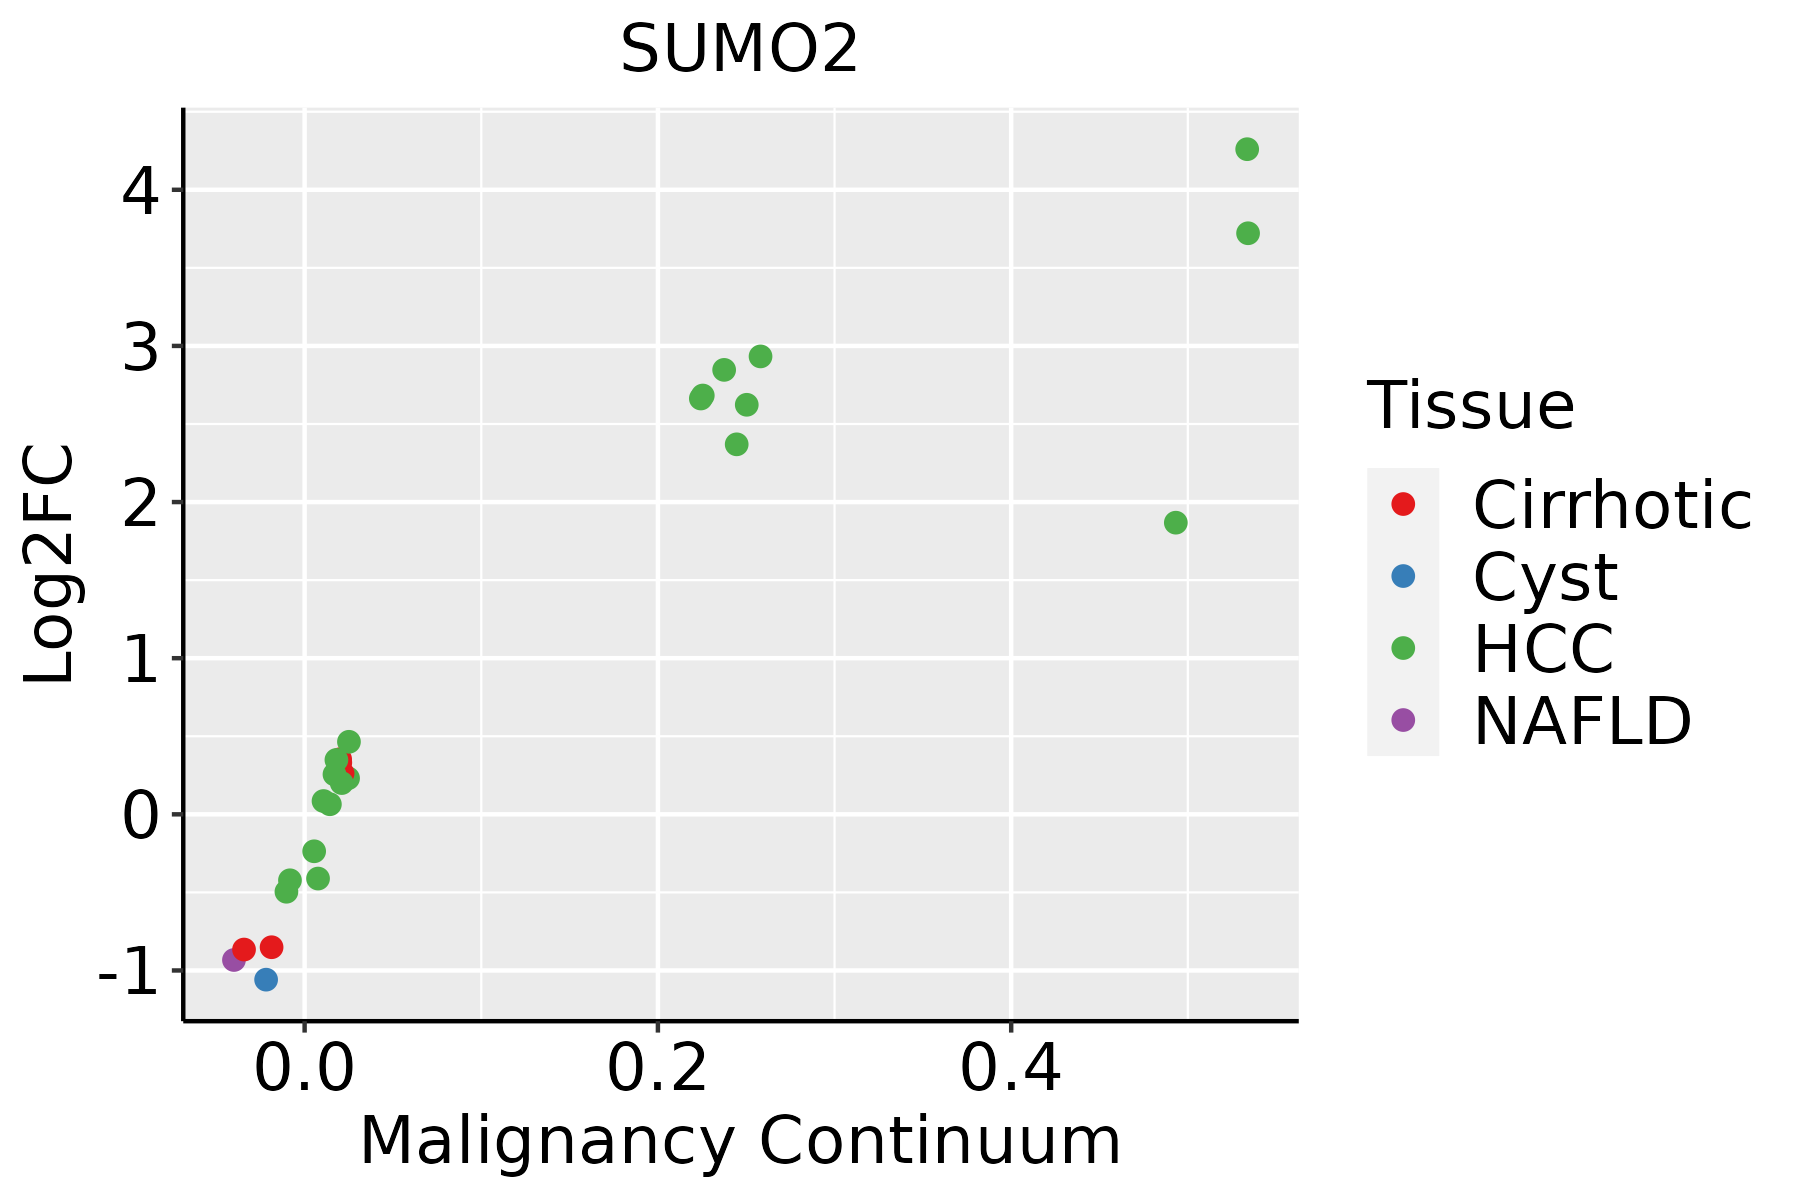 | HCC: Hepatocellular carcinoma |
| NAFLD: Non-alcoholic fatty liver disease | ||
| Oral Cavity |  | EOLP: Erosive Oral lichen planus |
| LP: leukoplakia | ||
| NEOLP: Non-erosive oral lichen planus | ||
| OSCC: Oral squamous cell carcinoma | ||
| Prostate | 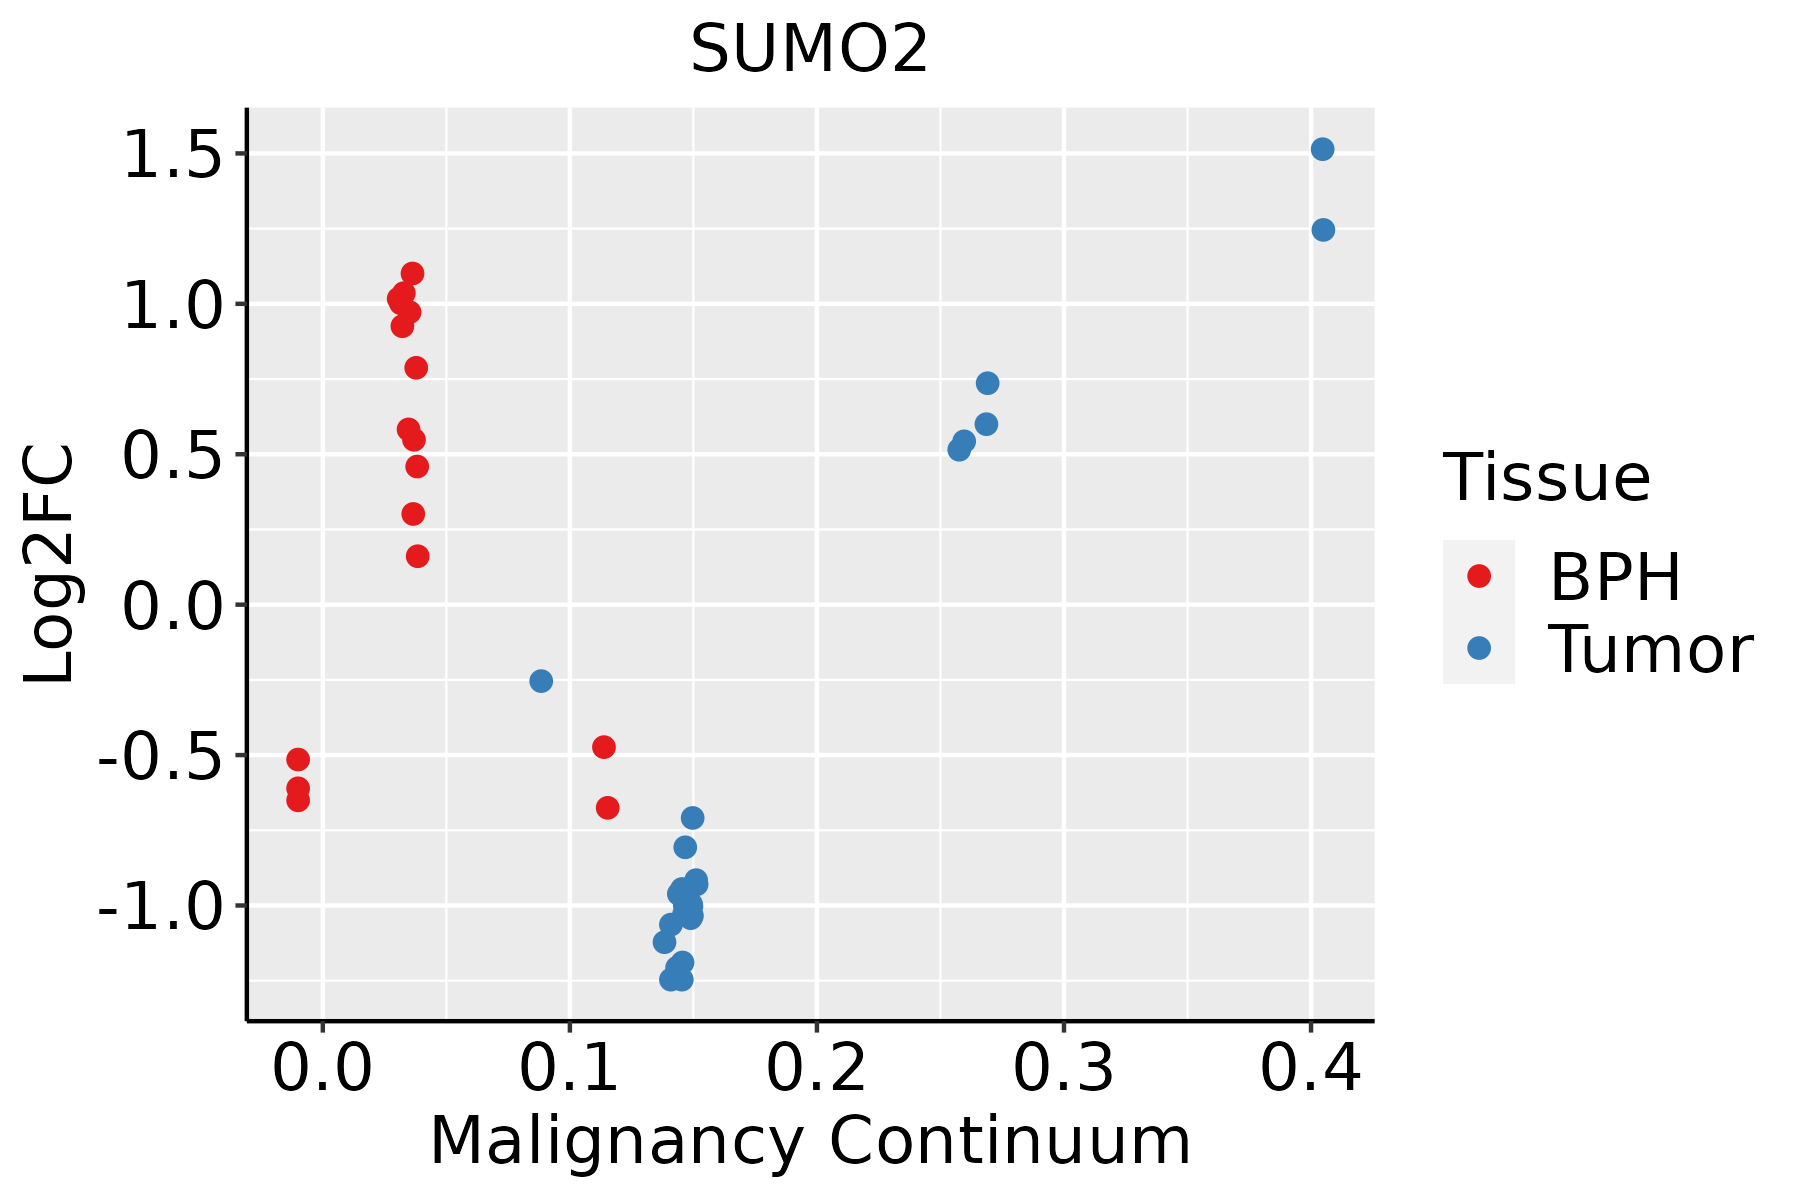 | BPH: Benign Prostatic Hyperplasia |
| Skin |  | AK: Actinic keratosis |
| cSCC: Cutaneous squamous cell carcinoma | ||
| SCCIS:squamous cell carcinoma in situ | ||
| Thyroid | 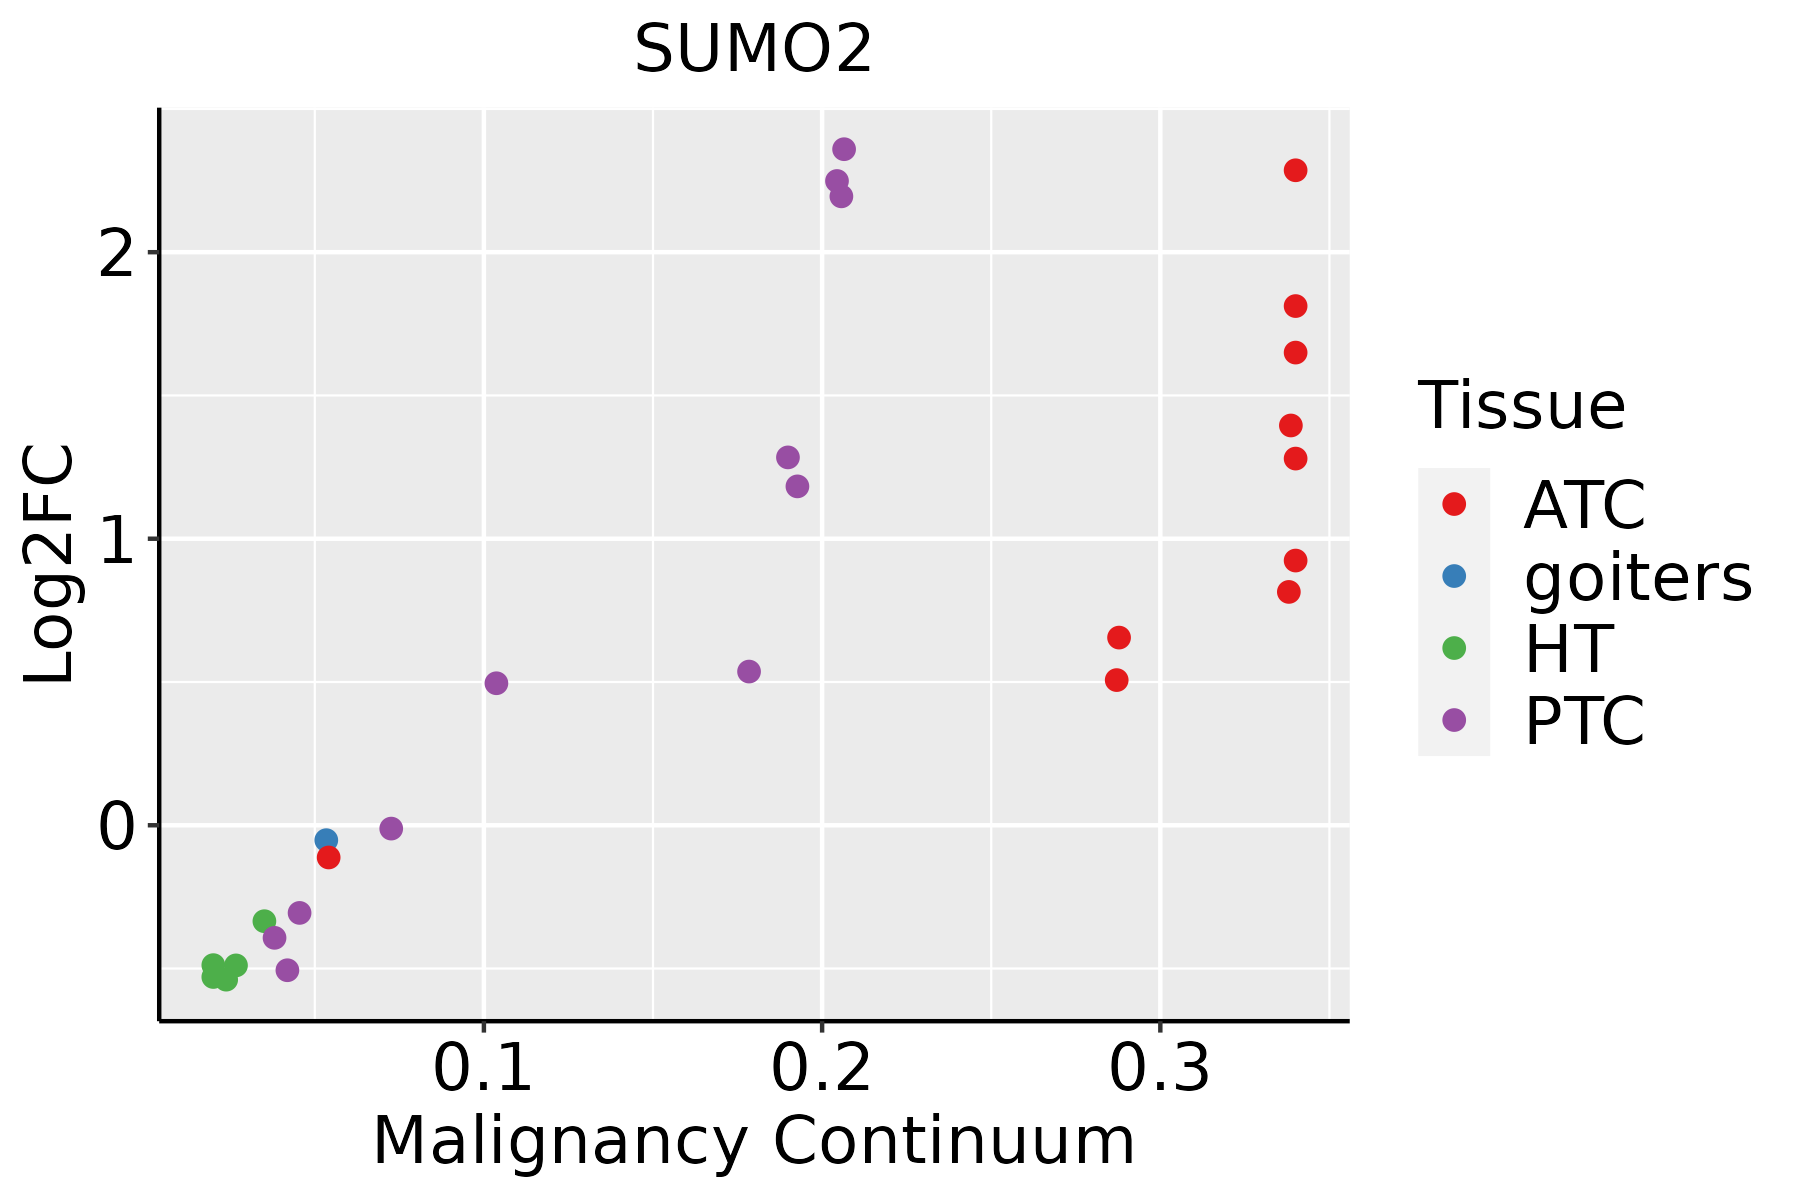 | ATC: Anaplastic thyroid cancer |
| HT: Hashimoto's thyroiditis | ||
| PTC: Papillary thyroid cancer |
| ∗log2FC in expression of this searched gene in stem-like cells from each diseased tissue sample relative to stem-like cells in normal samples in each tissue plotted against the malignancy continuum. Samples are colored based on if they are from different disease stage. |
Top |
Malignant transformation related pathway analysis |
| Find out the enriched GO biological processes and KEGG pathways involved in transition from healthy to precancer to cancer |
| Tissue | Disease Stage | Enriched GO biological Processes |
| Colorectum | AD |  |
| Colorectum | SER |  |
| Colorectum | MSS |  |
| Colorectum | MSI-H |  |
| Colorectum | FAP |  |
| ∗Top 15 enriched GO BP terms are showed in the bar plot of each disease state in each tissue. Each row represents a significant GO biological process which is colored according to the -log10(p.adjust). |
| Page: 1 2 3 4 5 6 7 8 9 |
| GO ID | Tissue | Disease Stage | Description | Gene Ratio | Bg Ratio | pvalue | p.adjust | Count |
| GO:004586214 | Breast | IDC | positive regulation of proteolysis | 66/1434 | 372/18723 | 9.76e-11 | 1.29e-08 | 66 |
| GO:001049814 | Breast | IDC | proteasomal protein catabolic process | 75/1434 | 490/18723 | 5.59e-09 | 4.41e-07 | 75 |
| GO:004217614 | Breast | IDC | regulation of protein catabolic process | 63/1434 | 391/18723 | 1.32e-08 | 9.61e-07 | 63 |
| GO:190336214 | Breast | IDC | regulation of cellular protein catabolic process | 46/1434 | 255/18723 | 4.00e-08 | 2.68e-06 | 46 |
| GO:190305014 | Breast | IDC | regulation of proteolysis involved in cellular protein catabolic process | 41/1434 | 221/18723 | 9.77e-08 | 5.84e-06 | 41 |
| GO:006113614 | Breast | IDC | regulation of proteasomal protein catabolic process | 33/1434 | 187/18723 | 5.24e-06 | 1.75e-04 | 33 |
| GO:190336414 | Breast | IDC | positive regulation of cellular protein catabolic process | 29/1434 | 155/18723 | 5.93e-06 | 1.90e-04 | 29 |
| GO:200005814 | Breast | IDC | regulation of ubiquitin-dependent protein catabolic process | 30/1434 | 164/18723 | 6.62e-06 | 2.05e-04 | 30 |
| GO:004316114 | Breast | IDC | proteasome-mediated ubiquitin-dependent protein catabolic process | 57/1434 | 412/18723 | 9.55e-06 | 2.68e-04 | 57 |
| GO:004573214 | Breast | IDC | positive regulation of protein catabolic process | 37/1434 | 231/18723 | 1.46e-05 | 3.71e-04 | 37 |
| GO:190305213 | Breast | IDC | positive regulation of proteolysis involved in cellular protein catabolic process | 25/1434 | 133/18723 | 2.34e-05 | 5.59e-04 | 25 |
| GO:190180014 | Breast | IDC | positive regulation of proteasomal protein catabolic process | 22/1434 | 114/18723 | 4.68e-05 | 1.04e-03 | 22 |
| GO:000989614 | Breast | IDC | positive regulation of catabolic process | 62/1434 | 492/18723 | 7.06e-05 | 1.42e-03 | 62 |
| GO:003243414 | Breast | IDC | regulation of proteasomal ubiquitin-dependent protein catabolic process | 24/1434 | 134/18723 | 7.59e-05 | 1.50e-03 | 24 |
| GO:00324368 | Breast | IDC | positive regulation of proteasomal ubiquitin-dependent protein catabolic process | 18/1434 | 90/18723 | 1.39e-04 | 2.48e-03 | 18 |
| GO:20000609 | Breast | IDC | positive regulation of ubiquitin-dependent protein catabolic process | 20/1434 | 107/18723 | 1.61e-04 | 2.76e-03 | 20 |
| GO:003133114 | Breast | IDC | positive regulation of cellular catabolic process | 54/1434 | 427/18723 | 1.85e-04 | 3.07e-03 | 54 |
| GO:004586224 | Breast | DCIS | positive regulation of proteolysis | 65/1390 | 372/18723 | 7.13e-11 | 9.17e-09 | 65 |
| GO:001049824 | Breast | DCIS | proteasomal protein catabolic process | 75/1390 | 490/18723 | 1.44e-09 | 1.40e-07 | 75 |
| GO:004217624 | Breast | DCIS | regulation of protein catabolic process | 62/1390 | 391/18723 | 9.98e-09 | 7.53e-07 | 62 |
| Page: 1 2 3 4 5 6 7 8 9 10 11 12 13 14 15 16 17 18 19 20 21 22 23 24 25 26 27 28 |
| Pathway ID | Tissue | Disease Stage | Description | Gene Ratio | Bg Ratio | pvalue | p.adjust | qvalue | Count |
| hsa0541824 | Breast | IDC | Fluid shear stress and atherosclerosis | 34/867 | 139/8465 | 9.41e-07 | 1.61e-05 | 1.20e-05 | 34 |
| hsa0541834 | Breast | IDC | Fluid shear stress and atherosclerosis | 34/867 | 139/8465 | 9.41e-07 | 1.61e-05 | 1.20e-05 | 34 |
| hsa0541844 | Breast | DCIS | Fluid shear stress and atherosclerosis | 34/846 | 139/8465 | 5.31e-07 | 9.03e-06 | 6.65e-06 | 34 |
| hsa0541854 | Breast | DCIS | Fluid shear stress and atherosclerosis | 34/846 | 139/8465 | 5.31e-07 | 9.03e-06 | 6.65e-06 | 34 |
| hsa0541820 | Cervix | CC | Fluid shear stress and atherosclerosis | 50/1267 | 139/8465 | 5.71e-10 | 1.32e-08 | 7.81e-09 | 50 |
| hsa05418110 | Cervix | CC | Fluid shear stress and atherosclerosis | 50/1267 | 139/8465 | 5.71e-10 | 1.32e-08 | 7.81e-09 | 50 |
| hsa05418 | Colorectum | AD | Fluid shear stress and atherosclerosis | 54/2092 | 139/8465 | 1.41e-04 | 1.16e-03 | 7.37e-04 | 54 |
| hsa054181 | Colorectum | AD | Fluid shear stress and atherosclerosis | 54/2092 | 139/8465 | 1.41e-04 | 1.16e-03 | 7.37e-04 | 54 |
| hsa054182 | Colorectum | SER | Fluid shear stress and atherosclerosis | 40/1580 | 139/8465 | 2.28e-03 | 1.75e-02 | 1.27e-02 | 40 |
| hsa054183 | Colorectum | SER | Fluid shear stress and atherosclerosis | 40/1580 | 139/8465 | 2.28e-03 | 1.75e-02 | 1.27e-02 | 40 |
| hsa054184 | Colorectum | MSS | Fluid shear stress and atherosclerosis | 51/1875 | 139/8465 | 6.06e-05 | 5.80e-04 | 3.55e-04 | 51 |
| hsa054185 | Colorectum | MSS | Fluid shear stress and atherosclerosis | 51/1875 | 139/8465 | 6.06e-05 | 5.80e-04 | 3.55e-04 | 51 |
| hsa054186 | Colorectum | MSI-H | Fluid shear stress and atherosclerosis | 25/797 | 139/8465 | 1.11e-03 | 1.20e-02 | 1.01e-02 | 25 |
| hsa054187 | Colorectum | MSI-H | Fluid shear stress and atherosclerosis | 25/797 | 139/8465 | 1.11e-03 | 1.20e-02 | 1.01e-02 | 25 |
| hsa054188 | Colorectum | FAP | Fluid shear stress and atherosclerosis | 45/1404 | 139/8465 | 3.05e-06 | 4.63e-05 | 2.81e-05 | 45 |
| hsa054189 | Colorectum | FAP | Fluid shear stress and atherosclerosis | 45/1404 | 139/8465 | 3.05e-06 | 4.63e-05 | 2.81e-05 | 45 |
| hsa0541826 | Endometrium | AEH | Fluid shear stress and atherosclerosis | 43/1197 | 139/8465 | 2.47e-07 | 3.49e-06 | 2.55e-06 | 43 |
| hsa05418112 | Endometrium | AEH | Fluid shear stress and atherosclerosis | 43/1197 | 139/8465 | 2.47e-07 | 3.49e-06 | 2.55e-06 | 43 |
| hsa0541827 | Endometrium | EEC | Fluid shear stress and atherosclerosis | 45/1237 | 139/8465 | 7.76e-08 | 1.22e-06 | 9.07e-07 | 45 |
| hsa0541836 | Endometrium | EEC | Fluid shear stress and atherosclerosis | 45/1237 | 139/8465 | 7.76e-08 | 1.22e-06 | 9.07e-07 | 45 |
| Page: 1 2 3 4 |
Top |
Cell-cell communication analysis |
| Identification of potential cell-cell interactions between two cell types and their ligand-receptor pairs for different disease states |
| Ligand | Receptor | LRpair | Pathway | Tissue | Disease Stage |
| Page: 1 |
Top |
Single-cell gene regulatory network inference analysis |
| Find out the significant the regulons (TFs) and the target genes of each regulon across cell types for different disease states |
| TF | Cell Type | Tissue | Disease Stage | Target Gene | RSS | Regulon Activity |
| ∗The dot plots of a searched regulon are shown for all cell subpopulations in each disease state of each tissue based on the regulon specific score inferred using pySCENIC and by calculating the average expression. |
| Page: 1 |
Top |
Somatic mutation of malignant transformation related genes |
| Annotation of somatic variants for genes involved in malignant transformation |
| Hugo Symbol | Variant Class | Variant Classification | dbSNP RS | HGVSc | HGVSp | HGVSp Short | SWISSPROT | BIOTYPE | SIFT | PolyPhen | Tumor Sample Barcode | Tissue | Histology | Sex | Age | Stage | Therapy Types | Drugs | Outcome |
| SUMO2 | SNV | Missense_Mutation | novel | c.76N>A | p.Asp26Asn | p.D26N | P61956 | protein_coding | deleterious(0.03) | benign(0.322) | TCGA-BH-A0H5-01 | Breast | breast invasive carcinoma | Female | <65 | I/II | Chemotherapy | cytoxan | CR |
| SUMO2 | SNV | Missense_Mutation | novel | c.272N>T | p.Thr91Met | p.T91M | P61956 | protein_coding | deleterious(0.03) | benign(0.37) | TCGA-A5-A2K7-01 | Endometrium | uterine corpus endometrioid carcinoma | Female | <65 | I/II | Chemotherapy | taxol | SD |
| SUMO2 | SNV | Missense_Mutation | novel | c.272N>T | p.Thr91Met | p.T91M | P61956 | protein_coding | deleterious(0.03) | benign(0.37) | TCGA-AX-A3FS-01 | Endometrium | uterine corpus endometrioid carcinoma | Female | >=65 | I/II | Unknown | Unknown | SD |
| SUMO2 | SNV | Missense_Mutation | novel | c.99N>T | p.Lys33Asn | p.K33N | P61956 | protein_coding | deleterious(0.02) | benign(0.283) | TCGA-BS-A0UF-01 | Endometrium | uterine corpus endometrioid carcinoma | Female | >=65 | I/II | Unknown | Unknown | SD |
| SUMO2 | SNV | Missense_Mutation | c.146A>C | p.Glu49Ala | p.E49A | P61956 | protein_coding | deleterious(0.02) | benign(0.065) | TCGA-BS-A0UV-01 | Endometrium | uterine corpus endometrioid carcinoma | Female | <65 | III/IV | Unknown | Unknown | SD | |
| SUMO2 | SNV | Missense_Mutation | novel | c.70G>T | p.Gly24Trp | p.G24W | P61956 | protein_coding | deleterious(0) | benign(0.186) | TCGA-95-7043-01 | Lung | lung adenocarcinoma | Female | <65 | I/II | Unknown | Unknown | PD |
| SUMO2 | deletion | Frame_Shift_Del | novel | c.36_37delNN | p.Asn14GlnfsTer5 | p.N14Qfs*5 | P61956 | protein_coding | TCGA-2A-A8W3-01 | Prostate | prostate adenocarcinoma | Male | >=65 | 9 | Unknown | Unknown | PD | ||
| SUMO2 | insertion | Nonsense_Mutation | novel | c.53_54insGTAAATA | p.Ile18MetfsTer2 | p.I18Mfs*2 | P61956 | protein_coding | TCGA-FY-A4B0-01 | Thyroid | thyroid carcinoma | Male | >=65 | I/II | Hormone Therapy | synthroid | SD |
| Page: 1 |
Top |
Related drugs of malignant transformation related genes |
| Identification of chemicals and drugs interact with genes involved in malignant transfromation |
| (DGIdb 4.0) |
| Entrez ID | Symbol | Category | Interaction Types | Drug Claim Name | Drug Name | PMIDs |
| 6613 | SUMO2 | ENZYME | BITHIONOLOXIDE | BITHIONOLOXIDE | ||
| 6613 | SUMO2 | ENZYME | HEXACHLOROPHENE | HEXACHLOROPHENE |
| Page: 1 |

Copyright 2023-Present -The University of Texas Health Science Center at Houston |