
|
|||||
|
 | |
| |
| |
| |
| |
| |
|
Gene: SUMO1 |
Gene summary for SUMO1 |
| Gene information | Species | Human | Gene symbol | SUMO1 | Gene ID | 7341 |
| Gene name | small ubiquitin like modifier 1 | |
| Gene Alias | DAP1 | |
| Cytomap | 2q33.1 | |
| Gene Type | protein-coding | GO ID | GO:0001508 | UniProtAcc | A0A024R3Z2 |
Top |
Malignant transformation analysis |
| Identification of the aberrant gene expression in precancerous and cancerous lesions by comparing the gene expression of stem-like cells in diseased tissues with normal stem cells |
| Entrez ID | Symbol | Replicates | Species | Organ | Tissue | Adj P-value | Log2FC | Malignancy |
| 7341 | SUMO1 | GSM4909281 | Human | Breast | IDC | 1.04e-35 | 6.41e-01 | 0.21 |
| 7341 | SUMO1 | GSM4909285 | Human | Breast | IDC | 1.80e-09 | 4.33e-01 | 0.21 |
| 7341 | SUMO1 | GSM4909290 | Human | Breast | IDC | 3.53e-05 | 3.36e-01 | 0.2096 |
| 7341 | SUMO1 | GSM4909294 | Human | Breast | IDC | 6.41e-12 | 1.74e-02 | 0.2022 |
| 7341 | SUMO1 | GSM4909295 | Human | Breast | IDC | 7.98e-03 | 2.97e-01 | 0.0898 |
| 7341 | SUMO1 | GSM4909296 | Human | Breast | IDC | 1.00e-23 | -3.22e-01 | 0.1524 |
| 7341 | SUMO1 | GSM4909297 | Human | Breast | IDC | 4.56e-30 | -1.13e-01 | 0.1517 |
| 7341 | SUMO1 | GSM4909301 | Human | Breast | IDC | 9.85e-19 | -3.88e-01 | 0.1577 |
| 7341 | SUMO1 | GSM4909308 | Human | Breast | IDC | 2.85e-14 | 4.25e-01 | 0.158 |
| 7341 | SUMO1 | GSM4909311 | Human | Breast | IDC | 5.48e-56 | -4.84e-01 | 0.1534 |
| 7341 | SUMO1 | GSM4909312 | Human | Breast | IDC | 2.57e-26 | 1.34e-01 | 0.1552 |
| 7341 | SUMO1 | GSM4909313 | Human | Breast | IDC | 5.50e-07 | 3.78e-02 | 0.0391 |
| 7341 | SUMO1 | GSM4909315 | Human | Breast | IDC | 2.85e-04 | 1.89e-01 | 0.21 |
| 7341 | SUMO1 | GSM4909316 | Human | Breast | IDC | 3.28e-05 | 1.50e-01 | 0.21 |
| 7341 | SUMO1 | GSM4909318 | Human | Breast | IDC | 5.05e-03 | 2.09e-01 | 0.2031 |
| 7341 | SUMO1 | GSM4909319 | Human | Breast | IDC | 1.27e-69 | -4.58e-01 | 0.1563 |
| 7341 | SUMO1 | GSM4909320 | Human | Breast | IDC | 5.78e-10 | -4.49e-01 | 0.1575 |
| 7341 | SUMO1 | GSM4909321 | Human | Breast | IDC | 9.11e-28 | -1.53e-01 | 0.1559 |
| 7341 | SUMO1 | M2 | Human | Breast | IDC | 3.98e-02 | -4.47e-03 | 0.21 |
| 7341 | SUMO1 | NCCBC14 | Human | Breast | DCIS | 4.49e-17 | -1.06e-01 | 0.2021 |
| Page: 1 2 3 4 5 6 7 8 9 10 11 12 |
| Tissue | Expression Dynamics | Abbreviation |
| Breast | 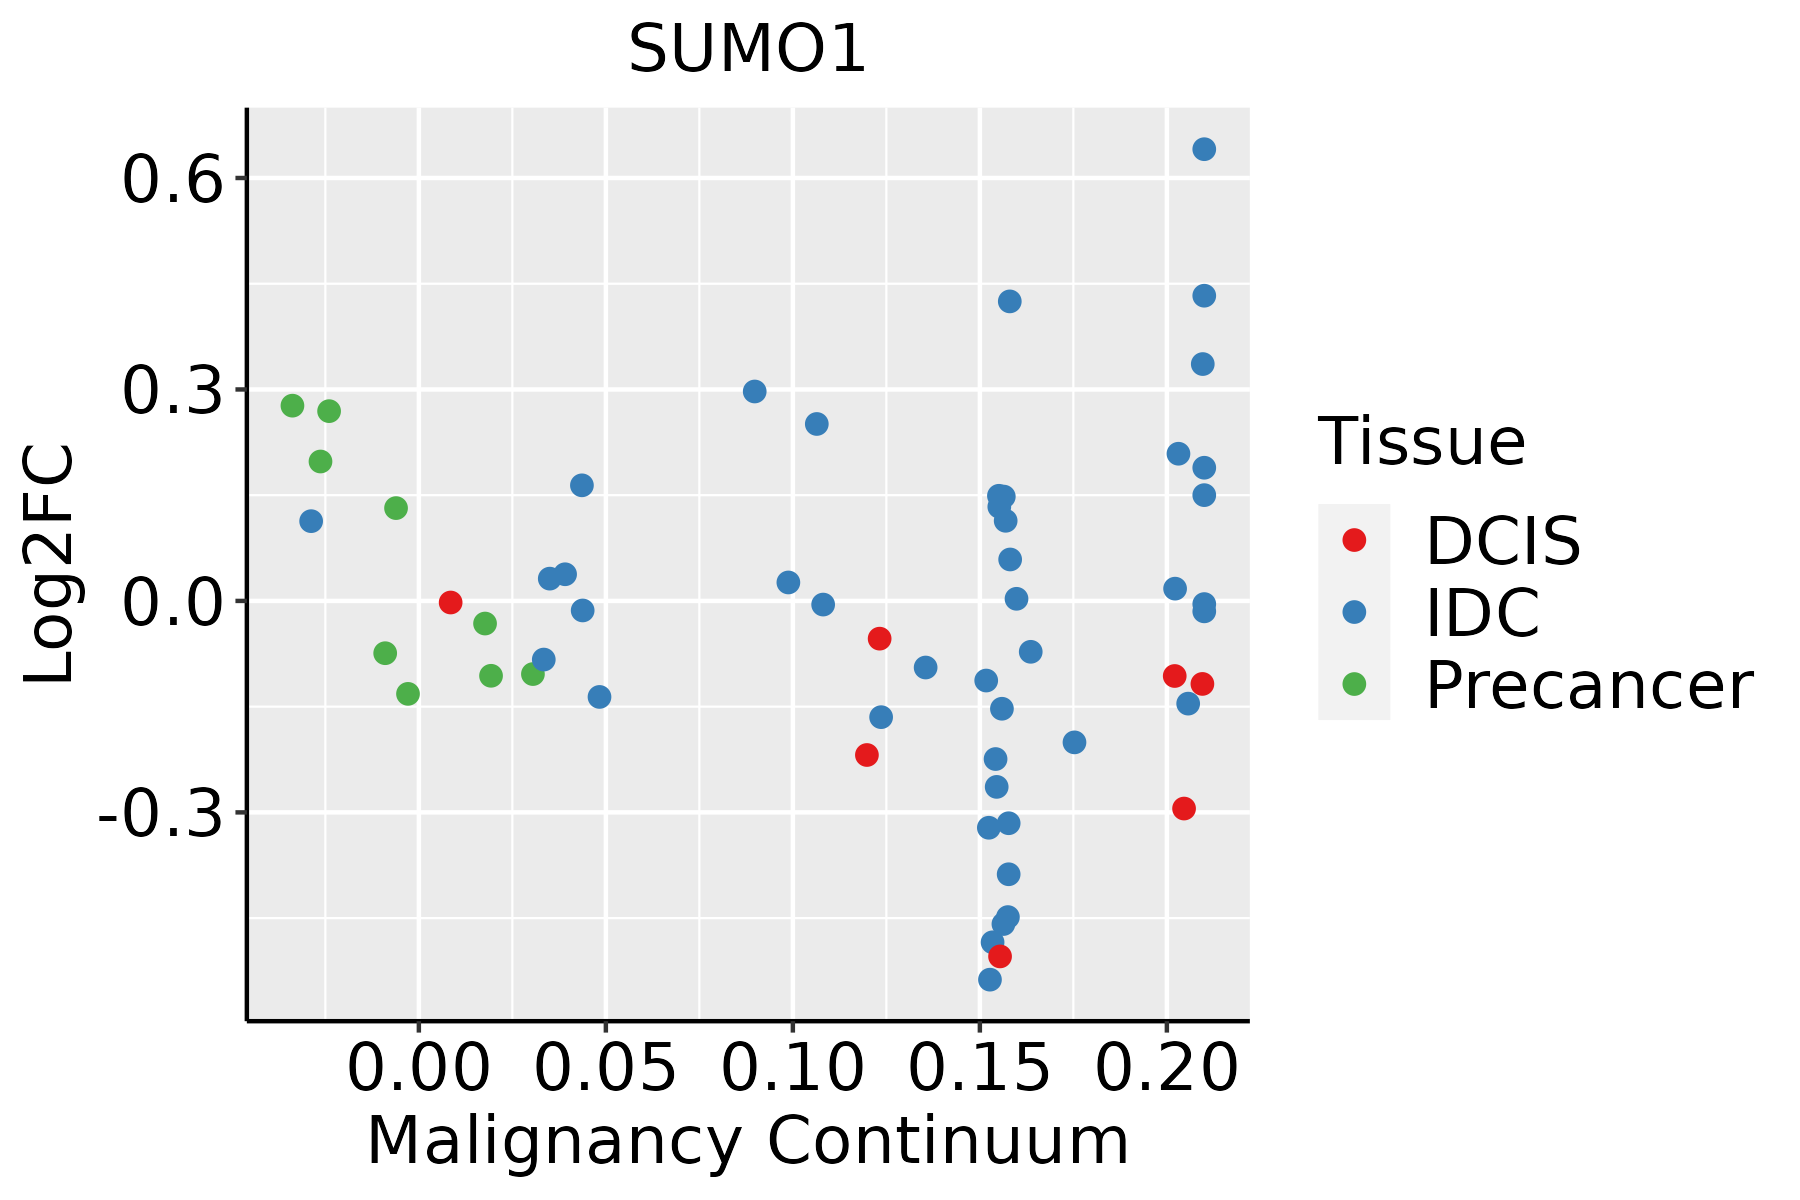 | IDC: Invasive ductal carcinoma |
| DCIS: Ductal carcinoma in situ | ||
| Precancer(BRCA1-mut): Precancerous lesion from BRCA1 mutation carriers | ||
| Endometrium |  | AEH: Atypical endometrial hyperplasia |
| EEC: Endometrioid Cancer | ||
| Esophagus |  | ESCC: Esophageal squamous cell carcinoma |
| HGIN: High-grade intraepithelial neoplasias | ||
| LGIN: Low-grade intraepithelial neoplasias | ||
| GC | 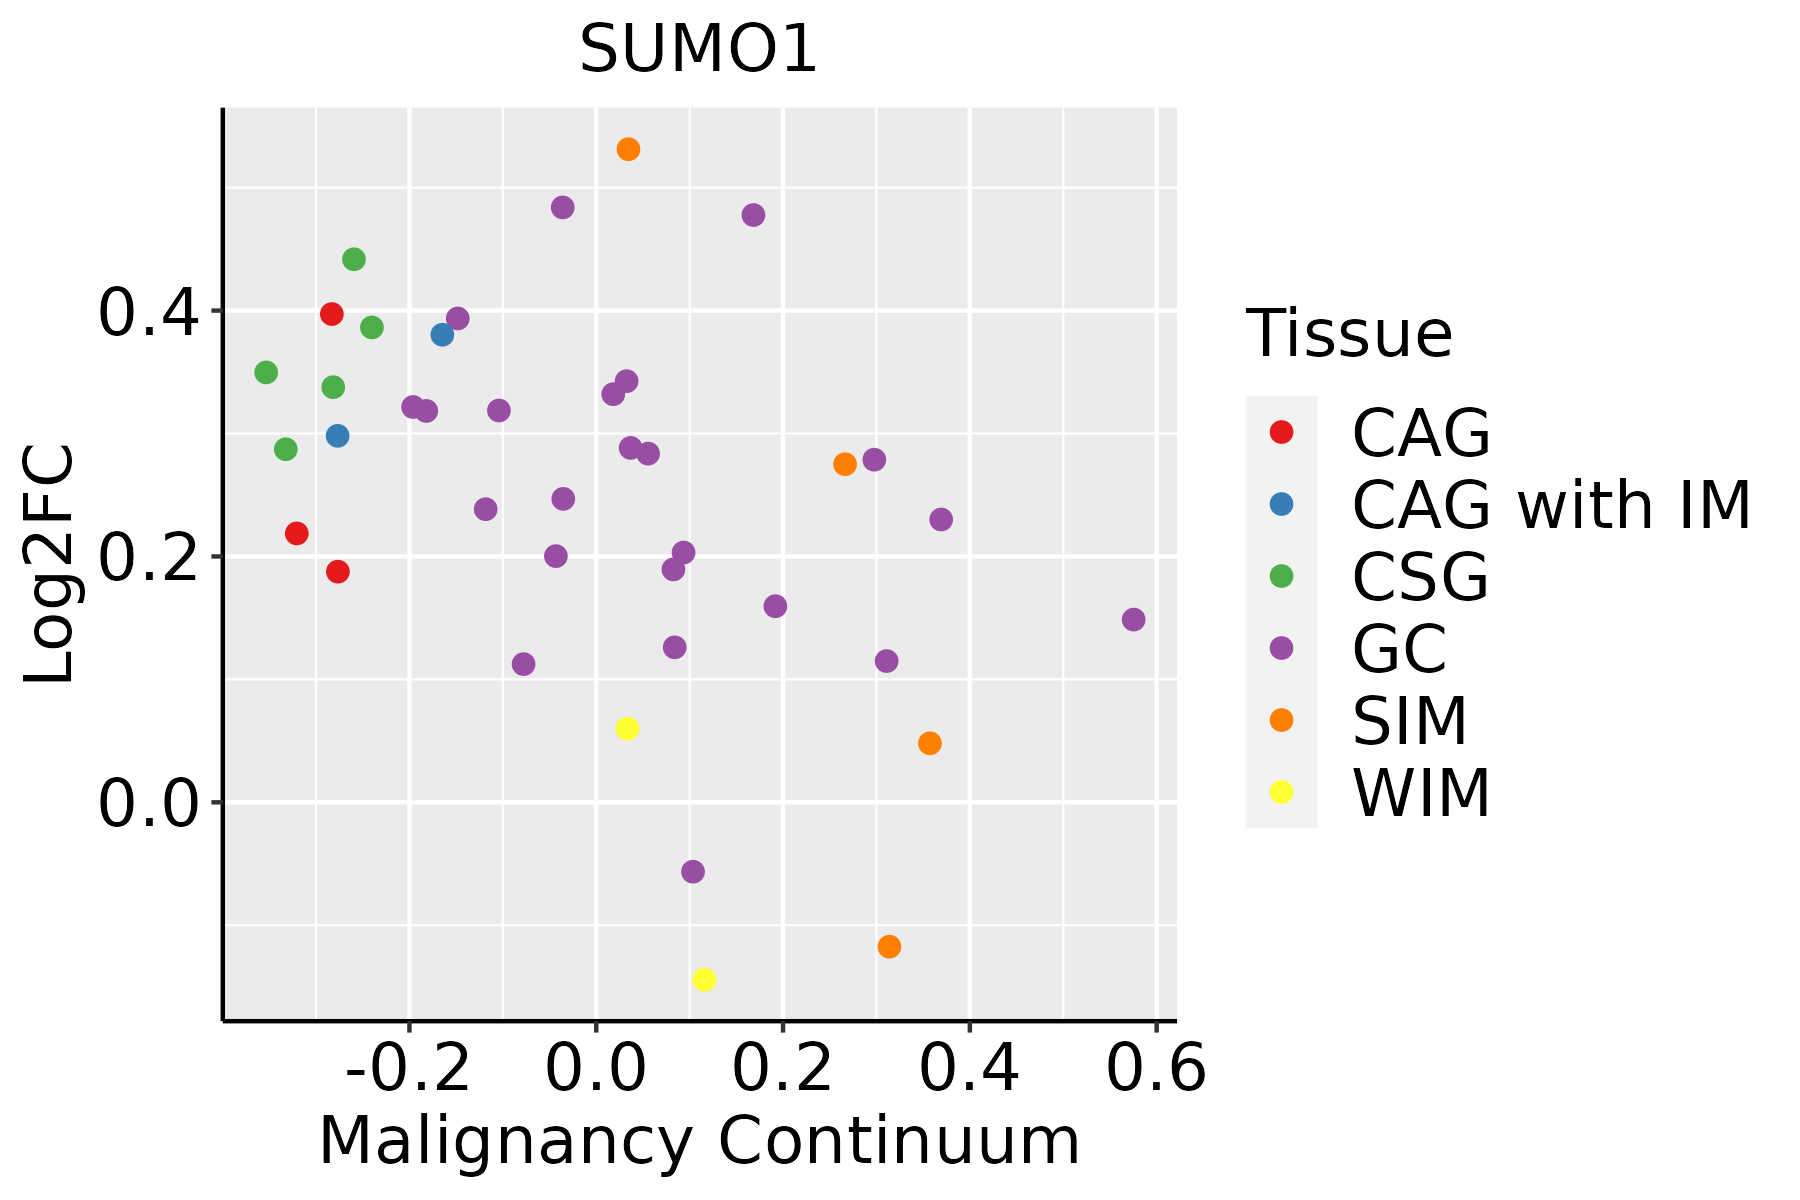 | CAG: Chronic atrophic gastritis |
| CAG with IM: Chronic atrophic gastritis with intestinal metaplasia | ||
| CSG: Chronic superficial gastritis | ||
| GC: Gastric cancer | ||
| SIM: Severe intestinal metaplasia | ||
| WIM: Wild intestinal metaplasia | ||
| Liver |  | HCC: Hepatocellular carcinoma |
| NAFLD: Non-alcoholic fatty liver disease | ||
| Oral Cavity |  | EOLP: Erosive Oral lichen planus |
| LP: leukoplakia | ||
| NEOLP: Non-erosive oral lichen planus | ||
| OSCC: Oral squamous cell carcinoma | ||
| Prostate |  | BPH: Benign Prostatic Hyperplasia |
| Skin |  | AK: Actinic keratosis |
| cSCC: Cutaneous squamous cell carcinoma | ||
| SCCIS:squamous cell carcinoma in situ | ||
| Thyroid | 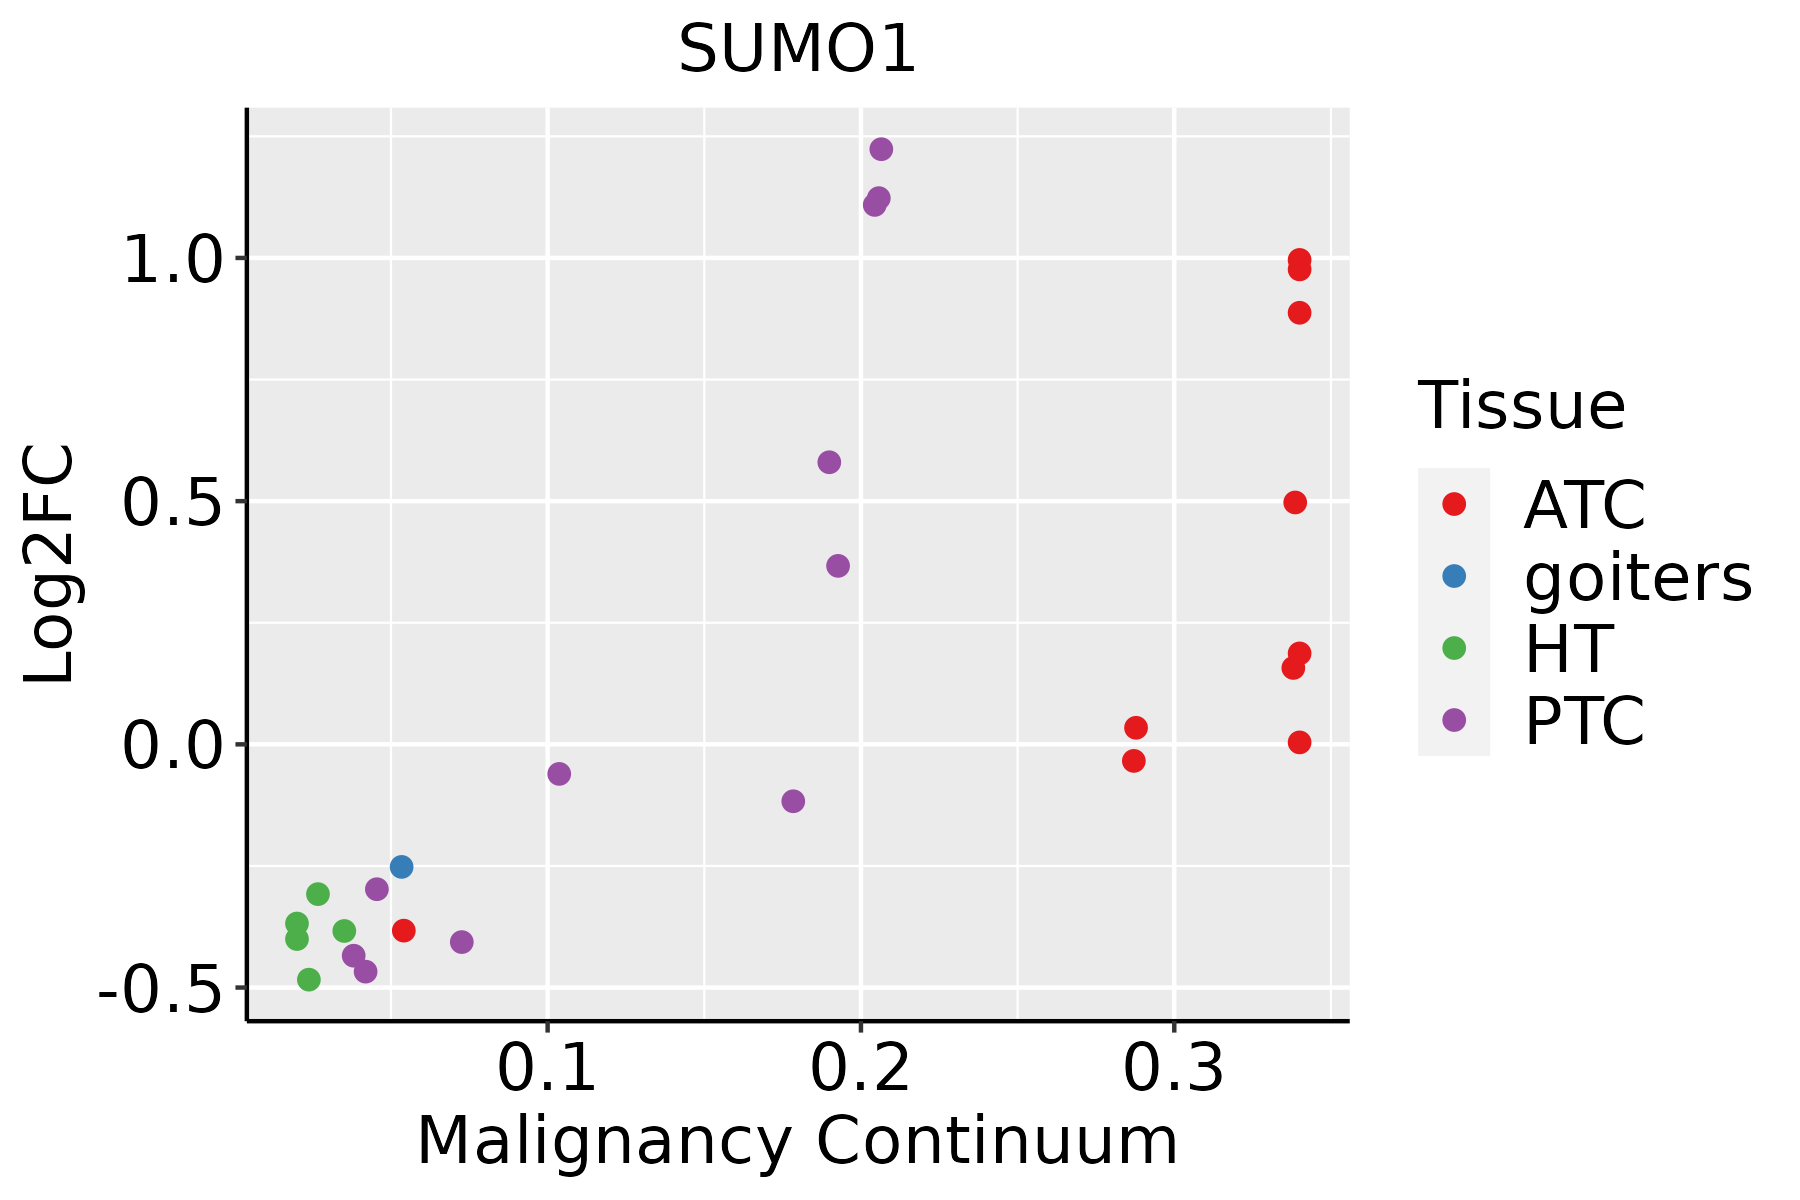 | ATC: Anaplastic thyroid cancer |
| HT: Hashimoto's thyroiditis | ||
| PTC: Papillary thyroid cancer |
| ∗log2FC in expression of this searched gene in stem-like cells from each diseased tissue sample relative to stem-like cells in normal samples in each tissue plotted against the malignancy continuum. Samples are colored based on if they are from different disease stage. |
Top |
Malignant transformation related pathway analysis |
| Find out the enriched GO biological processes and KEGG pathways involved in transition from healthy to precancer to cancer |
| Tissue | Disease Stage | Enriched GO biological Processes |
| Colorectum | AD |  |
| Colorectum | SER |  |
| Colorectum | MSS |  |
| Colorectum | MSI-H |  |
| Colorectum | FAP |  |
| ∗Top 15 enriched GO BP terms are showed in the bar plot of each disease state in each tissue. Each row represents a significant GO biological process which is colored according to the -log10(p.adjust). |
| Page: 1 2 3 4 5 6 7 8 9 |
| GO ID | Tissue | Disease Stage | Description | Gene Ratio | Bg Ratio | pvalue | p.adjust | Count |
| GO:004586214 | Breast | IDC | positive regulation of proteolysis | 66/1434 | 372/18723 | 9.76e-11 | 1.29e-08 | 66 |
| GO:001003814 | Breast | IDC | response to metal ion | 65/1434 | 373/18723 | 2.95e-10 | 3.42e-08 | 65 |
| GO:001049814 | Breast | IDC | proteasomal protein catabolic process | 75/1434 | 490/18723 | 5.59e-09 | 4.41e-07 | 75 |
| GO:004217614 | Breast | IDC | regulation of protein catabolic process | 63/1434 | 391/18723 | 1.32e-08 | 9.61e-07 | 63 |
| GO:190336214 | Breast | IDC | regulation of cellular protein catabolic process | 46/1434 | 255/18723 | 4.00e-08 | 2.68e-06 | 46 |
| GO:190305014 | Breast | IDC | regulation of proteolysis involved in cellular protein catabolic process | 41/1434 | 221/18723 | 9.77e-08 | 5.84e-06 | 41 |
| GO:003164714 | Breast | IDC | regulation of protein stability | 50/1434 | 298/18723 | 1.14e-07 | 6.57e-06 | 50 |
| GO:005109814 | Breast | IDC | regulation of binding | 57/1434 | 363/18723 | 1.59e-07 | 8.76e-06 | 57 |
| GO:004668613 | Breast | IDC | response to cadmium ion | 19/1434 | 68/18723 | 4.97e-07 | 2.45e-05 | 19 |
| GO:000926612 | Breast | IDC | response to temperature stimulus | 34/1434 | 178/18723 | 5.88e-07 | 2.83e-05 | 34 |
| GO:005110114 | Breast | IDC | regulation of DNA binding | 26/1434 | 118/18723 | 7.42e-07 | 3.40e-05 | 26 |
| GO:005082114 | Breast | IDC | protein stabilization | 35/1434 | 191/18723 | 1.12e-06 | 5.04e-05 | 35 |
| GO:004325414 | Breast | IDC | regulation of protein-containing complex assembly | 61/1434 | 428/18723 | 1.77e-06 | 7.31e-05 | 61 |
| GO:003133414 | Breast | IDC | positive regulation of protein-containing complex assembly | 40/1434 | 237/18723 | 1.77e-06 | 7.31e-05 | 40 |
| GO:006113614 | Breast | IDC | regulation of proteasomal protein catabolic process | 33/1434 | 187/18723 | 5.24e-06 | 1.75e-04 | 33 |
| GO:190336414 | Breast | IDC | positive regulation of cellular protein catabolic process | 29/1434 | 155/18723 | 5.93e-06 | 1.90e-04 | 29 |
| GO:200005814 | Breast | IDC | regulation of ubiquitin-dependent protein catabolic process | 30/1434 | 164/18723 | 6.62e-06 | 2.05e-04 | 30 |
| GO:004316114 | Breast | IDC | proteasome-mediated ubiquitin-dependent protein catabolic process | 57/1434 | 412/18723 | 9.55e-06 | 2.68e-04 | 57 |
| GO:003460513 | Breast | IDC | cellular response to heat | 17/1434 | 69/18723 | 1.26e-05 | 3.29e-04 | 17 |
| GO:004573214 | Breast | IDC | positive regulation of protein catabolic process | 37/1434 | 231/18723 | 1.46e-05 | 3.71e-04 | 37 |
| Page: 1 2 3 4 5 6 7 8 9 10 11 12 13 14 15 16 17 18 19 20 21 22 23 24 25 26 27 28 29 30 31 32 33 34 35 36 37 38 39 40 41 42 43 44 45 46 47 48 49 50 51 |
| Pathway ID | Tissue | Disease Stage | Description | Gene Ratio | Bg Ratio | pvalue | p.adjust | qvalue | Count |
| hsa0541824 | Breast | IDC | Fluid shear stress and atherosclerosis | 34/867 | 139/8465 | 9.41e-07 | 1.61e-05 | 1.20e-05 | 34 |
| hsa0541834 | Breast | IDC | Fluid shear stress and atherosclerosis | 34/867 | 139/8465 | 9.41e-07 | 1.61e-05 | 1.20e-05 | 34 |
| hsa0541844 | Breast | DCIS | Fluid shear stress and atherosclerosis | 34/846 | 139/8465 | 5.31e-07 | 9.03e-06 | 6.65e-06 | 34 |
| hsa0541854 | Breast | DCIS | Fluid shear stress and atherosclerosis | 34/846 | 139/8465 | 5.31e-07 | 9.03e-06 | 6.65e-06 | 34 |
| hsa0541826 | Endometrium | AEH | Fluid shear stress and atherosclerosis | 43/1197 | 139/8465 | 2.47e-07 | 3.49e-06 | 2.55e-06 | 43 |
| hsa05418112 | Endometrium | AEH | Fluid shear stress and atherosclerosis | 43/1197 | 139/8465 | 2.47e-07 | 3.49e-06 | 2.55e-06 | 43 |
| hsa0541827 | Endometrium | EEC | Fluid shear stress and atherosclerosis | 45/1237 | 139/8465 | 7.76e-08 | 1.22e-06 | 9.07e-07 | 45 |
| hsa0541836 | Endometrium | EEC | Fluid shear stress and atherosclerosis | 45/1237 | 139/8465 | 7.76e-08 | 1.22e-06 | 9.07e-07 | 45 |
| hsa0541839 | Esophagus | HGIN | Fluid shear stress and atherosclerosis | 42/1383 | 139/8465 | 2.92e-05 | 3.81e-04 | 3.02e-04 | 42 |
| hsa030137 | Esophagus | HGIN | Nucleocytoplasmic transport | 31/1383 | 108/8465 | 8.29e-04 | 7.95e-03 | 6.31e-03 | 31 |
| hsa05418115 | Esophagus | HGIN | Fluid shear stress and atherosclerosis | 42/1383 | 139/8465 | 2.92e-05 | 3.81e-04 | 3.02e-04 | 42 |
| hsa0301312 | Esophagus | HGIN | Nucleocytoplasmic transport | 31/1383 | 108/8465 | 8.29e-04 | 7.95e-03 | 6.31e-03 | 31 |
| hsa0301321 | Esophagus | ESCC | Nucleocytoplasmic transport | 89/4205 | 108/8465 | 1.20e-12 | 2.37e-11 | 1.21e-11 | 89 |
| hsa05418211 | Esophagus | ESCC | Fluid shear stress and atherosclerosis | 109/4205 | 139/8465 | 2.00e-12 | 3.72e-11 | 1.90e-11 | 109 |
| hsa0301331 | Esophagus | ESCC | Nucleocytoplasmic transport | 89/4205 | 108/8465 | 1.20e-12 | 2.37e-11 | 1.21e-11 | 89 |
| hsa05418310 | Esophagus | ESCC | Fluid shear stress and atherosclerosis | 109/4205 | 139/8465 | 2.00e-12 | 3.72e-11 | 1.90e-11 | 109 |
| hsa0541822 | Liver | Cirrhotic | Fluid shear stress and atherosclerosis | 62/2530 | 139/8465 | 1.53e-04 | 1.06e-03 | 6.54e-04 | 62 |
| hsa0541832 | Liver | Cirrhotic | Fluid shear stress and atherosclerosis | 62/2530 | 139/8465 | 1.53e-04 | 1.06e-03 | 6.54e-04 | 62 |
| hsa03013 | Liver | HCC | Nucleocytoplasmic transport | 81/4020 | 108/8465 | 4.28e-09 | 6.83e-08 | 3.80e-08 | 81 |
| hsa0541842 | Liver | HCC | Fluid shear stress and atherosclerosis | 89/4020 | 139/8465 | 5.58e-05 | 2.88e-04 | 1.60e-04 | 89 |
| Page: 1 2 3 |
Top |
Cell-cell communication analysis |
| Identification of potential cell-cell interactions between two cell types and their ligand-receptor pairs for different disease states |
| Ligand | Receptor | LRpair | Pathway | Tissue | Disease Stage |
| Page: 1 |
Top |
Single-cell gene regulatory network inference analysis |
| Find out the significant the regulons (TFs) and the target genes of each regulon across cell types for different disease states |
| TF | Cell Type | Tissue | Disease Stage | Target Gene | RSS | Regulon Activity |
| ∗The dot plots of a searched regulon are shown for all cell subpopulations in each disease state of each tissue based on the regulon specific score inferred using pySCENIC and by calculating the average expression. |
| Page: 1 |
Top |
Somatic mutation of malignant transformation related genes |
| Annotation of somatic variants for genes involved in malignant transformation |
| Hugo Symbol | Variant Class | Variant Classification | dbSNP RS | HGVSc | HGVSp | HGVSp Short | SWISSPROT | BIOTYPE | SIFT | PolyPhen | Tumor Sample Barcode | Tissue | Histology | Sex | Age | Stage | Therapy Types | Drugs | Outcome |
| SUMO1 | SNV | Missense_Mutation | c.88N>C | p.Asp30His | p.D30H | P63165 | protein_coding | deleterious(0) | probably_damaging(0.977) | TCGA-BI-A0VS-01 | Cervix | cervical & endocervical cancer | Female | <65 | I/II | Unknown | Unknown | SD | |
| SUMO1 | SNV | Missense_Mutation | c.48N>C | p.Lys16Asn | p.K16N | P63165 | protein_coding | tolerated(0.09) | benign(0.142) | TCGA-DR-A0ZM-01 | Cervix | cervical & endocervical cancer | Female | <65 | III/IV | Unspecific | Cisplatin | SD | |
| SUMO1 | SNV | Missense_Mutation | novel | c.217N>A | p.Asp73Asn | p.D73N | P63165 | protein_coding | deleterious(0.04) | probably_damaging(0.998) | TCGA-VS-A950-01 | Cervix | cervical & endocervical cancer | Female | <65 | III/IV | Unknown | Unknown | SD |
| SUMO1 | SNV | Missense_Mutation | novel | c.166N>A | p.Gly56Ser | p.G56S | P63165 | protein_coding | deleterious(0.04) | benign(0.146) | TCGA-AP-A1DK-01 | Endometrium | uterine corpus endometrioid carcinoma | Female | <65 | I/II | Unknown | Unknown | SD |
| SUMO1 | SNV | Missense_Mutation | novel | c.209N>T | p.Arg70Ile | p.R70I | P63165 | protein_coding | deleterious(0.01) | possibly_damaging(0.896) | TCGA-AP-A1DV-01 | Endometrium | uterine corpus endometrioid carcinoma | Female | <65 | I/II | Unknown | Unknown | SD |
| SUMO1 | SNV | Missense_Mutation | novel | c.220A>G | p.Asn74Asp | p.N74D | P63165 | protein_coding | tolerated(0.38) | benign(0.005) | TCGA-B5-A1MR-01 | Endometrium | uterine corpus endometrioid carcinoma | Female | >=65 | III/IV | Unknown | Unknown | SD |
| SUMO1 | SNV | Missense_Mutation | novel | c.39N>T | p.Leu13Phe | p.L13F | P63165 | protein_coding | deleterious(0.04) | benign(0.399) | TCGA-KP-A3VZ-01 | Endometrium | uterine corpus endometrioid carcinoma | Female | >=65 | III/IV | Unknown | Unknown | SD |
| SUMO1 | SNV | Missense_Mutation | c.265N>C | p.Glu89Gln | p.E89Q | P63165 | protein_coding | deleterious(0) | possibly_damaging(0.745) | TCGA-MP-A4SY-01 | Lung | lung adenocarcinoma | Male | <65 | I/II | Unknown | Unknown | PD | |
| SUMO1 | deletion | Frame_Shift_Del | c.242delN | p.Gly81GlufsTer7 | p.G81Efs*7 | P63165 | protein_coding | TCGA-86-8075-01 | Lung | lung adenocarcinoma | Female | >=65 | I/II | Chemotherapy | etoposide | CR | |||
| SUMO1 | deletion | Frame_Shift_Del | novel | c.13delN | p.Glu5ArgfsTer34 | p.E5Rfs*34 | P63165 | protein_coding | TCGA-34-5231-01 | Lung | lung squamous cell carcinoma | Male | >=65 | I/II | Unknown | Unknown | SD |
| Page: 1 2 |
Top |
Related drugs of malignant transformation related genes |
| Identification of chemicals and drugs interact with genes involved in malignant transfromation |
| (DGIdb 4.0) |
| Entrez ID | Symbol | Category | Interaction Types | Drug Claim Name | Drug Name | PMIDs |
| 7341 | SUMO1 | ENZYME, DNA REPAIR, TRANSCRIPTION FACTOR BINDING | 3,8'-BIAPIGENIN | CHEMBL515252 | ||
| 7341 | SUMO1 | ENZYME, DNA REPAIR, TRANSCRIPTION FACTOR BINDING | NSC-60339 | CHEMBL1448793 | ||
| 7341 | SUMO1 | ENZYME, DNA REPAIR, TRANSCRIPTION FACTOR BINDING | NSC-155693 | CHEMBL68096 | ||
| 7341 | SUMO1 | ENZYME, DNA REPAIR, TRANSCRIPTION FACTOR BINDING | STICTIC ACID | STICTIC ACID | ||
| 7341 | SUMO1 | ENZYME, DNA REPAIR, TRANSCRIPTION FACTOR BINDING | ZINC 03369470 | CHEMBL599013 | ||
| 7341 | SUMO1 | ENZYME, DNA REPAIR, TRANSCRIPTION FACTOR BINDING | CEFDINIR | CEFDINIR | ||
| 7341 | SUMO1 | ENZYME, DNA REPAIR, TRANSCRIPTION FACTOR BINDING | NSC-60340 | CHEMBL1534034 | ||
| 7341 | SUMO1 | ENZYME, DNA REPAIR, TRANSCRIPTION FACTOR BINDING | HTS-05057 | CHEMBL372629 | ||
| 7341 | SUMO1 | ENZYME, DNA REPAIR, TRANSCRIPTION FACTOR BINDING | CLOSANTEL | CLOSANTEL | ||
| 7341 | SUMO1 | ENZYME, DNA REPAIR, TRANSCRIPTION FACTOR BINDING | TCMDC-125182 | CHEMBL588143 |
| Page: 1 2 |

Copyright 2023-Present -The University of Texas Health Science Center at Houston |