
|
|||||
|
 | |
| |
| |
| |
| |
| |
|
Gene: SULT2B1 |
Gene summary for SULT2B1 |
| Gene information | Species | Human | Gene symbol | SULT2B1 | Gene ID | 6820 |
| Gene name | sulfotransferase family 2B member 1 | |
| Gene Alias | ARCI14 | |
| Cytomap | 19q13.33 | |
| Gene Type | protein-coding | GO ID | GO:0006066 | UniProtAcc | O00204 |
Top |
Malignant transformation analysis |
| Identification of the aberrant gene expression in precancerous and cancerous lesions by comparing the gene expression of stem-like cells in diseased tissues with normal stem cells |
| Entrez ID | Symbol | Replicates | Species | Organ | Tissue | Adj P-value | Log2FC | Malignancy |
| 6820 | SULT2B1 | LZE5T | Human | Esophagus | ESCC | 1.40e-06 | 5.04e-01 | 0.0514 |
| 6820 | SULT2B1 | P4T-E | Human | Esophagus | ESCC | 3.78e-04 | 1.52e-01 | 0.1323 |
| 6820 | SULT2B1 | P8T-E | Human | Esophagus | ESCC | 6.36e-70 | 1.63e+00 | 0.0889 |
| 6820 | SULT2B1 | P12T-E | Human | Esophagus | ESCC | 3.50e-02 | 1.02e-01 | 0.1122 |
| 6820 | SULT2B1 | P26T-E | Human | Esophagus | ESCC | 1.78e-03 | 1.48e-01 | 0.1276 |
| 6820 | SULT2B1 | P27T-E | Human | Esophagus | ESCC | 4.17e-05 | 8.49e-02 | 0.1055 |
| 6820 | SULT2B1 | P28T-E | Human | Esophagus | ESCC | 1.30e-15 | 4.48e-01 | 0.1149 |
| 6820 | SULT2B1 | P47T-E | Human | Esophagus | ESCC | 2.81e-02 | 2.35e-01 | 0.1067 |
| 6820 | SULT2B1 | P48T-E | Human | Esophagus | ESCC | 3.50e-02 | 1.05e-01 | 0.0959 |
| 6820 | SULT2B1 | P49T-E | Human | Esophagus | ESCC | 7.48e-03 | 3.94e-01 | 0.1768 |
| 6820 | SULT2B1 | P54T-E | Human | Esophagus | ESCC | 2.75e-03 | 1.93e-01 | 0.0975 |
| 6820 | SULT2B1 | P65T-E | Human | Esophagus | ESCC | 1.47e-05 | 1.83e-01 | 0.0978 |
| 6820 | SULT2B1 | P74T-E | Human | Esophagus | ESCC | 2.66e-02 | 1.18e-01 | 0.1479 |
| 6820 | SULT2B1 | P75T-E | Human | Esophagus | ESCC | 9.78e-30 | 7.15e-01 | 0.1125 |
| 6820 | SULT2B1 | P82T-E | Human | Esophagus | ESCC | 1.13e-10 | 4.90e-01 | 0.1072 |
| 6820 | SULT2B1 | P89T-E | Human | Esophagus | ESCC | 4.36e-04 | 2.87e-01 | 0.1752 |
| 6820 | SULT2B1 | P127T-E | Human | Esophagus | ESCC | 3.49e-03 | 1.01e-01 | 0.0826 |
| 6820 | SULT2B1 | C43 | Human | Oral cavity | OSCC | 4.19e-30 | 8.30e-01 | 0.1704 |
| 6820 | SULT2B1 | C57 | Human | Oral cavity | OSCC | 2.07e-42 | 1.98e+00 | 0.1679 |
| 6820 | SULT2B1 | SYSMH3 | Human | Oral cavity | OSCC | 1.23e-08 | 2.27e-01 | 0.2442 |
| Page: 1 2 |
| Tissue | Expression Dynamics | Abbreviation |
| Esophagus |  | ESCC: Esophageal squamous cell carcinoma |
| HGIN: High-grade intraepithelial neoplasias | ||
| LGIN: Low-grade intraepithelial neoplasias | ||
| Oral Cavity | 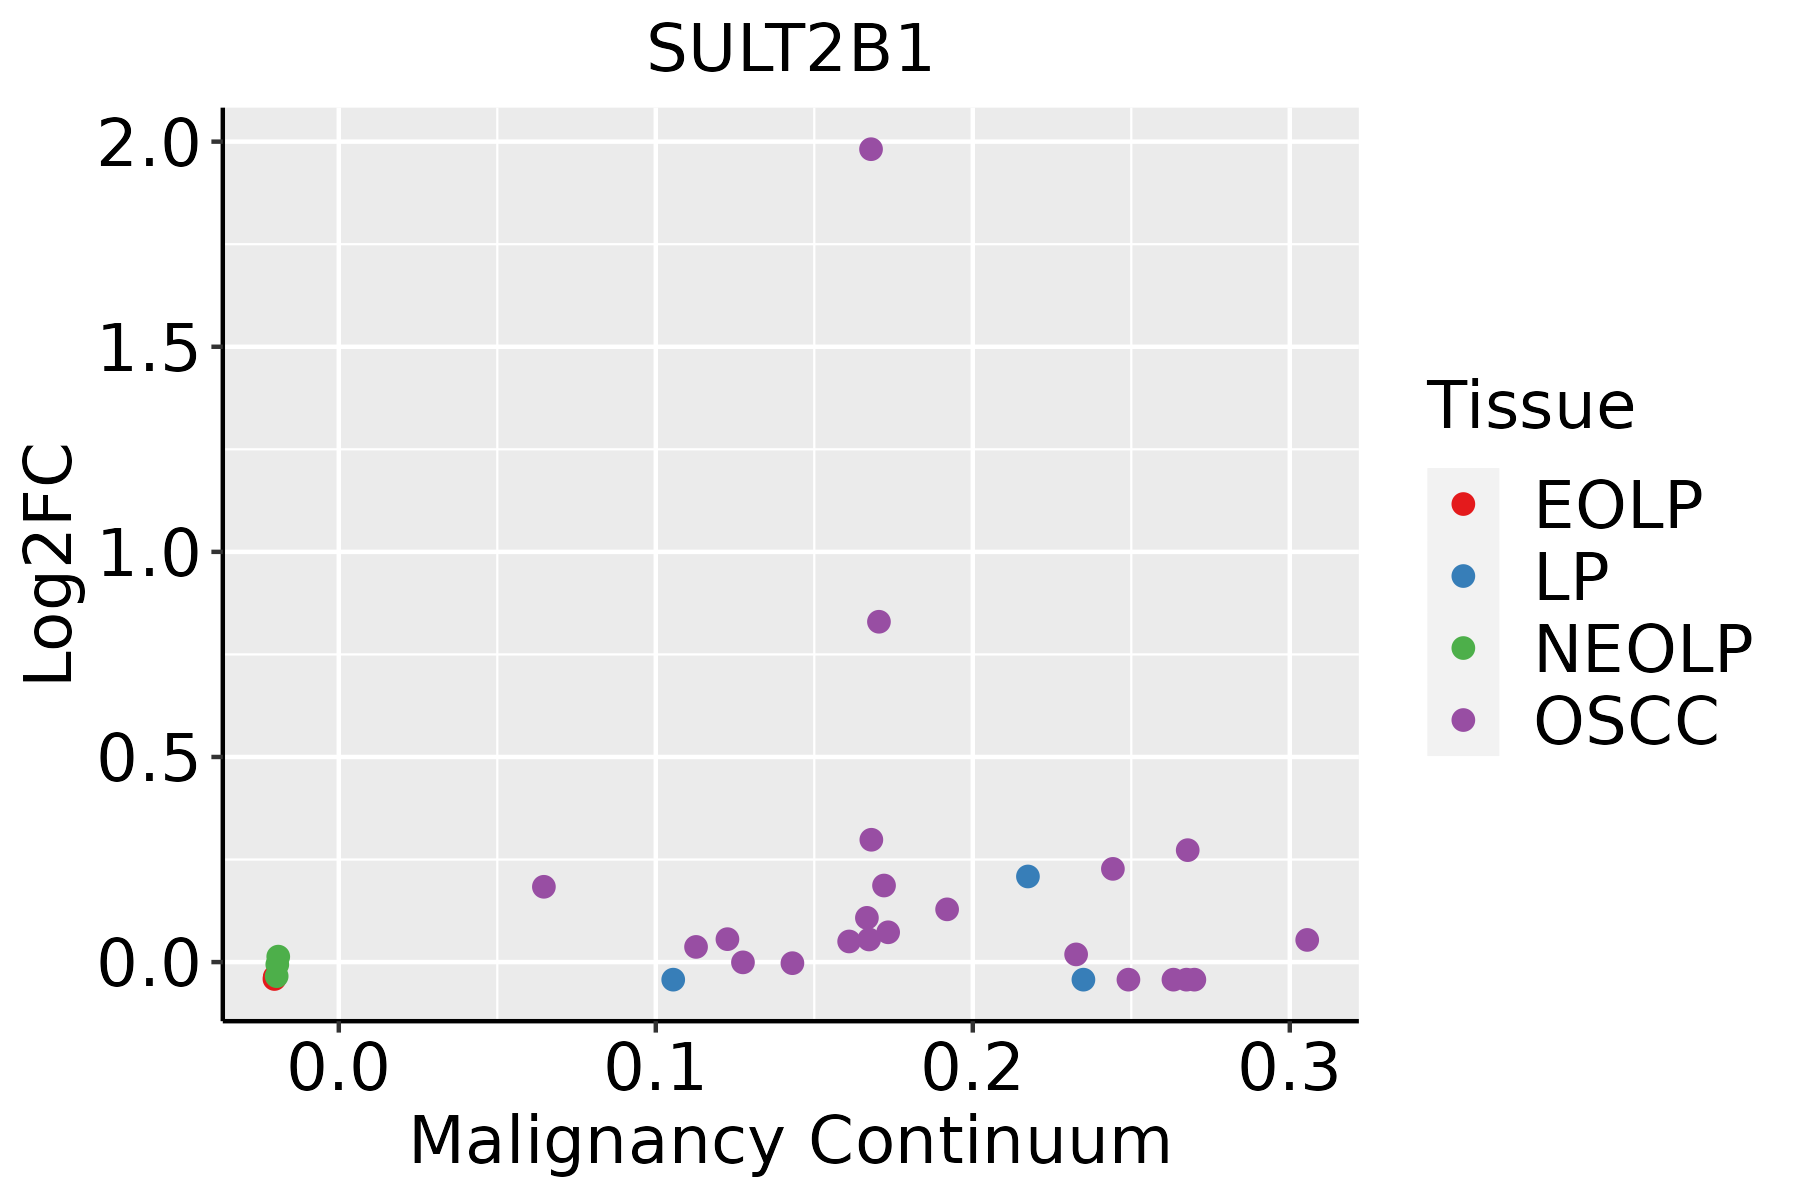 | EOLP: Erosive Oral lichen planus |
| LP: leukoplakia | ||
| NEOLP: Non-erosive oral lichen planus | ||
| OSCC: Oral squamous cell carcinoma |
| ∗log2FC in expression of this searched gene in stem-like cells from each diseased tissue sample relative to stem-like cells in normal samples in each tissue plotted against the malignancy continuum. Samples are colored based on if they are from different disease stage. |
Top |
Malignant transformation related pathway analysis |
| Find out the enriched GO biological processes and KEGG pathways involved in transition from healthy to precancer to cancer |
| Tissue | Disease Stage | Enriched GO biological Processes |
| Colorectum | AD |  |
| Colorectum | SER |  |
| Colorectum | MSS |  |
| Colorectum | MSI-H |  |
| Colorectum | FAP |  |
| ∗Top 15 enriched GO BP terms are showed in the bar plot of each disease state in each tissue. Each row represents a significant GO biological process which is colored according to the -log10(p.adjust). |
| Page: 1 2 3 4 5 6 7 8 9 |
| GO ID | Tissue | Disease Stage | Description | Gene Ratio | Bg Ratio | pvalue | p.adjust | Count |
| GO:0006753110 | Esophagus | ESCC | nucleoside phosphate metabolic process | 288/8552 | 497/18723 | 1.80e-08 | 3.50e-07 | 288 |
| GO:0019693111 | Esophagus | ESCC | ribose phosphate metabolic process | 234/8552 | 396/18723 | 4.24e-08 | 7.76e-07 | 234 |
| GO:0009117111 | Esophagus | ESCC | nucleotide metabolic process | 282/8552 | 489/18723 | 4.70e-08 | 8.50e-07 | 282 |
| GO:00067906 | Esophagus | ESCC | sulfur compound metabolic process | 201/8552 | 339/18723 | 2.64e-07 | 3.94e-06 | 201 |
| GO:000854410 | Esophagus | ESCC | epidermis development | 193/8552 | 324/18723 | 2.87e-07 | 4.19e-06 | 193 |
| GO:0009259111 | Esophagus | ESCC | ribonucleotide metabolic process | 224/8552 | 385/18723 | 4.41e-07 | 6.00e-06 | 224 |
| GO:0072521111 | Esophagus | ESCC | purine-containing compound metabolic process | 238/8552 | 416/18723 | 1.20e-06 | 1.49e-05 | 238 |
| GO:0009150111 | Esophagus | ESCC | purine ribonucleotide metabolic process | 213/8552 | 368/18723 | 1.40e-06 | 1.69e-05 | 213 |
| GO:0006163111 | Esophagus | ESCC | purine nucleotide metabolic process | 226/8552 | 396/18723 | 2.81e-06 | 3.21e-05 | 226 |
| GO:00060668 | Esophagus | ESCC | alcohol metabolic process | 202/8552 | 353/18723 | 7.32e-06 | 7.26e-05 | 202 |
| GO:000991310 | Esophagus | ESCC | epidermal cell differentiation | 122/8552 | 202/18723 | 1.69e-05 | 1.51e-04 | 122 |
| GO:00456826 | Esophagus | ESCC | regulation of epidermis development | 46/8552 | 65/18723 | 3.65e-05 | 2.97e-04 | 46 |
| GO:00456046 | Esophagus | ESCC | regulation of epidermal cell differentiation | 41/8552 | 58/18723 | 1.00e-04 | 7.10e-04 | 41 |
| GO:19026524 | Esophagus | ESCC | secondary alcohol metabolic process | 87/8552 | 147/18723 | 6.58e-04 | 3.50e-03 | 87 |
| GO:00338655 | Esophagus | ESCC | nucleoside bisphosphate metabolic process | 77/8552 | 128/18723 | 6.71e-04 | 3.55e-03 | 77 |
| GO:00338755 | Esophagus | ESCC | ribonucleoside bisphosphate metabolic process | 77/8552 | 128/18723 | 6.71e-04 | 3.55e-03 | 77 |
| GO:00340325 | Esophagus | ESCC | purine nucleoside bisphosphate metabolic process | 77/8552 | 128/18723 | 6.71e-04 | 3.55e-03 | 77 |
| GO:00456841 | Esophagus | ESCC | positive regulation of epidermis development | 23/8552 | 32/18723 | 2.43e-03 | 1.06e-02 | 23 |
| GO:00456061 | Esophagus | ESCC | positive regulation of epidermal cell differentiation | 20/8552 | 27/18723 | 2.61e-03 | 1.11e-02 | 20 |
| GO:00082034 | Esophagus | ESCC | cholesterol metabolic process | 79/8552 | 137/18723 | 3.11e-03 | 1.29e-02 | 79 |
| Page: 1 2 3 |
| Pathway ID | Tissue | Disease Stage | Description | Gene Ratio | Bg Ratio | pvalue | p.adjust | qvalue | Count |
| Page: 1 |
Top |
Cell-cell communication analysis |
| Identification of potential cell-cell interactions between two cell types and their ligand-receptor pairs for different disease states |
| Ligand | Receptor | LRpair | Pathway | Tissue | Disease Stage |
| Page: 1 |
Top |
Single-cell gene regulatory network inference analysis |
| Find out the significant the regulons (TFs) and the target genes of each regulon across cell types for different disease states |
| TF | Cell Type | Tissue | Disease Stage | Target Gene | RSS | Regulon Activity |
| ∗The dot plots of a searched regulon are shown for all cell subpopulations in each disease state of each tissue based on the regulon specific score inferred using pySCENIC and by calculating the average expression. |
| Page: 1 |
Top |
Somatic mutation of malignant transformation related genes |
| Annotation of somatic variants for genes involved in malignant transformation |
| Hugo Symbol | Variant Class | Variant Classification | dbSNP RS | HGVSc | HGVSp | HGVSp Short | SWISSPROT | BIOTYPE | SIFT | PolyPhen | Tumor Sample Barcode | Tissue | Histology | Sex | Age | Stage | Therapy Types | Drugs | Outcome |
| SULT2B1 | SNV | Missense_Mutation | c.806G>A | p.Arg269His | p.R269H | O00204 | protein_coding | tolerated(0.47) | benign(0.005) | TCGA-D8-A27L-01 | Breast | breast invasive carcinoma | Female | <65 | III/IV | Chemotherapy | adriamycin+cuclophosphamide | SD | |
| SULT2B1 | SNV | Missense_Mutation | novel | c.1021C>T | p.Arg341Cys | p.R341C | O00204 | protein_coding | deleterious_low_confidence(0.02) | benign(0) | TCGA-OL-A5S0-01 | Breast | breast invasive carcinoma | Female | >=65 | I/II | Chemotherapy | taxol | CR |
| SULT2B1 | insertion | In_Frame_Ins | novel | c.463_464insGGGATTACAGGCGCCTACCACCATGCCCAG | p.Ser155delinsTrpAspTyrArgArgLeuProProCysProAla | p.S155delinsWDYRRLPPCPA | O00204 | protein_coding | TCGA-A8-A0A1-01 | Breast | breast invasive carcinoma | Female | >=65 | I/II | Hormone Therapy | tamoxiphen | SD | ||
| SULT2B1 | SNV | Missense_Mutation | c.747N>A | p.Met249Ile | p.M249I | O00204 | protein_coding | deleterious(0) | probably_damaging(0.995) | TCGA-DR-A0ZM-01 | Cervix | cervical & endocervical cancer | Female | <65 | III/IV | Unspecific | Cisplatin | SD | |
| SULT2B1 | SNV | Missense_Mutation | c.315N>C | p.Glu105Asp | p.E105D | O00204 | protein_coding | deleterious(0.02) | probably_damaging(0.933) | TCGA-EK-A2PG-01 | Cervix | cervical & endocervical cancer | Female | >=65 | I/II | Unknown | Unknown | SD | |
| SULT2B1 | SNV | Missense_Mutation | c.883C>T | p.Arg295Cys | p.R295C | O00204 | protein_coding | deleterious(0.03) | probably_damaging(0.948) | TCGA-LP-A5U3-01 | Cervix | cervical & endocervical cancer | Female | <65 | I/II | Unknown | Unknown | SD | |
| SULT2B1 | SNV | Missense_Mutation | c.893N>A | p.Arg298His | p.R298H | O00204 | protein_coding | deleterious(0.05) | probably_damaging(0.929) | TCGA-AA-3710-01 | Colorectum | colon adenocarcinoma | Female | >=65 | I/II | Unknown | Unknown | SD | |
| SULT2B1 | SNV | Missense_Mutation | c.380C>T | p.Pro127Leu | p.P127L | O00204 | protein_coding | deleterious(0) | probably_damaging(1) | TCGA-AA-3811-01 | Colorectum | colon adenocarcinoma | Female | >=65 | III/IV | Unknown | Unknown | PD | |
| SULT2B1 | SNV | Missense_Mutation | c.265C>A | p.Pro89Thr | p.P89T | O00204 | protein_coding | tolerated(0.08) | probably_damaging(0.91) | TCGA-AD-5900-01 | Colorectum | colon adenocarcinoma | Male | >=65 | I/II | Unknown | Unknown | SD | |
| SULT2B1 | SNV | Missense_Mutation | novel | c.1051N>A | p.Pro351Thr | p.P351T | O00204 | protein_coding | deleterious_low_confidence(0) | benign(0.08) | TCGA-AZ-6598-01 | Colorectum | colon adenocarcinoma | Female | >=65 | I/II | Unknown | Unknown | SD |
| Page: 1 2 3 |
Top |
Related drugs of malignant transformation related genes |
| Identification of chemicals and drugs interact with genes involved in malignant transfromation |
| (DGIdb 4.0) |
| Entrez ID | Symbol | Category | Interaction Types | Drug Claim Name | Drug Name | PMIDs |
| 6820 | SULT2B1 | ENZYME, DRUGGABLE GENOME | cytarabine | CYTARABINE | 22584460 | |
| 6820 | SULT2B1 | ENZYME, DRUGGABLE GENOME | idarubicin | IDARUBICIN | 22584460 | |
| 6820 | SULT2B1 | ENZYME, DRUGGABLE GENOME | gemtuzumab ozogamicin | 22584460 | ||
| 6820 | SULT2B1 | ENZYME, DRUGGABLE GENOME | anthracyclines and related substances | 23441093,21900104 | ||
| 6820 | SULT2B1 | ENZYME, DRUGGABLE GENOME | fludarabine | FLUDARABINE | 22584460 |
| Page: 1 |

Copyright 2023-Present -The University of Texas Health Science Center at Houston |