
|
|||||
|
 | |
| |
| |
| |
| |
| |
|
Gene: SULT2A1 |
Gene summary for SULT2A1 |
| Gene information | Species | Human | Gene symbol | SULT2A1 | Gene ID | 6822 |
| Gene name | sulfotransferase family 2A member 1 | |
| Gene Alias | DHEA-ST | |
| Cytomap | 19q13.33 | |
| Gene Type | protein-coding | GO ID | GO:0006066 | UniProtAcc | A8K015 |
Top |
Malignant transformation analysis |
| Identification of the aberrant gene expression in precancerous and cancerous lesions by comparing the gene expression of stem-like cells in diseased tissues with normal stem cells |
| Entrez ID | Symbol | Replicates | Species | Organ | Tissue | Adj P-value | Log2FC | Malignancy |
| 6822 | SULT2A1 | NAFLD1 | Human | Liver | NAFLD | 4.32e-03 | 8.56e-01 | -0.04 |
| 6822 | SULT2A1 | S43 | Human | Liver | Cirrhotic | 3.39e-04 | 7.37e-02 | -0.0187 |
| 6822 | SULT2A1 | HCC1_Meng | Human | Liver | HCC | 1.91e-10 | -1.62e-01 | 0.0246 |
| 6822 | SULT2A1 | HCC2_Meng | Human | Liver | HCC | 2.30e-06 | -2.17e-01 | 0.0107 |
| 6822 | SULT2A1 | cirrhotic1 | Human | Liver | Cirrhotic | 8.29e-05 | -1.94e-01 | 0.0202 |
| 6822 | SULT2A1 | HCC1 | Human | Liver | HCC | 1.42e-37 | 5.95e+00 | 0.5336 |
| 6822 | SULT2A1 | HCC2 | Human | Liver | HCC | 5.76e-40 | 5.50e+00 | 0.5341 |
| 6822 | SULT2A1 | HCC5 | Human | Liver | HCC | 1.16e-03 | 3.27e+00 | 0.4932 |
| 6822 | SULT2A1 | Pt13.b | Human | Liver | HCC | 2.58e-12 | 7.32e-02 | 0.0251 |
| 6822 | SULT2A1 | S016 | Human | Liver | HCC | 2.17e-03 | -2.17e-01 | 0.2243 |
| Page: 1 |
| Tissue | Expression Dynamics | Abbreviation |
| Liver | 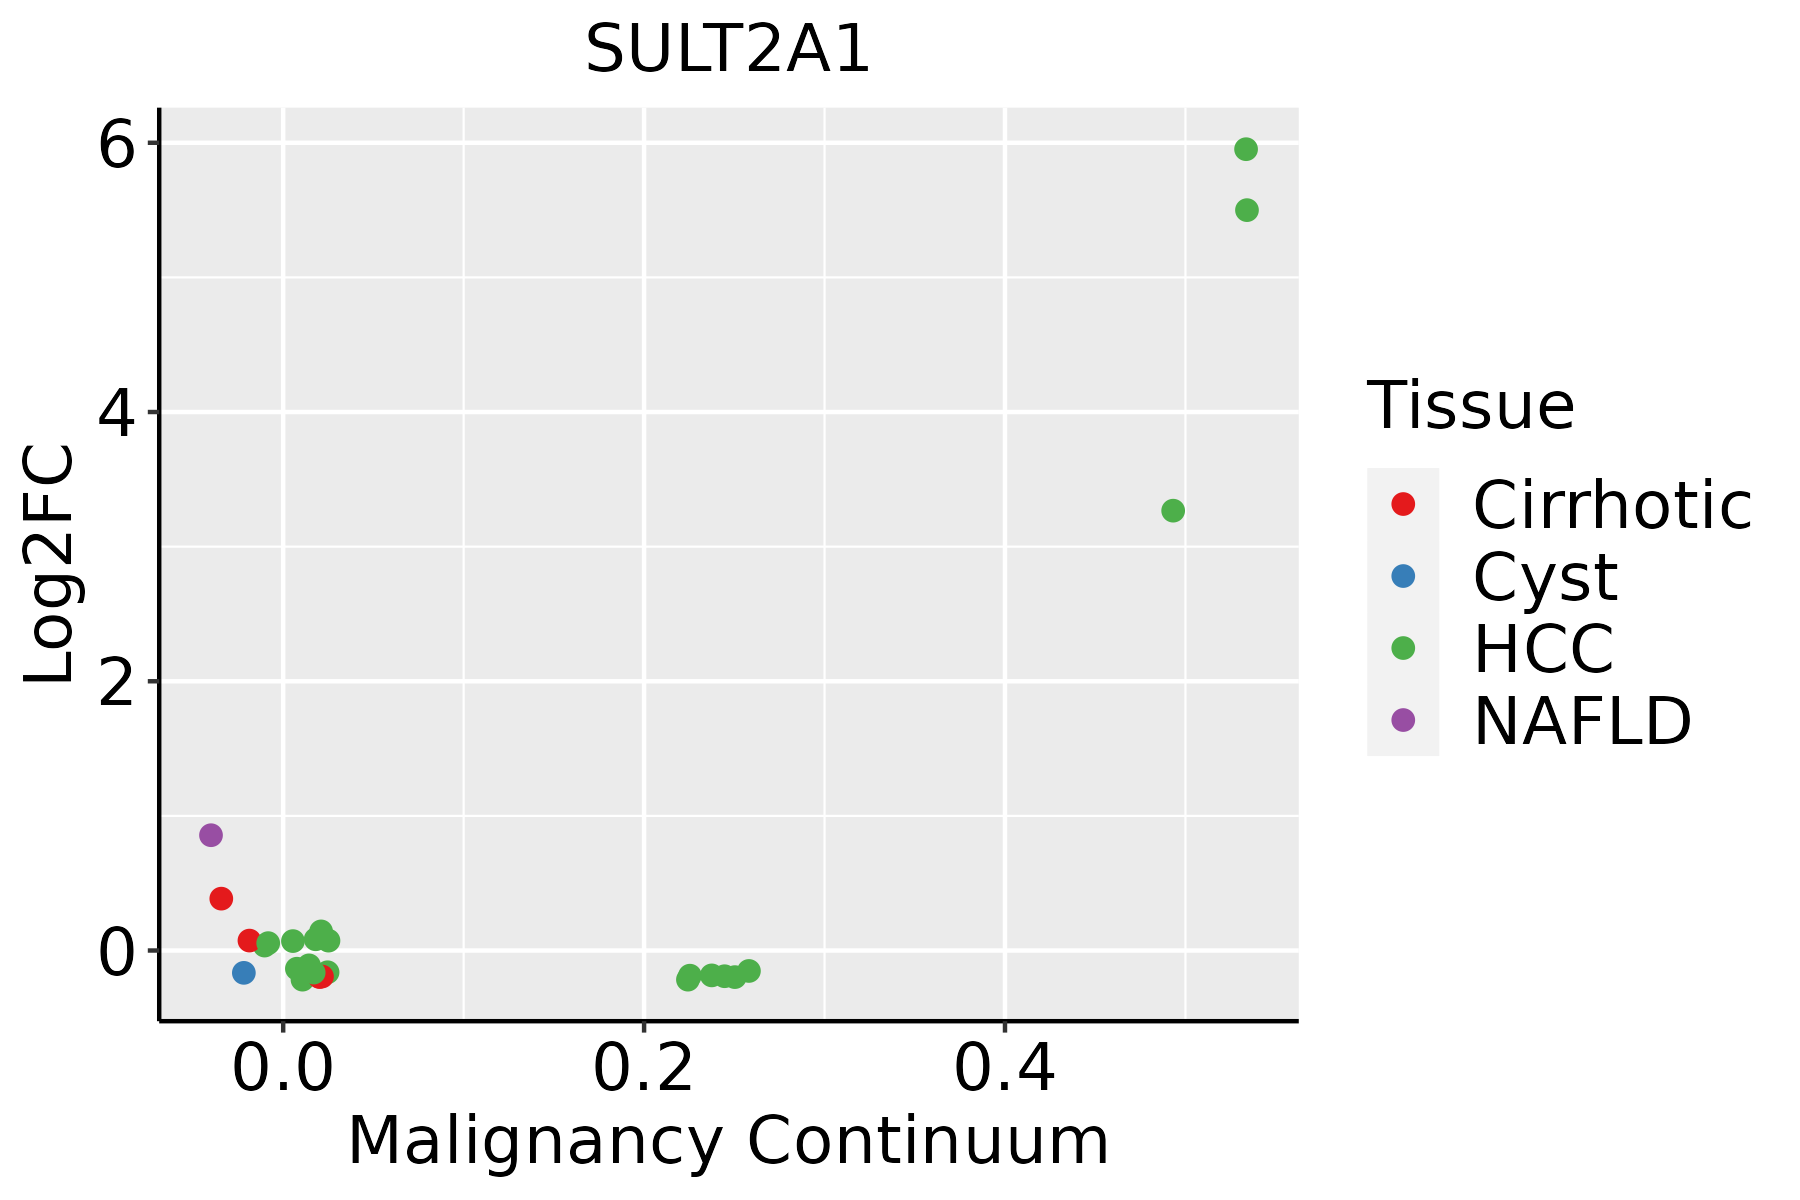 | HCC: Hepatocellular carcinoma |
| NAFLD: Non-alcoholic fatty liver disease |
| ∗log2FC in expression of this searched gene in stem-like cells from each diseased tissue sample relative to stem-like cells in normal samples in each tissue plotted against the malignancy continuum. Samples are colored based on if they are from different disease stage. |
Top |
Malignant transformation related pathway analysis |
| Find out the enriched GO biological processes and KEGG pathways involved in transition from healthy to precancer to cancer |
| Tissue | Disease Stage | Enriched GO biological Processes |
| Colorectum | AD |  |
| Colorectum | SER |  |
| Colorectum | MSS |  |
| Colorectum | MSI-H |  |
| Colorectum | FAP |  |
| ∗Top 15 enriched GO BP terms are showed in the bar plot of each disease state in each tissue. Each row represents a significant GO biological process which is colored according to the -log10(p.adjust). |
| Page: 1 2 3 4 5 6 7 8 9 |
| GO ID | Tissue | Disease Stage | Description | Gene Ratio | Bg Ratio | pvalue | p.adjust | Count |
| GO:00463953 | Liver | NAFLD | carboxylic acid catabolic process | 73/1882 | 236/18723 | 4.16e-19 | 1.22e-15 | 73 |
| GO:00160544 | Liver | NAFLD | organic acid catabolic process | 73/1882 | 240/18723 | 1.20e-18 | 2.34e-15 | 73 |
| GO:00442825 | Liver | NAFLD | small molecule catabolic process | 91/1882 | 376/18723 | 8.96e-16 | 1.31e-12 | 91 |
| GO:00723295 | Liver | NAFLD | monocarboxylic acid catabolic process | 39/1882 | 122/18723 | 2.40e-11 | 8.77e-09 | 39 |
| GO:00082023 | Liver | NAFLD | steroid metabolic process | 69/1882 | 319/18723 | 5.90e-10 | 1.28e-07 | 69 |
| GO:00094107 | Liver | NAFLD | response to xenobiotic stimulus | 88/1882 | 462/18723 | 2.53e-09 | 4.11e-07 | 88 |
| GO:0008206 | Liver | NAFLD | bile acid metabolic process | 19/1882 | 49/18723 | 9.82e-08 | 7.76e-06 | 19 |
| GO:00160426 | Liver | NAFLD | lipid catabolic process | 63/1882 | 320/18723 | 1.35e-07 | 1.02e-05 | 63 |
| GO:00092596 | Liver | NAFLD | ribonucleotide metabolic process | 72/1882 | 385/18723 | 1.51e-07 | 1.09e-05 | 72 |
| GO:00196936 | Liver | NAFLD | ribose phosphate metabolic process | 73/1882 | 396/18723 | 2.23e-07 | 1.53e-05 | 73 |
| GO:00091177 | Liver | NAFLD | nucleotide metabolic process | 85/1882 | 489/18723 | 3.31e-07 | 2.18e-05 | 85 |
| GO:00067537 | Liver | NAFLD | nucleoside phosphate metabolic process | 85/1882 | 497/18723 | 6.69e-07 | 3.83e-05 | 85 |
| GO:00725217 | Liver | NAFLD | purine-containing compound metabolic process | 74/1882 | 416/18723 | 7.73e-07 | 4.27e-05 | 74 |
| GO:00091507 | Liver | NAFLD | purine ribonucleotide metabolic process | 67/1882 | 368/18723 | 1.10e-06 | 5.44e-05 | 67 |
| GO:00061637 | Liver | NAFLD | purine nucleotide metabolic process | 70/1882 | 396/18723 | 1.93e-06 | 8.23e-05 | 70 |
| GO:0008203 | Liver | NAFLD | cholesterol metabolic process | 32/1882 | 137/18723 | 4.28e-06 | 1.66e-04 | 32 |
| GO:0016125 | Liver | NAFLD | sterol metabolic process | 34/1882 | 152/18723 | 6.02e-06 | 2.11e-04 | 34 |
| GO:1902652 | Liver | NAFLD | secondary alcohol metabolic process | 33/1882 | 147/18723 | 7.57e-06 | 2.56e-04 | 33 |
| GO:00060666 | Liver | NAFLD | alcohol metabolic process | 62/1882 | 353/18723 | 9.01e-06 | 2.96e-04 | 62 |
| GO:00067904 | Liver | NAFLD | sulfur compound metabolic process | 58/1882 | 339/18723 | 3.79e-05 | 9.38e-04 | 58 |
| Page: 1 2 3 4 5 |
| Pathway ID | Tissue | Disease Stage | Description | Gene Ratio | Bg Ratio | pvalue | p.adjust | qvalue | Count |
| hsa049762 | Liver | NAFLD | Bile secretion | 20/1043 | 89/8465 | 5.08e-03 | 4.43e-02 | 3.57e-02 | 20 |
| hsa0497611 | Liver | NAFLD | Bile secretion | 20/1043 | 89/8465 | 5.08e-03 | 4.43e-02 | 3.57e-02 | 20 |
| Page: 1 |
Top |
Cell-cell communication analysis |
| Identification of potential cell-cell interactions between two cell types and their ligand-receptor pairs for different disease states |
| Ligand | Receptor | LRpair | Pathway | Tissue | Disease Stage |
| Page: 1 |
Top |
Single-cell gene regulatory network inference analysis |
| Find out the significant the regulons (TFs) and the target genes of each regulon across cell types for different disease states |
| TF | Cell Type | Tissue | Disease Stage | Target Gene | RSS | Regulon Activity |
| ∗The dot plots of a searched regulon are shown for all cell subpopulations in each disease state of each tissue based on the regulon specific score inferred using pySCENIC and by calculating the average expression. |
| Page: 1 |
Top |
Somatic mutation of malignant transformation related genes |
| Annotation of somatic variants for genes involved in malignant transformation |
| Hugo Symbol | Variant Class | Variant Classification | dbSNP RS | HGVSc | HGVSp | HGVSp Short | SWISSPROT | BIOTYPE | SIFT | PolyPhen | Tumor Sample Barcode | Tissue | Histology | Sex | Age | Stage | Therapy Types | Drugs | Outcome |
| SULT2A1 | SNV | Missense_Mutation | rs368067020 | c.442N>A | p.Glu148Lys | p.E148K | Q06520 | protein_coding | tolerated(0.07) | benign(0.084) | TCGA-GM-A2DO-01 | Breast | breast invasive carcinoma | Female | <65 | I/II | Hormone Therapy | tamoxiphen | CR |
| SULT2A1 | insertion | Nonsense_Mutation | novel | c.355_356insATTAGAGAGAGCCACCAATGCCTCTAATTCAGTACA | p.Leu119delinsHisTerArgGluProProMetProLeuIleGlnTyrIle | p.L119delinsH*REPPMPLIQYI | Q06520 | protein_coding | TCGA-BH-A0HF-01 | Breast | breast invasive carcinoma | Female | >=65 | I/II | Hormone Therapy | arimidex | SD | ||
| SULT2A1 | SNV | Missense_Mutation | c.762N>T | p.Trp254Cys | p.W254C | Q06520 | protein_coding | deleterious(0) | probably_damaging(1) | TCGA-A6-5661-01 | Colorectum | colon adenocarcinoma | Female | >=65 | I/II | Unknown | Unknown | SD | |
| SULT2A1 | SNV | Missense_Mutation | c.323C>A | p.Ser108Tyr | p.S108Y | Q06520 | protein_coding | deleterious(0) | probably_damaging(0.996) | TCGA-AA-3984-01 | Colorectum | colon adenocarcinoma | Female | <65 | I/II | Unknown | Unknown | SD | |
| SULT2A1 | SNV | Missense_Mutation | novel | c.413A>C | p.Lys138Thr | p.K138T | Q06520 | protein_coding | tolerated(0.34) | benign(0.019) | TCGA-CA-6717-01 | Colorectum | colon adenocarcinoma | Male | <65 | I/II | Chemotherapy | oxaliplatin | CR |
| SULT2A1 | SNV | Missense_Mutation | novel | c.423N>T | p.Lys141Asn | p.K141N | Q06520 | protein_coding | deleterious(0) | probably_damaging(0.943) | TCGA-AG-A002-01 | Colorectum | rectum adenocarcinoma | Male | <65 | I/II | Unknown | Unknown | SD |
| SULT2A1 | SNV | Missense_Mutation | novel | c.830T>G | p.Leu277Arg | p.L277R | Q06520 | protein_coding | deleterious(0) | probably_damaging(0.968) | TCGA-A5-A0G2-01 | Endometrium | uterine corpus endometrioid carcinoma | Female | <65 | III/IV | Unknown | Unknown | SD |
| SULT2A1 | SNV | Missense_Mutation | rs567166520 | c.269N>T | p.Thr90Met | p.T90M | Q06520 | protein_coding | tolerated(0.23) | benign(0) | TCGA-AP-A059-01 | Endometrium | uterine corpus endometrioid carcinoma | Female | >=65 | I/II | Unknown | Unknown | SD |
| SULT2A1 | SNV | Missense_Mutation | novel | c.5C>T | p.Ser2Leu | p.S2L | Q06520 | protein_coding | deleterious(0.03) | benign(0.14) | TCGA-AP-A0LM-01 | Endometrium | uterine corpus endometrioid carcinoma | Female | <65 | III/IV | Chemotherapy | cisplatin | SD |
| SULT2A1 | SNV | Missense_Mutation | rs567166520 | c.269N>T | p.Thr90Met | p.T90M | Q06520 | protein_coding | tolerated(0.23) | benign(0) | TCGA-B5-A0K3-01 | Endometrium | uterine corpus endometrioid carcinoma | Female | <65 | I/II | Chemotherapy | carboplatin | PD |
| Page: 1 2 3 4 |
Top |
Related drugs of malignant transformation related genes |
| Identification of chemicals and drugs interact with genes involved in malignant transfromation |
| (DGIdb 4.0) |
| Entrez ID | Symbol | Category | Interaction Types | Drug Claim Name | Drug Name | PMIDs |
| 6822 | SULT2A1 | DRUGGABLE GENOME | EMATE | EMATE | ||
| 6822 | SULT2A1 | DRUGGABLE GENOME | METHOTREXATE | METHOTREXATE | 17163485 | |
| 6822 | SULT2A1 | DRUGGABLE GENOME | acetaminophen | ACETAMINOPHEN | 26049587 | |
| 6822 | SULT2A1 | DRUGGABLE GENOME | TGF | 3164434 | ||
| 6822 | SULT2A1 | DRUGGABLE GENOME | OXANDROLONE | OXANDROLONE | 8319371 |
| Page: 1 |

Copyright 2023-Present -The University of Texas Health Science Center at Houston |