
|
|||||
|
 | |
| |
| |
| |
| |
| |
|
Gene: SULT1C4 |
Gene summary for SULT1C4 |
| Gene information | Species | Human | Gene symbol | SULT1C4 | Gene ID | 27233 |
| Gene name | sulfotransferase family 1C member 4 | |
| Gene Alias | SULT1C | |
| Cytomap | 2q12.3 | |
| Gene Type | protein-coding | GO ID | GO:0006066 | UniProtAcc | O75897 |
Top |
Malignant transformation analysis |
| Identification of the aberrant gene expression in precancerous and cancerous lesions by comparing the gene expression of stem-like cells in diseased tissues with normal stem cells |
| Entrez ID | Symbol | Replicates | Species | Organ | Tissue | Adj P-value | Log2FC | Malignancy |
| 27233 | SULT1C4 | P10T-E | Human | Esophagus | ESCC | 5.94e-62 | 1.22e+00 | 0.116 |
| 27233 | SULT1C4 | P12T-E | Human | Esophagus | ESCC | 4.41e-07 | 2.02e-01 | 0.1122 |
| 27233 | SULT1C4 | P16T-E | Human | Esophagus | ESCC | 3.97e-04 | 1.41e-01 | 0.1153 |
| 27233 | SULT1C4 | P61T-E | Human | Esophagus | ESCC | 1.59e-34 | 1.01e+00 | 0.099 |
| 27233 | SULT1C4 | P76T-E | Human | Esophagus | ESCC | 4.44e-08 | 1.87e-01 | 0.1207 |
| 27233 | SULT1C4 | P130T-E | Human | Esophagus | ESCC | 3.97e-04 | 1.55e-01 | 0.1676 |
| 27233 | SULT1C4 | HCC1_Meng | Human | Liver | HCC | 2.97e-70 | 3.42e-01 | 0.0246 |
| 27233 | SULT1C4 | cirrhotic1 | Human | Liver | Cirrhotic | 4.89e-11 | 2.87e-01 | 0.0202 |
| 27233 | SULT1C4 | cirrhotic2 | Human | Liver | Cirrhotic | 5.61e-10 | 2.69e-01 | 0.0201 |
| 27233 | SULT1C4 | S016 | Human | Liver | HCC | 6.61e-03 | 2.37e-01 | 0.2243 |
| 27233 | SULT1C4 | S027 | Human | Liver | HCC | 1.56e-09 | 1.27e+00 | 0.2446 |
| 27233 | SULT1C4 | S028 | Human | Liver | HCC | 2.21e-38 | 1.50e+00 | 0.2503 |
| 27233 | SULT1C4 | S029 | Human | Liver | HCC | 2.30e-28 | 1.32e+00 | 0.2581 |
| Page: 1 |
| Tissue | Expression Dynamics | Abbreviation |
| Esophagus | 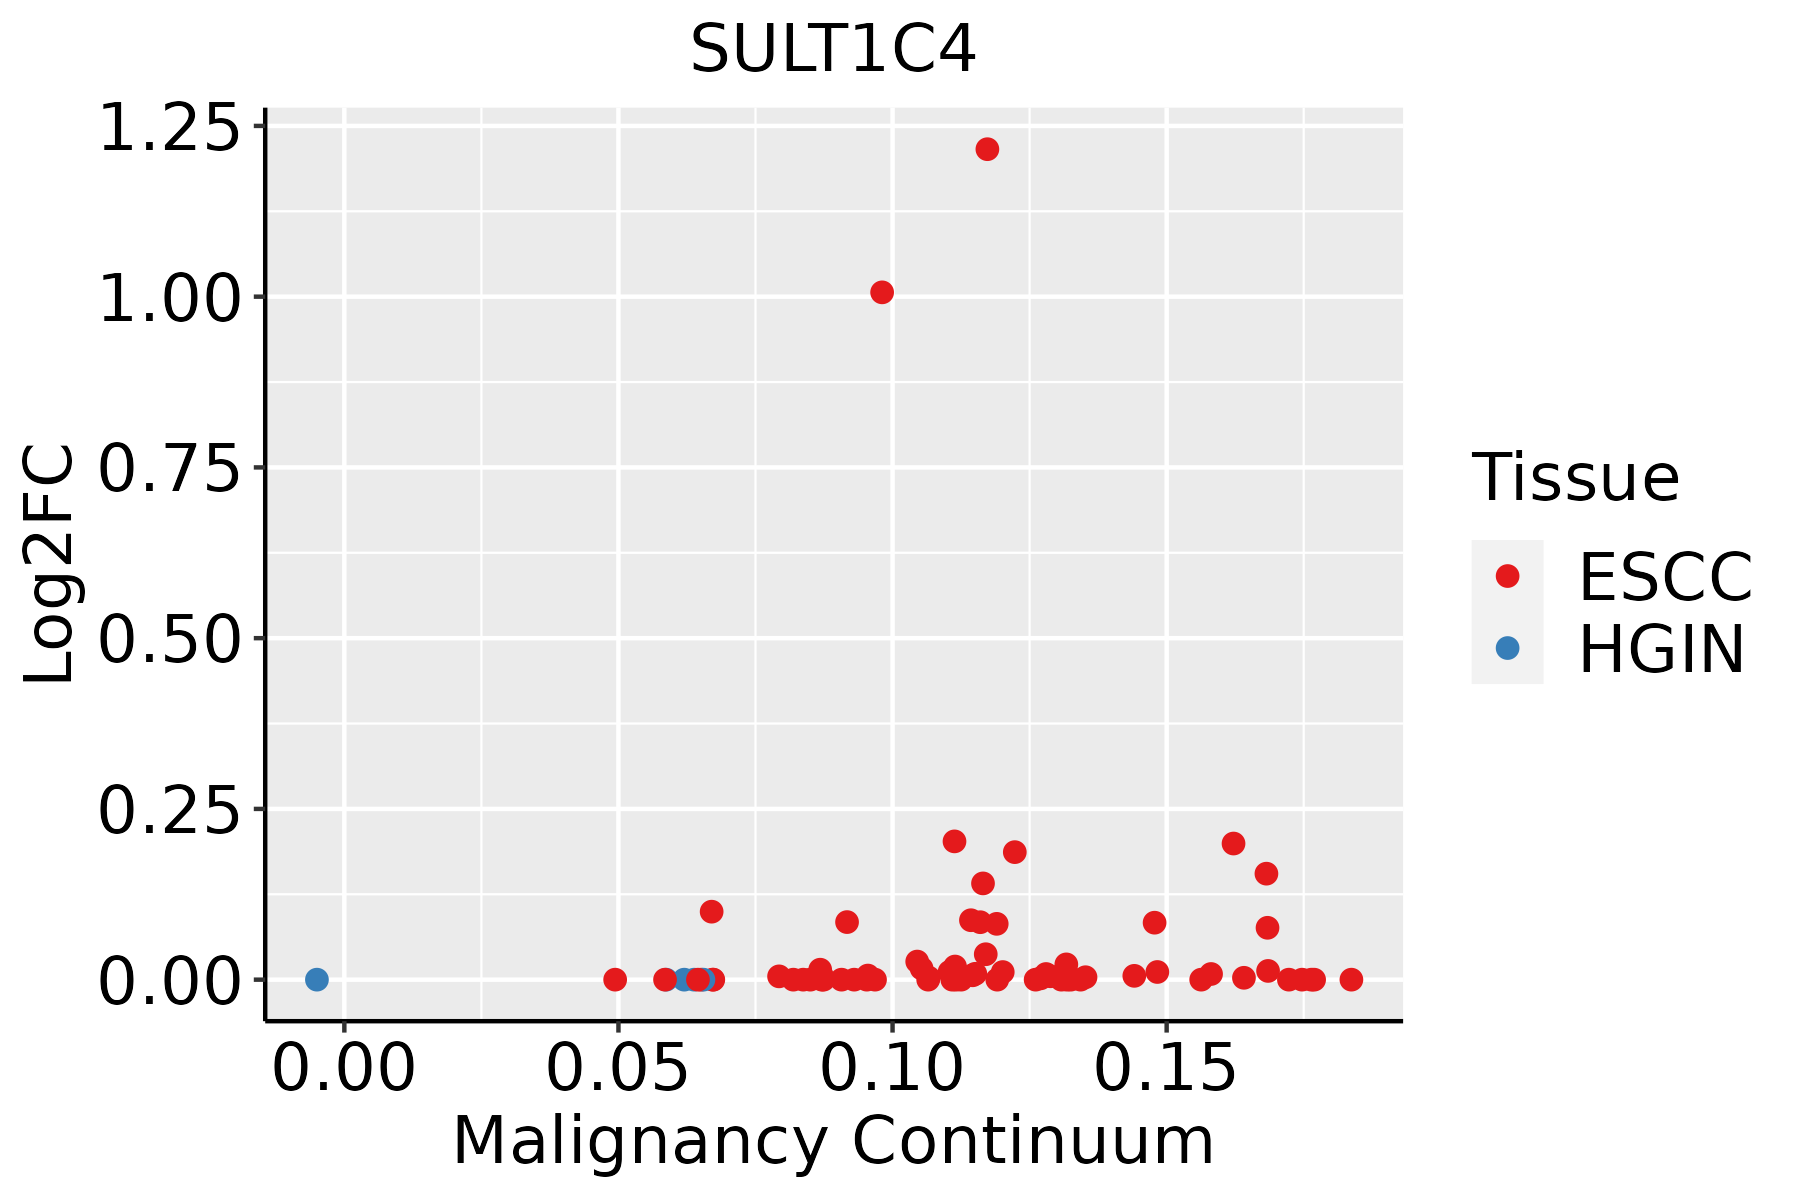 | ESCC: Esophageal squamous cell carcinoma |
| HGIN: High-grade intraepithelial neoplasias | ||
| LGIN: Low-grade intraepithelial neoplasias | ||
| Liver |  | HCC: Hepatocellular carcinoma |
| NAFLD: Non-alcoholic fatty liver disease |
| ∗log2FC in expression of this searched gene in stem-like cells from each diseased tissue sample relative to stem-like cells in normal samples in each tissue plotted against the malignancy continuum. Samples are colored based on if they are from different disease stage. |
Top |
Malignant transformation related pathway analysis |
| Find out the enriched GO biological processes and KEGG pathways involved in transition from healthy to precancer to cancer |
| Tissue | Disease Stage | Enriched GO biological Processes |
| Colorectum | AD |  |
| Colorectum | SER |  |
| Colorectum | MSS |  |
| Colorectum | MSI-H |  |
| Colorectum | FAP |  |
| ∗Top 15 enriched GO BP terms are showed in the bar plot of each disease state in each tissue. Each row represents a significant GO biological process which is colored according to the -log10(p.adjust). |
| Page: 1 2 3 4 5 6 7 8 9 |
| GO ID | Tissue | Disease Stage | Description | Gene Ratio | Bg Ratio | pvalue | p.adjust | Count |
| GO:0006753110 | Esophagus | ESCC | nucleoside phosphate metabolic process | 288/8552 | 497/18723 | 1.80e-08 | 3.50e-07 | 288 |
| GO:0019693111 | Esophagus | ESCC | ribose phosphate metabolic process | 234/8552 | 396/18723 | 4.24e-08 | 7.76e-07 | 234 |
| GO:0009117111 | Esophagus | ESCC | nucleotide metabolic process | 282/8552 | 489/18723 | 4.70e-08 | 8.50e-07 | 282 |
| GO:00067906 | Esophagus | ESCC | sulfur compound metabolic process | 201/8552 | 339/18723 | 2.64e-07 | 3.94e-06 | 201 |
| GO:190166112 | Esophagus | ESCC | quinone metabolic process | 34/8552 | 40/18723 | 3.00e-07 | 4.27e-06 | 34 |
| GO:0009259111 | Esophagus | ESCC | ribonucleotide metabolic process | 224/8552 | 385/18723 | 4.41e-07 | 6.00e-06 | 224 |
| GO:0072521111 | Esophagus | ESCC | purine-containing compound metabolic process | 238/8552 | 416/18723 | 1.20e-06 | 1.49e-05 | 238 |
| GO:0009150111 | Esophagus | ESCC | purine ribonucleotide metabolic process | 213/8552 | 368/18723 | 1.40e-06 | 1.69e-05 | 213 |
| GO:0006163111 | Esophagus | ESCC | purine nucleotide metabolic process | 226/8552 | 396/18723 | 2.81e-06 | 3.21e-05 | 226 |
| GO:00060668 | Esophagus | ESCC | alcohol metabolic process | 202/8552 | 353/18723 | 7.32e-06 | 7.26e-05 | 202 |
| GO:000941020 | Esophagus | ESCC | response to xenobiotic stimulus | 253/8552 | 462/18723 | 4.55e-05 | 3.58e-04 | 253 |
| GO:19016574 | Esophagus | ESCC | glycosyl compound metabolic process | 57/8552 | 88/18723 | 2.32e-04 | 1.44e-03 | 57 |
| GO:00421805 | Esophagus | ESCC | cellular ketone metabolic process | 120/8552 | 211/18723 | 6.70e-04 | 3.55e-03 | 120 |
| GO:00338655 | Esophagus | ESCC | nucleoside bisphosphate metabolic process | 77/8552 | 128/18723 | 6.71e-04 | 3.55e-03 | 77 |
| GO:00338755 | Esophagus | ESCC | ribonucleoside bisphosphate metabolic process | 77/8552 | 128/18723 | 6.71e-04 | 3.55e-03 | 77 |
| GO:00340325 | Esophagus | ESCC | purine nucleoside bisphosphate metabolic process | 77/8552 | 128/18723 | 6.71e-04 | 3.55e-03 | 77 |
| GO:00442827 | Esophagus | ESCC | small molecule catabolic process | 201/8552 | 376/18723 | 1.35e-03 | 6.41e-03 | 201 |
| GO:003063813 | Esophagus | ESCC | polyketide metabolic process | 9/8552 | 10/18723 | 5.09e-03 | 1.92e-02 | 9 |
| GO:004459813 | Esophagus | ESCC | doxorubicin metabolic process | 9/8552 | 10/18723 | 5.09e-03 | 1.92e-02 | 9 |
| GO:00161373 | Esophagus | ESCC | glycoside metabolic process | 16/8552 | 22/18723 | 9.46e-03 | 3.28e-02 | 16 |
| Page: 1 2 3 4 |
| Pathway ID | Tissue | Disease Stage | Description | Gene Ratio | Bg Ratio | pvalue | p.adjust | qvalue | Count |
| Page: 1 |
Top |
Cell-cell communication analysis |
| Identification of potential cell-cell interactions between two cell types and their ligand-receptor pairs for different disease states |
| Ligand | Receptor | LRpair | Pathway | Tissue | Disease Stage |
| Page: 1 |
Top |
Single-cell gene regulatory network inference analysis |
| Find out the significant the regulons (TFs) and the target genes of each regulon across cell types for different disease states |
| TF | Cell Type | Tissue | Disease Stage | Target Gene | RSS | Regulon Activity |
| ∗The dot plots of a searched regulon are shown for all cell subpopulations in each disease state of each tissue based on the regulon specific score inferred using pySCENIC and by calculating the average expression. |
| Page: 1 |
Top |
Somatic mutation of malignant transformation related genes |
| Annotation of somatic variants for genes involved in malignant transformation |
| Hugo Symbol | Variant Class | Variant Classification | dbSNP RS | HGVSc | HGVSp | HGVSp Short | SWISSPROT | BIOTYPE | SIFT | PolyPhen | Tumor Sample Barcode | Tissue | Histology | Sex | Age | Stage | Therapy Types | Drugs | Outcome |
| SULT1C4 | SNV | Missense_Mutation | c.580N>T | p.Arg194Cys | p.R194C | O75897 | protein_coding | tolerated(0.07) | possibly_damaging(0.891) | TCGA-A8-A09Z-01 | Breast | breast invasive carcinoma | Female | >=65 | I/II | Unknown | Unknown | SD | |
| SULT1C4 | deletion | Frame_Shift_Del | c.417delC | p.Lys140ArgfsTer13 | p.K140Rfs*13 | O75897 | protein_coding | TCGA-D8-A27V-01 | Breast | breast invasive carcinoma | Female | <65 | I/II | Hormone Therapy | tamoxiphen | SD | |||
| SULT1C4 | SNV | Missense_Mutation | c.580C>T | p.Arg194Cys | p.R194C | O75897 | protein_coding | tolerated(0.07) | possibly_damaging(0.891) | TCGA-2W-A8YY-01 | Cervix | cervical & endocervical cancer | Female | <65 | I/II | Chemotherapy | cisplatin | CR | |
| SULT1C4 | SNV | Missense_Mutation | novel | c.562G>C | p.Glu188Gln | p.E188Q | O75897 | protein_coding | tolerated(0.07) | benign(0.023) | TCGA-C5-A7CK-01 | Cervix | cervical & endocervical cancer | Female | <65 | I/II | Chemotherapy | cisplatin | SD |
| SULT1C4 | SNV | Missense_Mutation | novel | c.479N>A | p.Gly160Glu | p.G160E | O75897 | protein_coding | deleterious(0.02) | possibly_damaging(0.711) | TCGA-VS-A958-01 | Cervix | cervical & endocervical cancer | Female | <65 | I/II | Chemotherapy | cisplatin | CR |
| SULT1C4 | SNV | Missense_Mutation | rs137946991 | c.254G>A | p.Arg85Gln | p.R85Q | O75897 | protein_coding | deleterious(0.01) | probably_damaging(0.986) | TCGA-AA-A00N-01 | Colorectum | colon adenocarcinoma | Male | >=65 | I/II | Unknown | Unknown | PD |
| SULT1C4 | SNV | Missense_Mutation | novel | c.791N>T | p.Arg264Ile | p.R264I | O75897 | protein_coding | deleterious(0) | probably_damaging(1) | TCGA-CA-6717-01 | Colorectum | colon adenocarcinoma | Male | <65 | I/II | Chemotherapy | oxaliplatin | CR |
| SULT1C4 | SNV | Missense_Mutation | c.808N>T | p.Asp270Tyr | p.D270Y | O75897 | protein_coding | deleterious(0) | probably_damaging(1) | TCGA-CA-6718-01 | Colorectum | colon adenocarcinoma | Male | <65 | I/II | Unknown | Unknown | PD | |
| SULT1C4 | SNV | Missense_Mutation | novel | c.845N>T | p.Arg282Ile | p.R282I | O75897 | protein_coding | tolerated(0.13) | benign(0.04) | TCGA-F5-6814-01 | Colorectum | rectum adenocarcinoma | Male | <65 | I/II | Unknown | Unknown | SD |
| SULT1C4 | SNV | Missense_Mutation | rs143857621 | c.268N>A | p.Glu90Lys | p.E90K | O75897 | protein_coding | deleterious(0.01) | probably_damaging(1) | TCGA-A5-A2K5-01 | Endometrium | uterine corpus endometrioid carcinoma | Female | >=65 | I/II | Unknown | Unknown | SD |
| Page: 1 2 3 |
Top |
Related drugs of malignant transformation related genes |
| Identification of chemicals and drugs interact with genes involved in malignant transfromation |
| (DGIdb 4.0) |
| Entrez ID | Symbol | Category | Interaction Types | Drug Claim Name | Drug Name | PMIDs |
| 27233 | SULT1C4 | ENZYME | docetaxel | DOCETAXEL | 20038957 | |
| 27233 | SULT1C4 | ENZYME | thalidomide | THALIDOMIDE | 20038957 |
| Page: 1 |

Copyright 2023-Present -The University of Texas Health Science Center at Houston |