
|
|||||
|
 | |
| |
| |
| |
| |
| |
|
Gene: SULT1C2 |
Gene summary for SULT1C2 |
| Gene information | Species | Human | Gene symbol | SULT1C2 | Gene ID | 6819 |
| Gene name | sulfotransferase family 1C member 2 | |
| Gene Alias | ST1C1 | |
| Cytomap | 2q12.3 | |
| Gene Type | protein-coding | GO ID | GO:0006790 | UniProtAcc | O00338 |
Top |
Malignant transformation analysis |
| Identification of the aberrant gene expression in precancerous and cancerous lesions by comparing the gene expression of stem-like cells in diseased tissues with normal stem cells |
| Entrez ID | Symbol | Replicates | Species | Organ | Tissue | Adj P-value | Log2FC | Malignancy |
| 6819 | SULT1C2 | P94T-E | Human | Esophagus | ESCC | 4.93e-19 | 2.39e+00 | 0.0879 |
| 6819 | SULT1C2 | P104T-E | Human | Esophagus | ESCC | 9.45e-38 | 1.95e+00 | 0.0931 |
| 6819 | SULT1C2 | NAFLD1 | Human | Liver | NAFLD | 5.05e-11 | 6.92e-01 | -0.04 |
| 6819 | SULT1C2 | HCC1_Meng | Human | Liver | HCC | 4.60e-83 | 4.85e-01 | 0.0246 |
| 6819 | SULT1C2 | HCC2 | Human | Liver | HCC | 2.55e-28 | 4.02e+00 | 0.5341 |
| 6819 | SULT1C2 | Pt14.a | Human | Liver | HCC | 1.98e-09 | 4.16e-01 | 0.0169 |
| 6819 | SULT1C2 | S014 | Human | Liver | HCC | 2.34e-02 | 2.03e-01 | 0.2254 |
| 6819 | SULT1C2 | S015 | Human | Liver | HCC | 8.36e-09 | 4.73e-01 | 0.2375 |
| 6819 | SULT1C2 | S016 | Human | Liver | HCC | 1.06e-04 | 2.57e-01 | 0.2243 |
| 6819 | SULT1C2 | S027 | Human | Liver | HCC | 5.52e-23 | 1.43e+00 | 0.2446 |
| 6819 | SULT1C2 | S028 | Human | Liver | HCC | 4.20e-48 | 1.91e+00 | 0.2503 |
| 6819 | SULT1C2 | S029 | Human | Liver | HCC | 2.74e-47 | 1.84e+00 | 0.2581 |
| Page: 1 |
| Tissue | Expression Dynamics | Abbreviation |
| Esophagus | 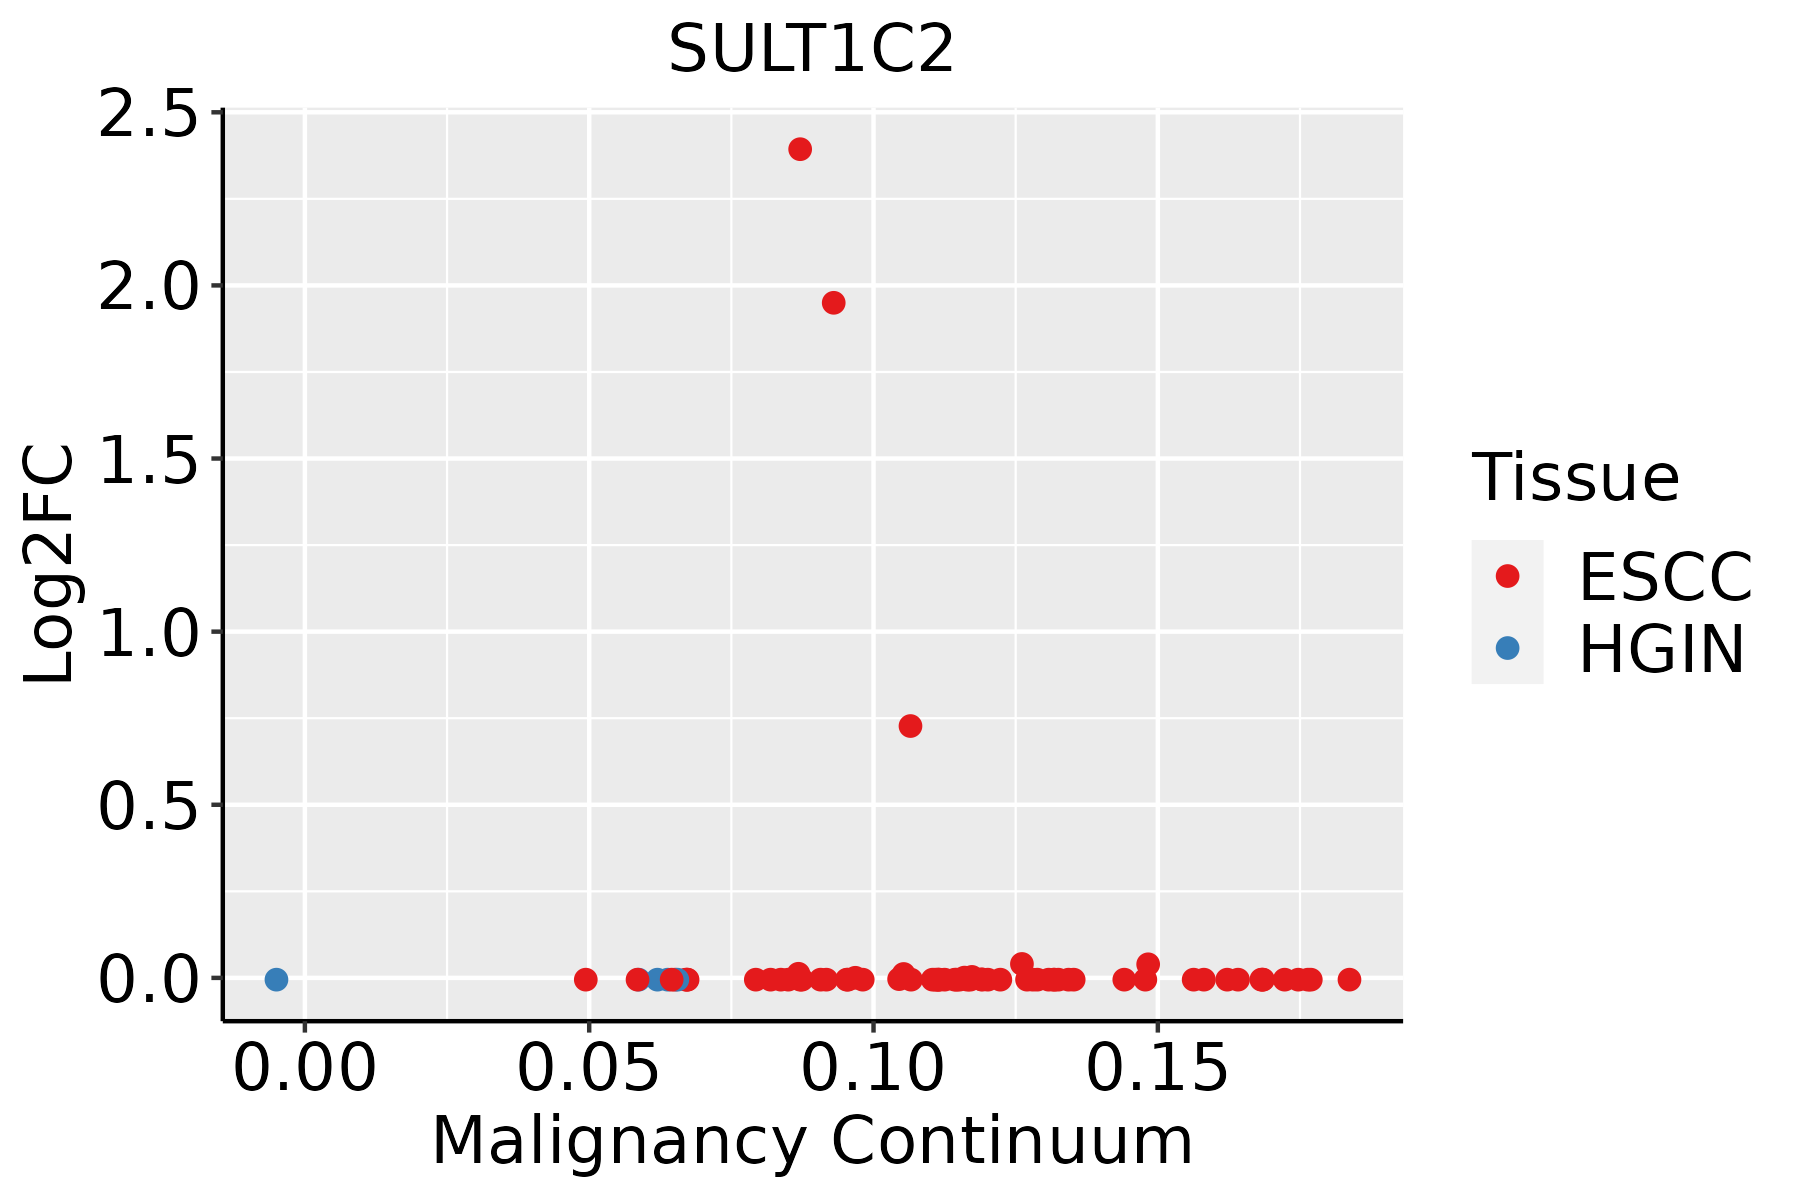 | ESCC: Esophageal squamous cell carcinoma |
| HGIN: High-grade intraepithelial neoplasias | ||
| LGIN: Low-grade intraepithelial neoplasias | ||
| Liver | 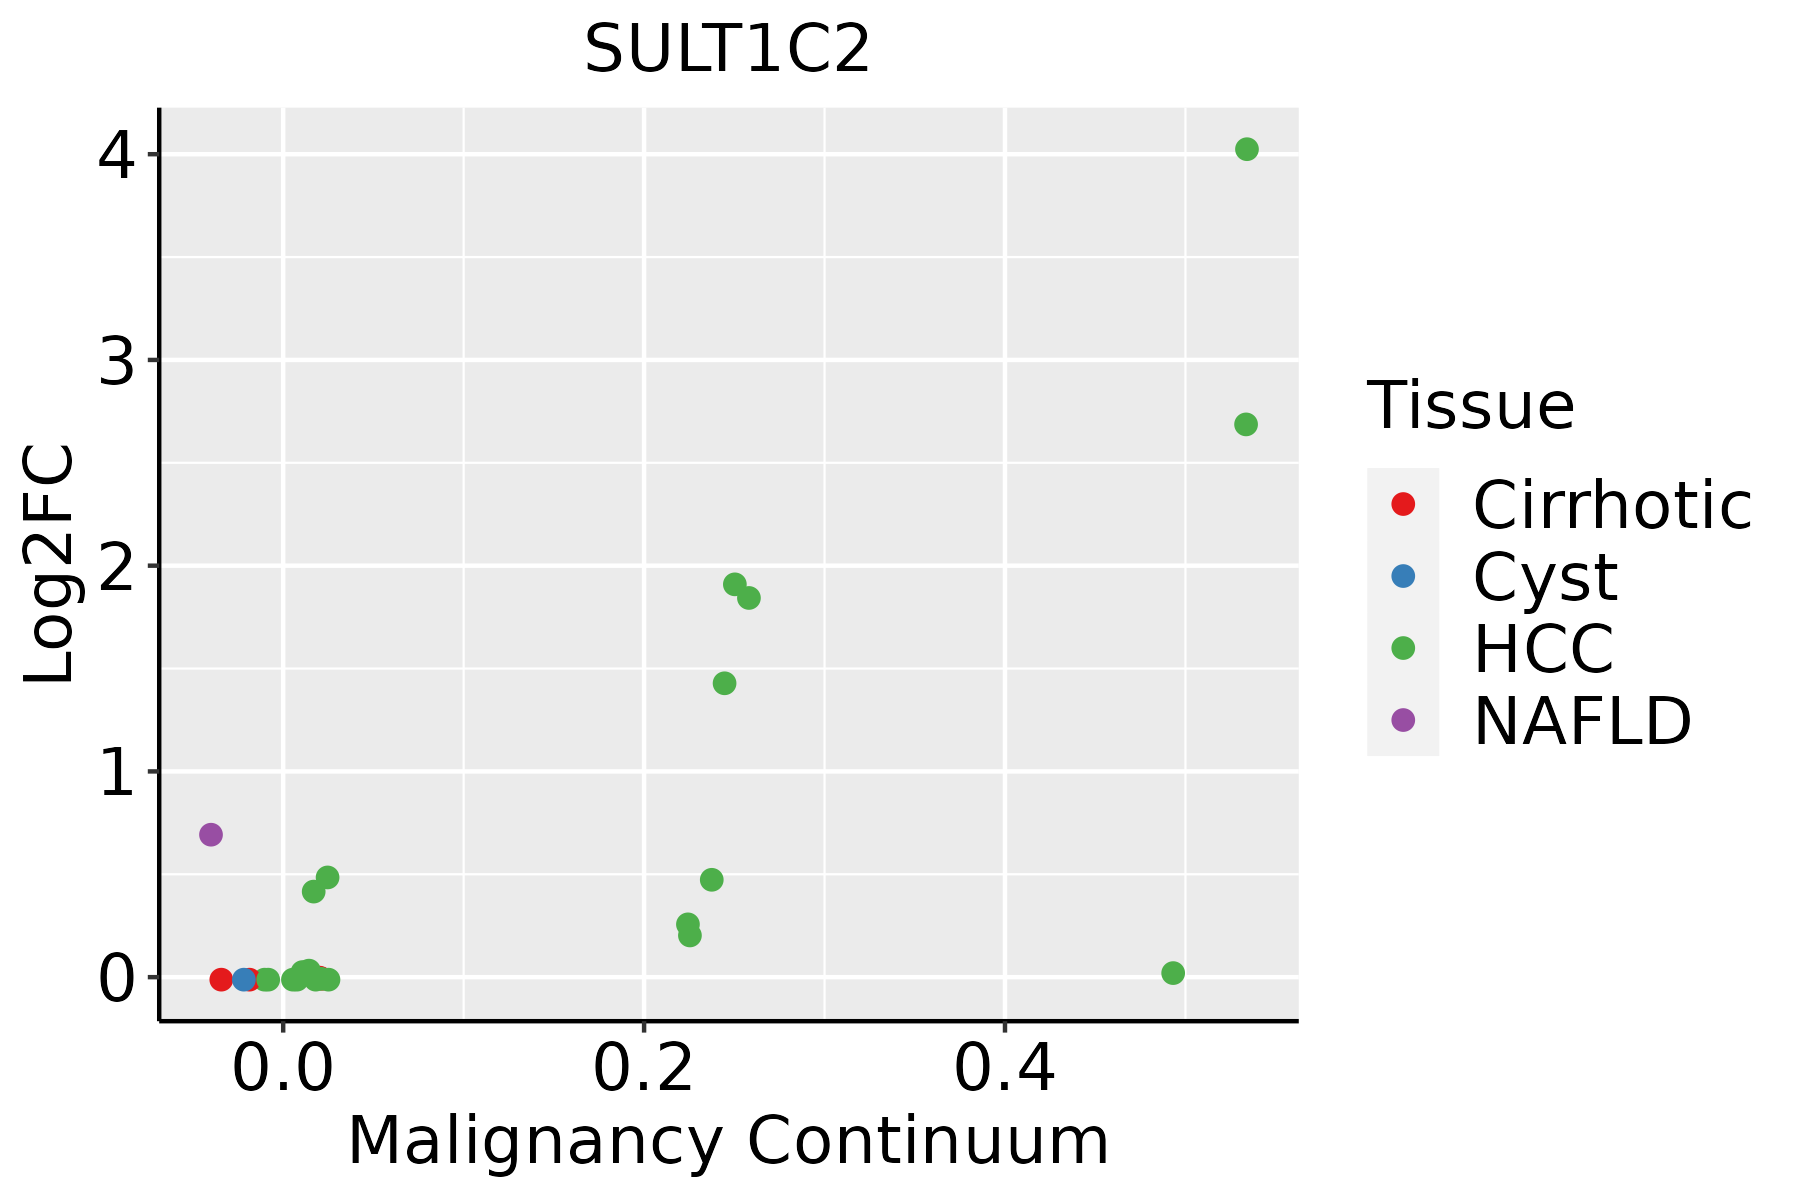 | HCC: Hepatocellular carcinoma |
| NAFLD: Non-alcoholic fatty liver disease |
| ∗log2FC in expression of this searched gene in stem-like cells from each diseased tissue sample relative to stem-like cells in normal samples in each tissue plotted against the malignancy continuum. Samples are colored based on if they are from different disease stage. |
Top |
Malignant transformation related pathway analysis |
| Find out the enriched GO biological processes and KEGG pathways involved in transition from healthy to precancer to cancer |
| Tissue | Disease Stage | Enriched GO biological Processes |
| Colorectum | AD |  |
| Colorectum | SER |  |
| Colorectum | MSS |  |
| Colorectum | MSI-H |  |
| Colorectum | FAP |  |
| ∗Top 15 enriched GO BP terms are showed in the bar plot of each disease state in each tissue. Each row represents a significant GO biological process which is colored according to the -log10(p.adjust). |
| Page: 1 2 3 4 5 6 7 8 9 |
| GO ID | Tissue | Disease Stage | Description | Gene Ratio | Bg Ratio | pvalue | p.adjust | Count |
| GO:00067906 | Esophagus | ESCC | sulfur compound metabolic process | 201/8552 | 339/18723 | 2.64e-07 | 3.94e-06 | 201 |
| GO:00067904 | Liver | NAFLD | sulfur compound metabolic process | 58/1882 | 339/18723 | 3.79e-05 | 9.38e-04 | 58 |
| GO:000679021 | Liver | HCC | sulfur compound metabolic process | 212/7958 | 339/18723 | 5.60e-14 | 3.39e-12 | 212 |
| Page: 1 |
| Pathway ID | Tissue | Disease Stage | Description | Gene Ratio | Bg Ratio | pvalue | p.adjust | qvalue | Count |
| Page: 1 |
Top |
Cell-cell communication analysis |
| Identification of potential cell-cell interactions between two cell types and their ligand-receptor pairs for different disease states |
| Ligand | Receptor | LRpair | Pathway | Tissue | Disease Stage |
| Page: 1 |
Top |
Single-cell gene regulatory network inference analysis |
| Find out the significant the regulons (TFs) and the target genes of each regulon across cell types for different disease states |
| TF | Cell Type | Tissue | Disease Stage | Target Gene | RSS | Regulon Activity |
| ∗The dot plots of a searched regulon are shown for all cell subpopulations in each disease state of each tissue based on the regulon specific score inferred using pySCENIC and by calculating the average expression. |
| Page: 1 |
Top |
Somatic mutation of malignant transformation related genes |
| Annotation of somatic variants for genes involved in malignant transformation |
| Hugo Symbol | Variant Class | Variant Classification | dbSNP RS | HGVSc | HGVSp | HGVSp Short | SWISSPROT | BIOTYPE | SIFT | PolyPhen | Tumor Sample Barcode | Tissue | Histology | Sex | Age | Stage | Therapy Types | Drugs | Outcome |
| SULT1C2 | SNV | Missense_Mutation | novel | c.556G>A | p.Asp186Asn | p.D186N | O00338 | protein_coding | tolerated(0.15) | benign(0.444) | TCGA-AN-A041-01 | Breast | breast invasive carcinoma | Female | <65 | I/II | Unknown | Unknown | SD |
| SULT1C2 | SNV | Missense_Mutation | rs756399703 | c.586N>A | p.Asp196Asn | p.D196N | O00338 | protein_coding | tolerated(0.09) | benign(0.061) | TCGA-BH-A1FR-01 | Breast | breast invasive carcinoma | Female | >=65 | III/IV | Unknown | Unknown | PD |
| SULT1C2 | SNV | Missense_Mutation | c.732N>A | p.Met244Ile | p.M244I | O00338 | protein_coding | deleterious(0) | probably_damaging(1) | TCGA-C8-A26Y-01 | Breast | breast invasive carcinoma | Female | >=65 | I/II | Unknown | Unknown | SD | |
| SULT1C2 | insertion | Frame_Shift_Ins | novel | c.211_212insACCTAAATAAGGTACATAGAGTCCATAGA | p.Cys71TyrfsTer47 | p.C71Yfs*47 | O00338 | protein_coding | TCGA-BH-A0HF-01 | Breast | breast invasive carcinoma | Female | >=65 | I/II | Hormone Therapy | arimidex | SD | ||
| SULT1C2 | SNV | Missense_Mutation | c.127N>T | p.Leu43Phe | p.L43F | O00338 | protein_coding | tolerated(0.05) | possibly_damaging(0.467) | TCGA-AA-3968-01 | Colorectum | colon adenocarcinoma | Female | <65 | I/II | Unknown | Unknown | SD | |
| SULT1C2 | SNV | Missense_Mutation | rs112864909 | c.754N>T | p.Arg252Cys | p.R252C | O00338 | protein_coding | deleterious(0) | benign(0.031) | TCGA-CA-6717-01 | Colorectum | colon adenocarcinoma | Male | <65 | I/II | Chemotherapy | oxaliplatin | CR |
| SULT1C2 | SNV | Missense_Mutation | c.272N>A | p.Pro91His | p.P91H | O00338 | protein_coding | deleterious(0) | benign(0.019) | TCGA-CM-6674-01 | Colorectum | colon adenocarcinoma | Male | <65 | I/II | Unknown | Unknown | SD | |
| SULT1C2 | SNV | Missense_Mutation | rs770292499 | c.235N>T | p.Arg79Cys | p.R79C | O00338 | protein_coding | deleterious(0) | probably_damaging(1) | TCGA-A5-A0G2-01 | Endometrium | uterine corpus endometrioid carcinoma | Female | <65 | III/IV | Unknown | Unknown | SD |
| SULT1C2 | SNV | Missense_Mutation | novel | c.743C>A | p.Pro248His | p.P248H | O00338 | protein_coding | deleterious(0) | probably_damaging(0.999) | TCGA-A5-A1OF-01 | Endometrium | uterine corpus endometrioid carcinoma | Female | <65 | I/II | Unknown | Unknown | SD |
| SULT1C2 | SNV | Missense_Mutation | novel | c.522N>A | p.Phe174Leu | p.F174L | O00338 | protein_coding | deleterious(0) | possibly_damaging(0.877) | TCGA-A5-A2K5-01 | Endometrium | uterine corpus endometrioid carcinoma | Female | >=65 | I/II | Unknown | Unknown | SD |
| Page: 1 2 3 4 |
Top |
Related drugs of malignant transformation related genes |
| Identification of chemicals and drugs interact with genes involved in malignant transfromation |
| (DGIdb 4.0) |
| Entrez ID | Symbol | Category | Interaction Types | Drug Claim Name | Drug Name | PMIDs |
| Page: 1 |

Copyright 2023-Present -The University of Texas Health Science Center at Houston |