
|
|||||
|
 | |
| |
| |
| |
| |
| |
|
Gene: SULT1B1 |
Gene summary for SULT1B1 |
| Gene information | Species | Human | Gene symbol | SULT1B1 | Gene ID | 27284 |
| Gene name | sulfotransferase family 1B member 1 | |
| Gene Alias | ST1B1 | |
| Cytomap | 4q13.3 | |
| Gene Type | protein-coding | GO ID | GO:0006066 | UniProtAcc | O43704 |
Top |
Malignant transformation analysis |
| Identification of the aberrant gene expression in precancerous and cancerous lesions by comparing the gene expression of stem-like cells in diseased tissues with normal stem cells |
| Entrez ID | Symbol | Replicates | Species | Organ | Tissue | Adj P-value | Log2FC | Malignancy |
| 27284 | SULT1B1 | HTA11_3410_2000001011 | Human | Colorectum | AD | 1.75e-11 | -4.94e-01 | 0.0155 |
| 27284 | SULT1B1 | HTA11_347_2000001011 | Human | Colorectum | AD | 4.20e-03 | 4.38e-01 | -0.1954 |
| 27284 | SULT1B1 | HTA11_3361_2000001011 | Human | Colorectum | AD | 1.39e-02 | -4.42e-01 | -0.1207 |
| 27284 | SULT1B1 | HTA11_866_3004761011 | Human | Colorectum | AD | 2.22e-04 | -3.65e-01 | 0.096 |
| 27284 | SULT1B1 | HTA11_10711_2000001011 | Human | Colorectum | AD | 1.97e-02 | -4.10e-01 | 0.0338 |
| 27284 | SULT1B1 | HTA11_99999970781_79442 | Human | Colorectum | MSS | 1.37e-02 | -3.22e-01 | 0.294 |
| 27284 | SULT1B1 | HTA11_99999971662_82457 | Human | Colorectum | MSS | 1.37e-04 | -4.22e-01 | 0.3859 |
| 27284 | SULT1B1 | HTA11_99999973899_84307 | Human | Colorectum | MSS | 4.27e-03 | -5.00e-01 | 0.2585 |
| 27284 | SULT1B1 | HTA11_99999974143_84620 | Human | Colorectum | MSS | 2.74e-17 | -5.33e-01 | 0.3005 |
| 27284 | SULT1B1 | A015-C-203 | Human | Colorectum | FAP | 1.78e-15 | -1.62e-01 | -0.1294 |
| 27284 | SULT1B1 | A002-C-201 | Human | Colorectum | FAP | 2.38e-05 | -7.86e-02 | 0.0324 |
| 27284 | SULT1B1 | A001-C-119 | Human | Colorectum | FAP | 7.34e-03 | -2.03e-01 | -0.1557 |
| 27284 | SULT1B1 | A001-C-108 | Human | Colorectum | FAP | 3.71e-06 | -5.48e-02 | -0.0272 |
| 27284 | SULT1B1 | A002-C-205 | Human | Colorectum | FAP | 5.90e-11 | -2.66e-01 | -0.1236 |
| 27284 | SULT1B1 | A015-C-006 | Human | Colorectum | FAP | 2.37e-08 | -3.00e-01 | -0.0994 |
| 27284 | SULT1B1 | A015-C-106 | Human | Colorectum | FAP | 1.59e-03 | -1.53e-01 | -0.0511 |
| 27284 | SULT1B1 | A002-C-114 | Human | Colorectum | FAP | 4.31e-08 | -1.45e-01 | -0.1561 |
| 27284 | SULT1B1 | A015-C-104 | Human | Colorectum | FAP | 2.78e-15 | -1.88e-01 | -0.1899 |
| 27284 | SULT1B1 | A001-C-014 | Human | Colorectum | FAP | 4.17e-06 | -1.11e-01 | 0.0135 |
| 27284 | SULT1B1 | A002-C-016 | Human | Colorectum | FAP | 6.43e-09 | 5.24e-02 | 0.0521 |
| Page: 1 2 |
| Tissue | Expression Dynamics | Abbreviation |
| Colorectum (GSE201348) |  | FAP: Familial adenomatous polyposis |
| CRC: Colorectal cancer | ||
| Colorectum (HTA11) |  | AD: Adenomas |
| SER: Sessile serrated lesions | ||
| MSI-H: Microsatellite-high colorectal cancer | ||
| MSS: Microsatellite stable colorectal cancer | ||
| GC | 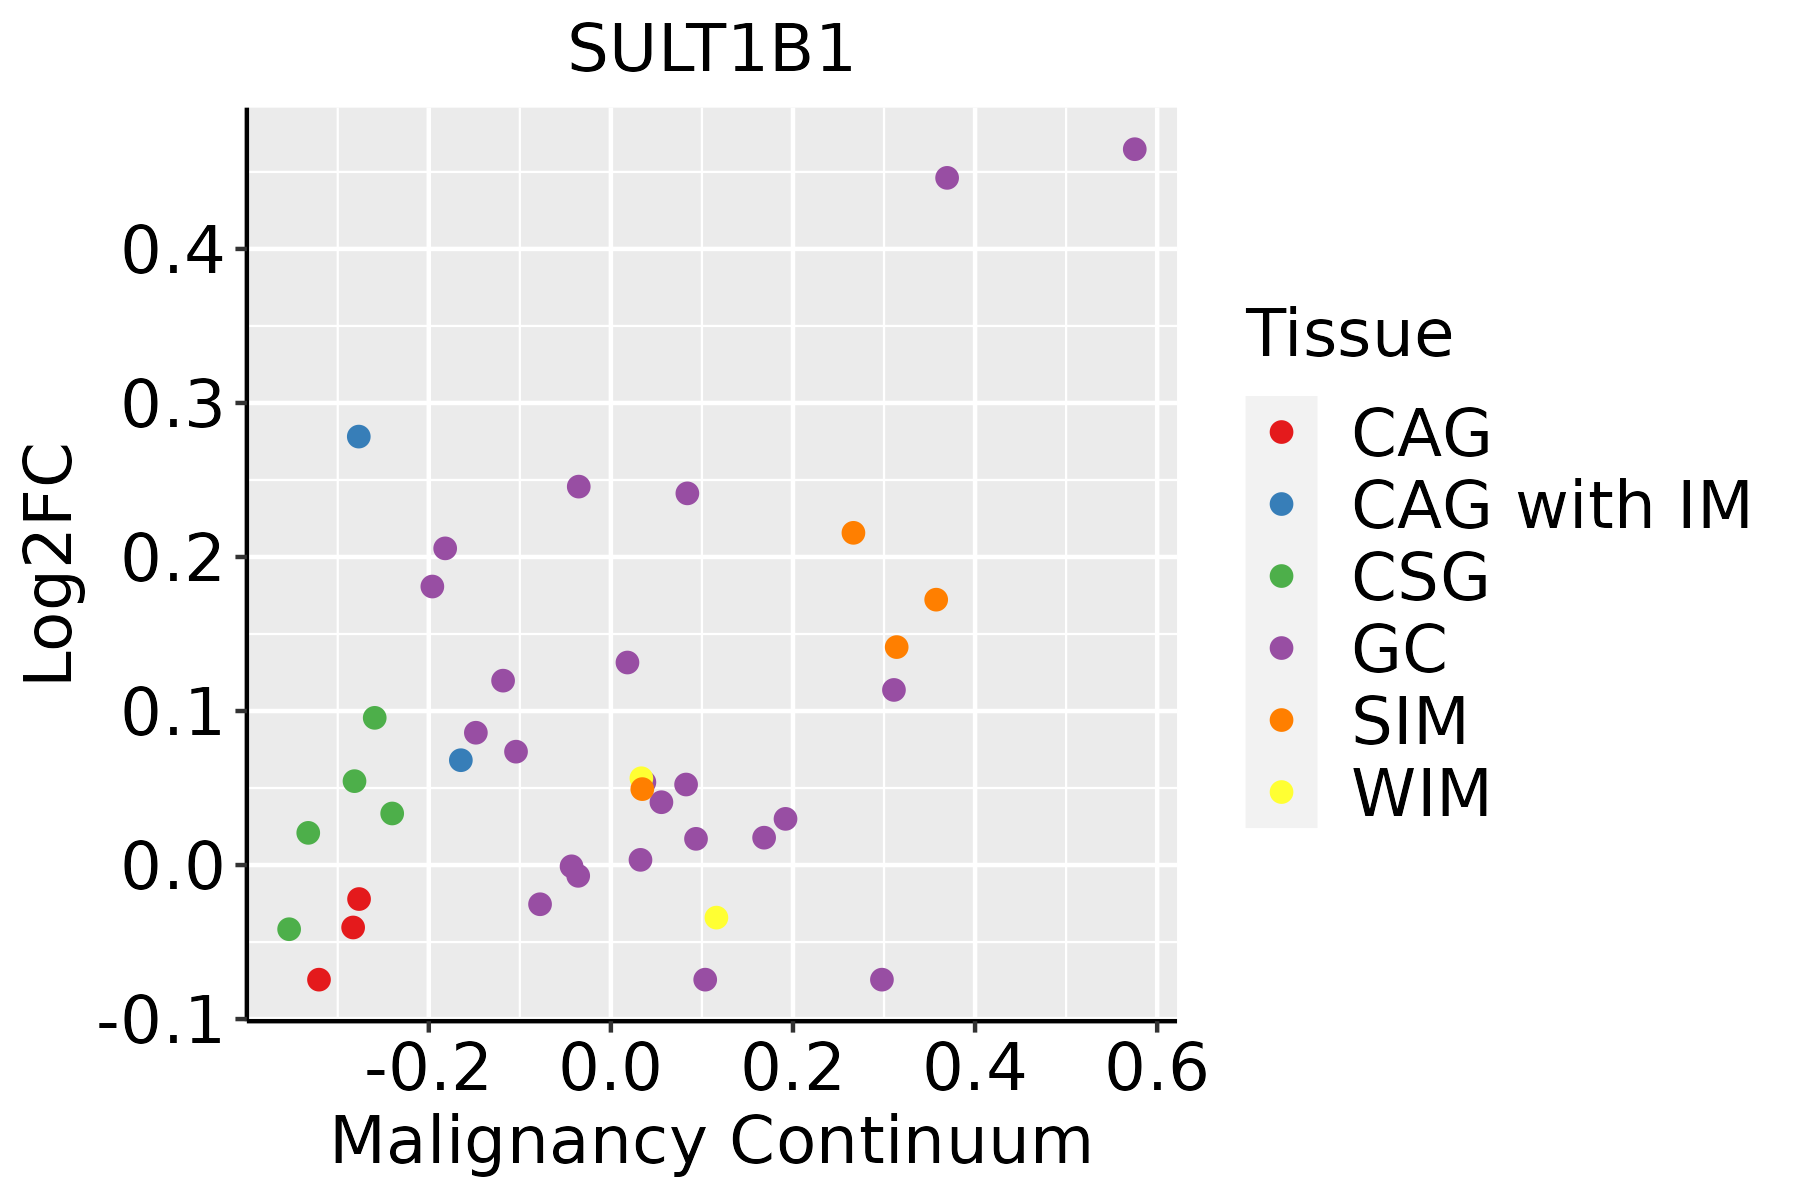 | CAG: Chronic atrophic gastritis |
| CAG with IM: Chronic atrophic gastritis with intestinal metaplasia | ||
| CSG: Chronic superficial gastritis | ||
| GC: Gastric cancer | ||
| SIM: Severe intestinal metaplasia | ||
| WIM: Wild intestinal metaplasia |
| ∗log2FC in expression of this searched gene in stem-like cells from each diseased tissue sample relative to stem-like cells in normal samples in each tissue plotted against the malignancy continuum. Samples are colored based on if they are from different disease stage. |
Top |
Malignant transformation related pathway analysis |
| Find out the enriched GO biological processes and KEGG pathways involved in transition from healthy to precancer to cancer |
| Tissue | Disease Stage | Enriched GO biological Processes |
| Colorectum | AD |  |
| Colorectum | SER |  |
| Colorectum | MSS |  |
| Colorectum | MSI-H |  |
| Colorectum | FAP |  |
| ∗Top 15 enriched GO BP terms are showed in the bar plot of each disease state in each tissue. Each row represents a significant GO biological process which is colored according to the -log10(p.adjust). |
| Page: 1 2 3 4 5 6 7 8 9 |
| GO ID | Tissue | Disease Stage | Description | Gene Ratio | Bg Ratio | pvalue | p.adjust | Count |
| GO:0009150 | Colorectum | AD | purine ribonucleotide metabolic process | 142/3918 | 368/18723 | 4.29e-15 | 1.17e-12 | 142 |
| GO:0006163 | Colorectum | AD | purine nucleotide metabolic process | 149/3918 | 396/18723 | 1.08e-14 | 2.80e-12 | 149 |
| GO:0072521 | Colorectum | AD | purine-containing compound metabolic process | 153/3918 | 416/18723 | 4.34e-14 | 1.01e-11 | 153 |
| GO:0009259 | Colorectum | AD | ribonucleotide metabolic process | 144/3918 | 385/18723 | 5.25e-14 | 1.13e-11 | 144 |
| GO:0019693 | Colorectum | AD | ribose phosphate metabolic process | 145/3918 | 396/18723 | 3.01e-13 | 5.71e-11 | 145 |
| GO:0009117 | Colorectum | AD | nucleotide metabolic process | 168/3918 | 489/18723 | 2.20e-12 | 3.36e-10 | 168 |
| GO:0006753 | Colorectum | AD | nucleoside phosphate metabolic process | 169/3918 | 497/18723 | 4.99e-12 | 6.98e-10 | 169 |
| GO:0044282 | Colorectum | AD | small molecule catabolic process | 118/3918 | 376/18723 | 1.05e-06 | 3.55e-05 | 118 |
| GO:0006066 | Colorectum | AD | alcohol metabolic process | 106/3918 | 353/18723 | 3.02e-05 | 5.57e-04 | 106 |
| GO:0006790 | Colorectum | AD | sulfur compound metabolic process | 101/3918 | 339/18723 | 6.46e-05 | 1.07e-03 | 101 |
| GO:0009410 | Colorectum | AD | response to xenobiotic stimulus | 128/3918 | 462/18723 | 2.69e-04 | 3.31e-03 | 128 |
| GO:0006575 | Colorectum | AD | cellular modified amino acid metabolic process | 59/3918 | 188/18723 | 4.80e-04 | 5.27e-03 | 59 |
| GO:0034310 | Colorectum | AD | primary alcohol catabolic process | 9/3918 | 15/18723 | 1.11e-03 | 1.01e-02 | 9 |
| GO:0033865 | Colorectum | AD | nucleoside bisphosphate metabolic process | 42/3918 | 128/18723 | 1.12e-03 | 1.02e-02 | 42 |
| GO:0033875 | Colorectum | AD | ribonucleoside bisphosphate metabolic process | 42/3918 | 128/18723 | 1.12e-03 | 1.02e-02 | 42 |
| GO:0034032 | Colorectum | AD | purine nucleoside bisphosphate metabolic process | 42/3918 | 128/18723 | 1.12e-03 | 1.02e-02 | 42 |
| GO:0034308 | Colorectum | AD | primary alcohol metabolic process | 35/3918 | 102/18723 | 1.16e-03 | 1.05e-02 | 35 |
| GO:0006067 | Colorectum | AD | ethanol metabolic process | 11/3918 | 21/18723 | 1.43e-03 | 1.22e-02 | 11 |
| GO:0034035 | Colorectum | AD | purine ribonucleoside bisphosphate metabolic process | 11/3918 | 21/18723 | 1.43e-03 | 1.22e-02 | 11 |
| GO:0050427 | Colorectum | AD | 3'-phosphoadenosine 5'-phosphosulfate metabolic process | 11/3918 | 21/18723 | 1.43e-03 | 1.22e-02 | 11 |
| Page: 1 2 3 4 5 |
| Pathway ID | Tissue | Disease Stage | Description | Gene Ratio | Bg Ratio | pvalue | p.adjust | qvalue | Count |
| Page: 1 |
Top |
Cell-cell communication analysis |
| Identification of potential cell-cell interactions between two cell types and their ligand-receptor pairs for different disease states |
| Ligand | Receptor | LRpair | Pathway | Tissue | Disease Stage |
| Page: 1 |
Top |
Single-cell gene regulatory network inference analysis |
| Find out the significant the regulons (TFs) and the target genes of each regulon across cell types for different disease states |
| TF | Cell Type | Tissue | Disease Stage | Target Gene | RSS | Regulon Activity |
| ∗The dot plots of a searched regulon are shown for all cell subpopulations in each disease state of each tissue based on the regulon specific score inferred using pySCENIC and by calculating the average expression. |
| Page: 1 |
Top |
Somatic mutation of malignant transformation related genes |
| Annotation of somatic variants for genes involved in malignant transformation |
| Hugo Symbol | Variant Class | Variant Classification | dbSNP RS | HGVSc | HGVSp | HGVSp Short | SWISSPROT | BIOTYPE | SIFT | PolyPhen | Tumor Sample Barcode | Tissue | Histology | Sex | Age | Stage | Therapy Types | Drugs | Outcome |
| SULT1B1 | SNV | Missense_Mutation | c.398N>T | p.Ala133Val | p.A133V | O43704 | protein_coding | deleterious(0.05) | benign(0.188) | TCGA-AR-A251-01 | Breast | breast invasive carcinoma | Female | <65 | III/IV | Chemotherapy | doxorubicin | SD | |
| SULT1B1 | SNV | Missense_Mutation | novel | c.256N>T | p.Leu86Phe | p.L86F | O43704 | protein_coding | tolerated(0.72) | benign(0.007) | TCGA-BH-A5J0-01 | Breast | breast invasive carcinoma | Female | <65 | I/II | Unknown | Unknown | SD |
| SULT1B1 | SNV | Missense_Mutation | c.180G>A | p.Met60Ile | p.M60I | O43704 | protein_coding | deleterious(0.01) | benign(0.075) | TCGA-DR-A0ZM-01 | Cervix | cervical & endocervical cancer | Female | <65 | III/IV | Unspecific | Cisplatin | SD | |
| SULT1B1 | SNV | Missense_Mutation | rs540095455 | c.391N>T | p.Arg131Cys | p.R131C | O43704 | protein_coding | deleterious(0.01) | probably_damaging(1) | TCGA-IR-A3LA-01 | Cervix | cervical & endocervical cancer | Female | <65 | I/II | Chemotherapy | cisplatin | CR |
| SULT1B1 | SNV | Missense_Mutation | c.699N>A | p.Met233Ile | p.M233I | O43704 | protein_coding | deleterious(0) | probably_damaging(0.998) | TCGA-JX-A3Q0-01 | Cervix | cervical & endocervical cancer | Female | <65 | III/IV | Unknown | Unknown | SD | |
| SULT1B1 | SNV | Missense_Mutation | rs779362138 | c.310N>T | p.Arg104Trp | p.R104W | O43704 | protein_coding | deleterious(0) | probably_damaging(1) | TCGA-AA-3672-01 | Colorectum | colon adenocarcinoma | Female | >=65 | III/IV | Unknown | Unknown | SD |
| SULT1B1 | SNV | Missense_Mutation | novel | c.752A>G | p.His251Arg | p.H251R | O43704 | protein_coding | deleterious(0.01) | benign(0.203) | TCGA-AA-3811-01 | Colorectum | colon adenocarcinoma | Female | >=65 | III/IV | Unknown | Unknown | PD |
| SULT1B1 | SNV | Missense_Mutation | c.778N>T | p.Gly260Trp | p.G260W | O43704 | protein_coding | deleterious(0) | probably_damaging(1) | TCGA-AA-A010-01 | Colorectum | colon adenocarcinoma | Female | <65 | I/II | Chemotherapy | folinic | CR | |
| SULT1B1 | SNV | Missense_Mutation | c.483N>T | p.Glu161Asp | p.E161D | O43704 | protein_coding | tolerated(0.1) | benign(0.007) | TCGA-AA-A010-01 | Colorectum | colon adenocarcinoma | Female | <65 | I/II | Chemotherapy | folinic | CR | |
| SULT1B1 | SNV | Missense_Mutation | novel | c.625N>C | p.Ile209Leu | p.I209L | O43704 | protein_coding | tolerated(1) | benign(0) | TCGA-AG-A002-01 | Colorectum | rectum adenocarcinoma | Male | <65 | I/II | Unknown | Unknown | SD |
| Page: 1 2 3 4 5 6 7 |
Top |
Related drugs of malignant transformation related genes |
| Identification of chemicals and drugs interact with genes involved in malignant transfromation |
| (DGIdb 4.0) |
| Entrez ID | Symbol | Category | Interaction Types | Drug Claim Name | Drug Name | PMIDs |
| Page: 1 |

Copyright 2023-Present -The University of Texas Health Science Center at Houston |