
|
|||||
|
 | |
| |
| |
| |
| |
| |
|
Gene: SULT1A1 |
Gene summary for SULT1A1 |
| Gene information | Species | Human | Gene symbol | SULT1A1 | Gene ID | 6817 |
| Gene name | sulfotransferase family 1A member 1 | |
| Gene Alias | HAST1/HAST2 | |
| Cytomap | 16p11.2 | |
| Gene Type | protein-coding | GO ID | GO:0006066 | UniProtAcc | P50225 |
Top |
Malignant transformation analysis |
| Identification of the aberrant gene expression in precancerous and cancerous lesions by comparing the gene expression of stem-like cells in diseased tissues with normal stem cells |
| Entrez ID | Symbol | Replicates | Species | Organ | Tissue | Adj P-value | Log2FC | Malignancy |
| 6817 | SULT1A1 | HTA11_347_2000001011 | Human | Colorectum | AD | 7.93e-38 | 1.16e+00 | -0.1954 |
| 6817 | SULT1A1 | HTA11_2112_2000001011 | Human | Colorectum | SER | 2.82e-02 | 7.14e-01 | -0.2196 |
| 6817 | SULT1A1 | HTA11_3361_2000001011 | Human | Colorectum | AD | 1.23e-03 | 5.44e-01 | -0.1207 |
| 6817 | SULT1A1 | HTA11_83_2000001011 | Human | Colorectum | SER | 4.62e-09 | 8.40e-01 | -0.1526 |
| 6817 | SULT1A1 | HTA11_696_2000001011 | Human | Colorectum | AD | 1.08e-19 | 8.78e-01 | -0.1464 |
| 6817 | SULT1A1 | HTA11_866_2000001011 | Human | Colorectum | AD | 1.18e-06 | 4.25e-01 | -0.1001 |
| 6817 | SULT1A1 | HTA11_1391_2000001011 | Human | Colorectum | AD | 4.98e-02 | 4.10e-01 | -0.059 |
| 6817 | SULT1A1 | HTA11_2992_2000001011 | Human | Colorectum | SER | 2.89e-02 | 6.12e-01 | -0.1706 |
| 6817 | SULT1A1 | HTA11_10623_2000001011 | Human | Colorectum | AD | 2.73e-04 | 7.27e-01 | -0.0177 |
| 6817 | SULT1A1 | F007 | Human | Colorectum | FAP | 2.17e-02 | -3.01e-01 | 0.1176 |
| 6817 | SULT1A1 | A001-C-207 | Human | Colorectum | FAP | 1.92e-05 | -3.12e-01 | 0.1278 |
| 6817 | SULT1A1 | A015-C-203 | Human | Colorectum | FAP | 2.63e-09 | -1.42e-01 | -0.1294 |
| 6817 | SULT1A1 | A002-C-201 | Human | Colorectum | FAP | 4.61e-06 | -1.74e-01 | 0.0324 |
| 6817 | SULT1A1 | A002-C-203 | Human | Colorectum | FAP | 3.47e-04 | -2.60e-01 | 0.2786 |
| 6817 | SULT1A1 | A001-C-119 | Human | Colorectum | FAP | 2.97e-05 | -3.10e-01 | -0.1557 |
| 6817 | SULT1A1 | A001-C-108 | Human | Colorectum | FAP | 4.79e-03 | -2.09e-01 | -0.0272 |
| 6817 | SULT1A1 | A002-C-205 | Human | Colorectum | FAP | 8.12e-12 | -2.95e-01 | -0.1236 |
| 6817 | SULT1A1 | A015-C-005 | Human | Colorectum | FAP | 1.46e-02 | -1.99e-01 | -0.0336 |
| 6817 | SULT1A1 | A015-C-006 | Human | Colorectum | FAP | 5.33e-06 | -1.90e-01 | -0.0994 |
| 6817 | SULT1A1 | A002-C-114 | Human | Colorectum | FAP | 1.14e-07 | -2.42e-01 | -0.1561 |
| Page: 1 2 3 4 5 6 7 |
| Tissue | Expression Dynamics | Abbreviation |
| Colorectum (GSE201348) |  | FAP: Familial adenomatous polyposis |
| CRC: Colorectal cancer | ||
| Colorectum (HTA11) |  | AD: Adenomas |
| SER: Sessile serrated lesions | ||
| MSI-H: Microsatellite-high colorectal cancer | ||
| MSS: Microsatellite stable colorectal cancer | ||
| Esophagus | 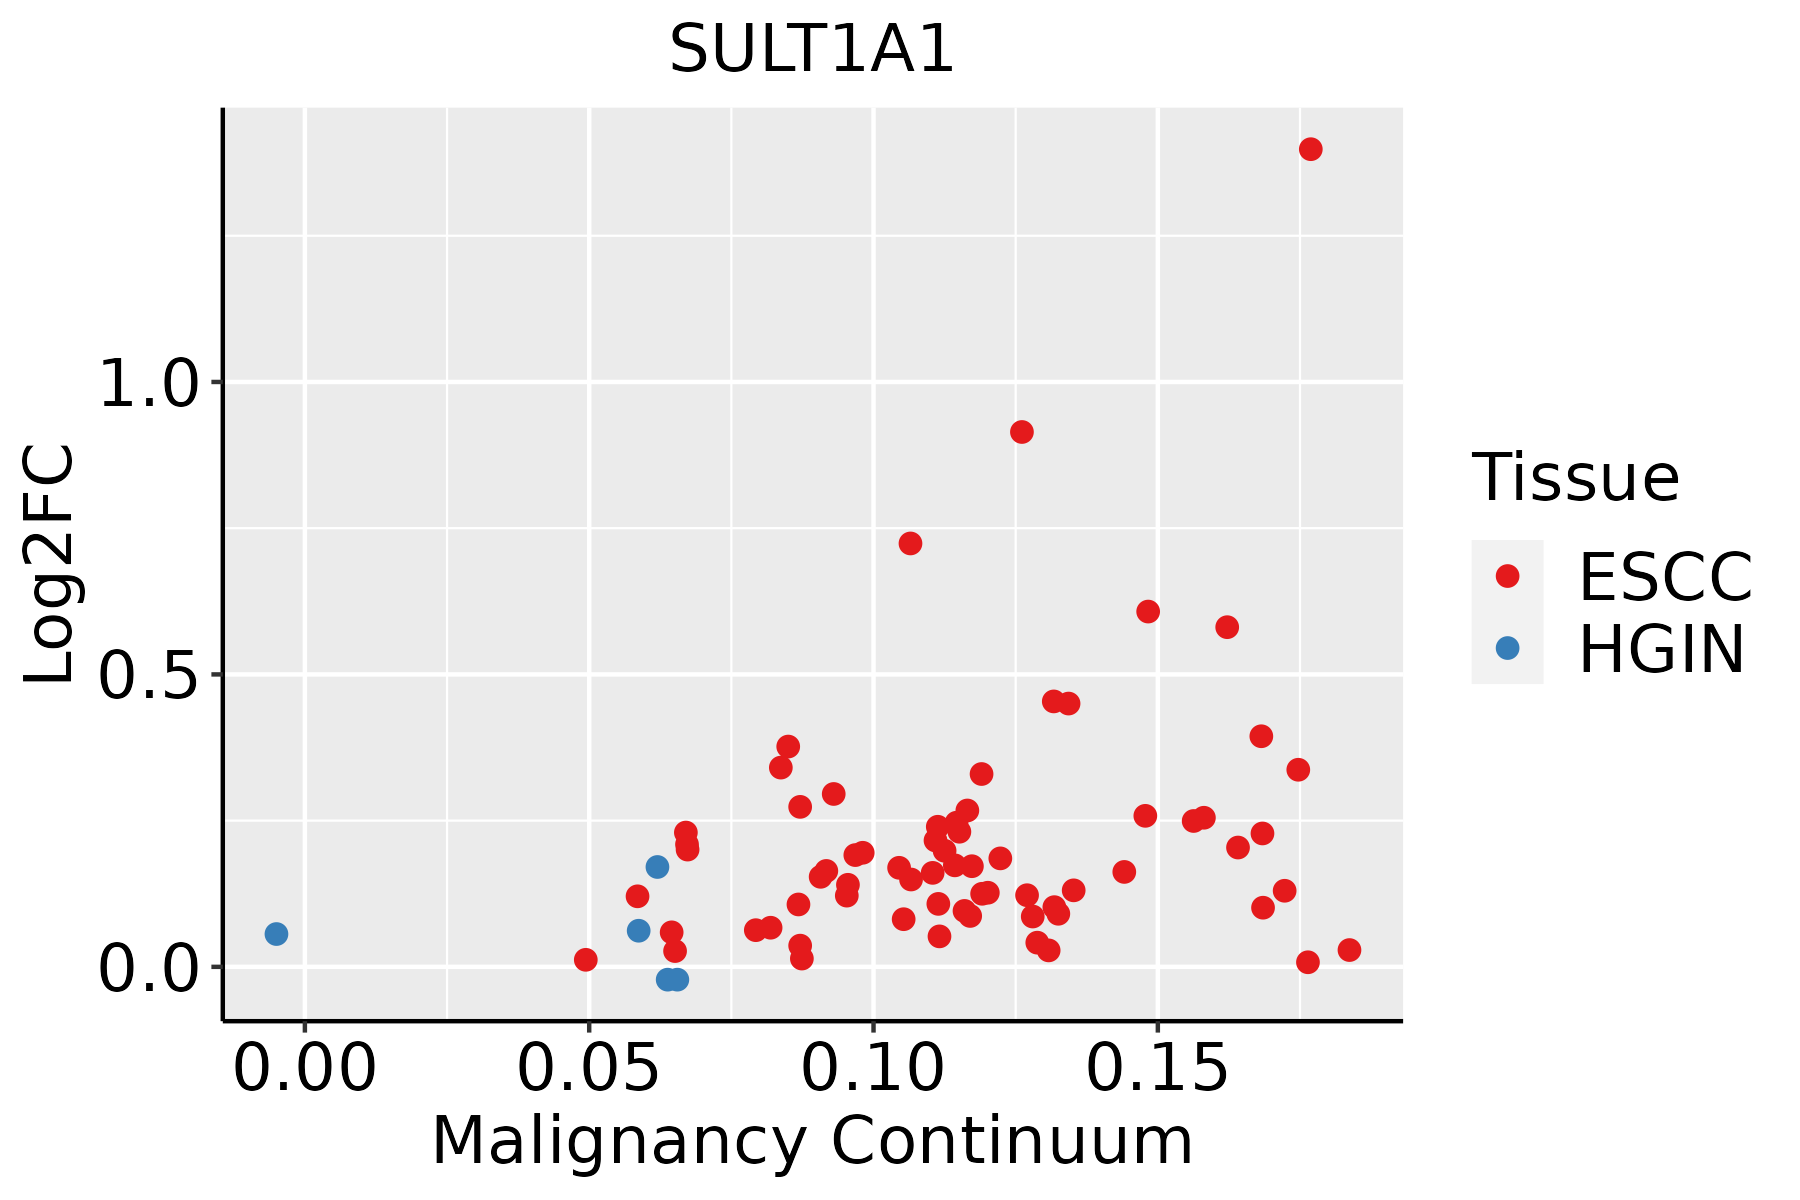 | ESCC: Esophageal squamous cell carcinoma |
| HGIN: High-grade intraepithelial neoplasias | ||
| LGIN: Low-grade intraepithelial neoplasias | ||
| GC | 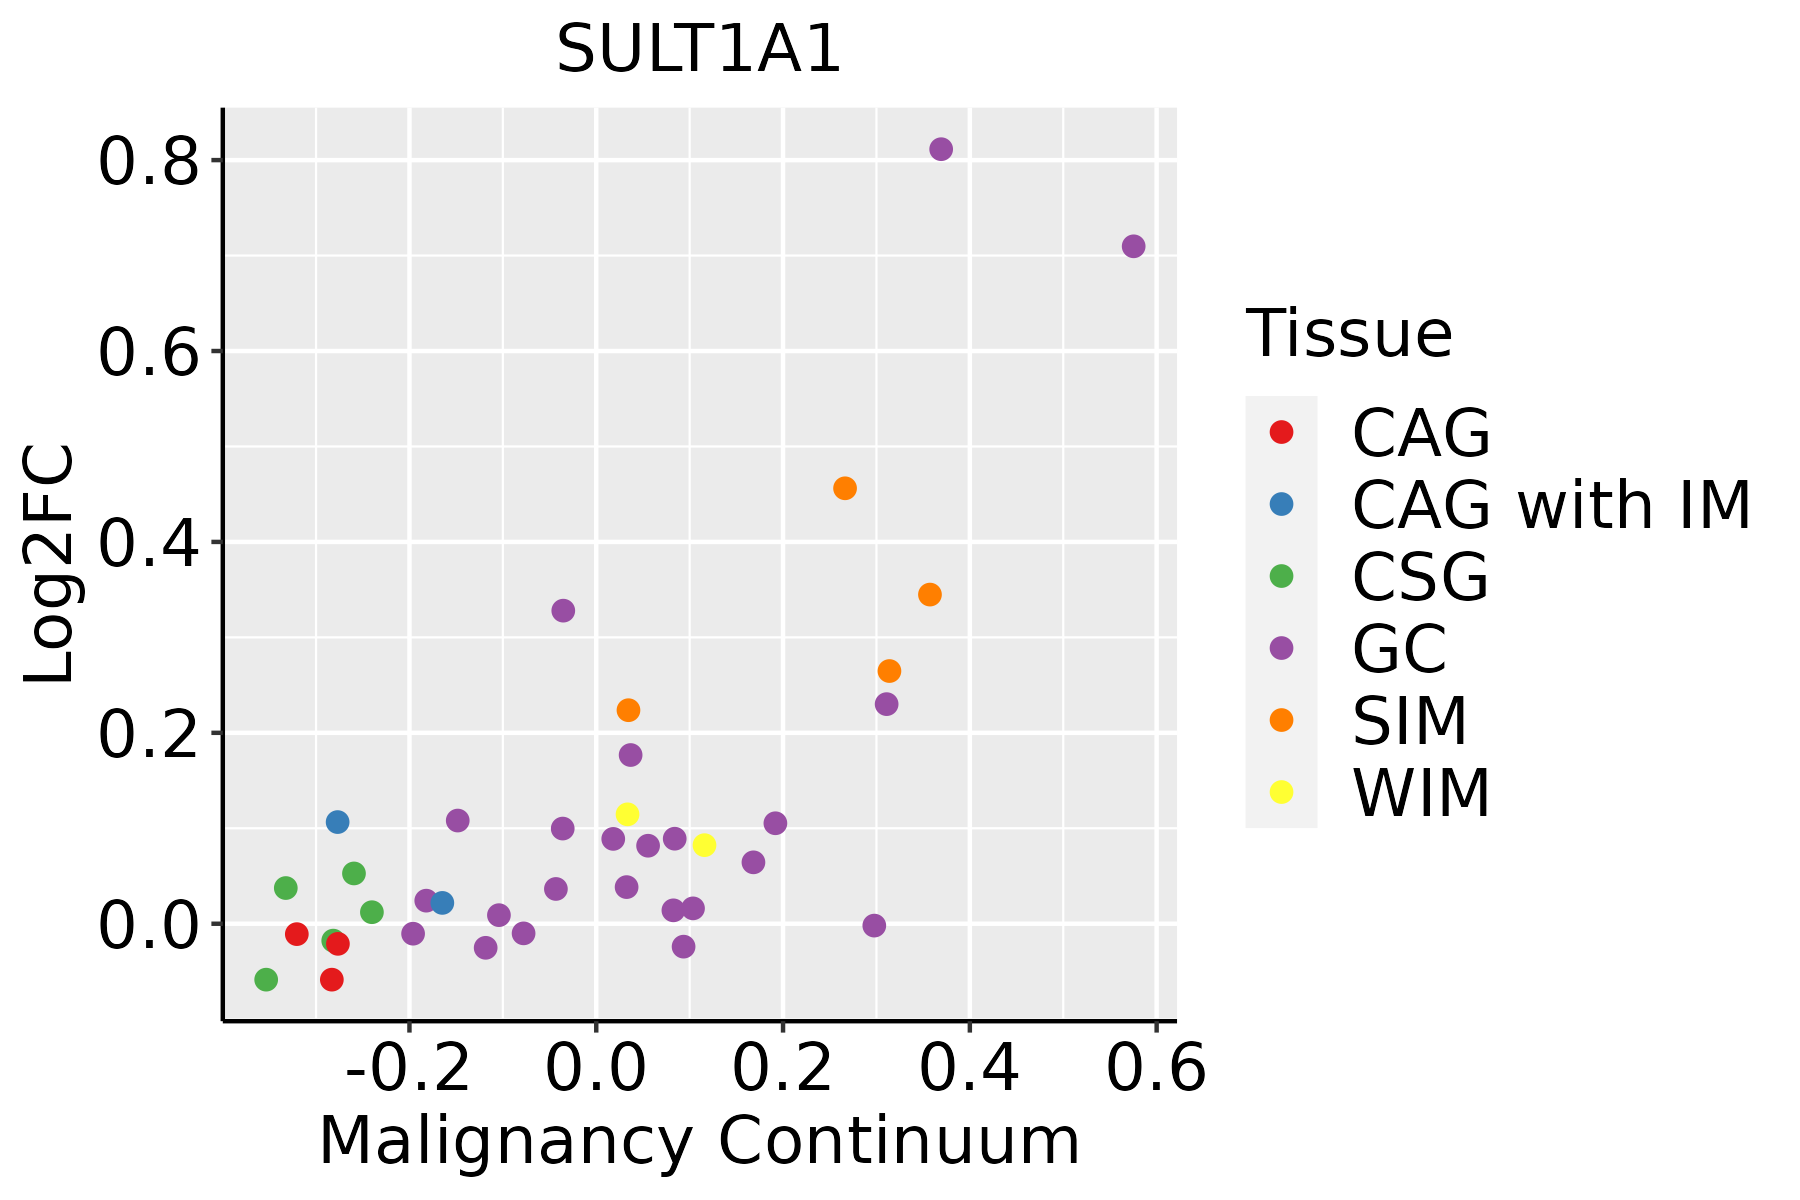 | CAG: Chronic atrophic gastritis |
| CAG with IM: Chronic atrophic gastritis with intestinal metaplasia | ||
| CSG: Chronic superficial gastritis | ||
| GC: Gastric cancer | ||
| SIM: Severe intestinal metaplasia | ||
| WIM: Wild intestinal metaplasia | ||
| Liver |  | HCC: Hepatocellular carcinoma |
| NAFLD: Non-alcoholic fatty liver disease | ||
| Oral Cavity |  | EOLP: Erosive Oral lichen planus |
| LP: leukoplakia | ||
| NEOLP: Non-erosive oral lichen planus | ||
| OSCC: Oral squamous cell carcinoma | ||
| Thyroid |  | ATC: Anaplastic thyroid cancer |
| HT: Hashimoto's thyroiditis | ||
| PTC: Papillary thyroid cancer |
| ∗log2FC in expression of this searched gene in stem-like cells from each diseased tissue sample relative to stem-like cells in normal samples in each tissue plotted against the malignancy continuum. Samples are colored based on if they are from different disease stage. |
Top |
Malignant transformation related pathway analysis |
| Find out the enriched GO biological processes and KEGG pathways involved in transition from healthy to precancer to cancer |
| Tissue | Disease Stage | Enriched GO biological Processes |
| Colorectum | AD |  |
| Colorectum | SER |  |
| Colorectum | MSS |  |
| Colorectum | MSI-H |  |
| Colorectum | FAP |  |
| ∗Top 15 enriched GO BP terms are showed in the bar plot of each disease state in each tissue. Each row represents a significant GO biological process which is colored according to the -log10(p.adjust). |
| Page: 1 2 3 4 5 6 7 8 9 |
| GO ID | Tissue | Disease Stage | Description | Gene Ratio | Bg Ratio | pvalue | p.adjust | Count |
| GO:0009150 | Colorectum | AD | purine ribonucleotide metabolic process | 142/3918 | 368/18723 | 4.29e-15 | 1.17e-12 | 142 |
| GO:0006163 | Colorectum | AD | purine nucleotide metabolic process | 149/3918 | 396/18723 | 1.08e-14 | 2.80e-12 | 149 |
| GO:0072521 | Colorectum | AD | purine-containing compound metabolic process | 153/3918 | 416/18723 | 4.34e-14 | 1.01e-11 | 153 |
| GO:0009259 | Colorectum | AD | ribonucleotide metabolic process | 144/3918 | 385/18723 | 5.25e-14 | 1.13e-11 | 144 |
| GO:0019693 | Colorectum | AD | ribose phosphate metabolic process | 145/3918 | 396/18723 | 3.01e-13 | 5.71e-11 | 145 |
| GO:0009117 | Colorectum | AD | nucleotide metabolic process | 168/3918 | 489/18723 | 2.20e-12 | 3.36e-10 | 168 |
| GO:0006753 | Colorectum | AD | nucleoside phosphate metabolic process | 169/3918 | 497/18723 | 4.99e-12 | 6.98e-10 | 169 |
| GO:0044282 | Colorectum | AD | small molecule catabolic process | 118/3918 | 376/18723 | 1.05e-06 | 3.55e-05 | 118 |
| GO:0006066 | Colorectum | AD | alcohol metabolic process | 106/3918 | 353/18723 | 3.02e-05 | 5.57e-04 | 106 |
| GO:0006790 | Colorectum | AD | sulfur compound metabolic process | 101/3918 | 339/18723 | 6.46e-05 | 1.07e-03 | 101 |
| GO:0009410 | Colorectum | AD | response to xenobiotic stimulus | 128/3918 | 462/18723 | 2.69e-04 | 3.31e-03 | 128 |
| GO:0034310 | Colorectum | AD | primary alcohol catabolic process | 9/3918 | 15/18723 | 1.11e-03 | 1.01e-02 | 9 |
| GO:0033865 | Colorectum | AD | nucleoside bisphosphate metabolic process | 42/3918 | 128/18723 | 1.12e-03 | 1.02e-02 | 42 |
| GO:0033875 | Colorectum | AD | ribonucleoside bisphosphate metabolic process | 42/3918 | 128/18723 | 1.12e-03 | 1.02e-02 | 42 |
| GO:0034032 | Colorectum | AD | purine nucleoside bisphosphate metabolic process | 42/3918 | 128/18723 | 1.12e-03 | 1.02e-02 | 42 |
| GO:0034308 | Colorectum | AD | primary alcohol metabolic process | 35/3918 | 102/18723 | 1.16e-03 | 1.05e-02 | 35 |
| GO:0006067 | Colorectum | AD | ethanol metabolic process | 11/3918 | 21/18723 | 1.43e-03 | 1.22e-02 | 11 |
| GO:0034035 | Colorectum | AD | purine ribonucleoside bisphosphate metabolic process | 11/3918 | 21/18723 | 1.43e-03 | 1.22e-02 | 11 |
| GO:0050427 | Colorectum | AD | 3'-phosphoadenosine 5'-phosphosulfate metabolic process | 11/3918 | 21/18723 | 1.43e-03 | 1.22e-02 | 11 |
| GO:0006068 | Colorectum | AD | ethanol catabolic process | 7/3918 | 12/18723 | 5.09e-03 | 3.38e-02 | 7 |
| Page: 1 2 3 4 5 6 7 8 9 |
| Pathway ID | Tissue | Disease Stage | Description | Gene Ratio | Bg Ratio | pvalue | p.adjust | qvalue | Count |
| Page: 1 |
Top |
Cell-cell communication analysis |
| Identification of potential cell-cell interactions between two cell types and their ligand-receptor pairs for different disease states |
| Ligand | Receptor | LRpair | Pathway | Tissue | Disease Stage |
| Page: 1 |
Top |
Single-cell gene regulatory network inference analysis |
| Find out the significant the regulons (TFs) and the target genes of each regulon across cell types for different disease states |
| TF | Cell Type | Tissue | Disease Stage | Target Gene | RSS | Regulon Activity |
| ∗The dot plots of a searched regulon are shown for all cell subpopulations in each disease state of each tissue based on the regulon specific score inferred using pySCENIC and by calculating the average expression. |
| Page: 1 |
Top |
Somatic mutation of malignant transformation related genes |
| Annotation of somatic variants for genes involved in malignant transformation |
| Hugo Symbol | Variant Class | Variant Classification | dbSNP RS | HGVSc | HGVSp | HGVSp Short | SWISSPROT | BIOTYPE | SIFT | PolyPhen | Tumor Sample Barcode | Tissue | Histology | Sex | Age | Stage | Therapy Types | Drugs | Outcome |
| SULT1A1 | SNV | Missense_Mutation | c.699N>C | p.Lys233Asn | p.K233N | P50225 | protein_coding | deleterious(0) | probably_damaging(0.952) | TCGA-AC-A23H-01 | Breast | breast invasive carcinoma | Female | >=65 | I/II | Unknown | Unknown | PD | |
| SULT1A1 | SNV | Missense_Mutation | novel | c.149G>A | p.Gly50Asp | p.G50D | P50225 | protein_coding | deleterious(0) | probably_damaging(1) | TCGA-OL-A66L-01 | Breast | breast invasive carcinoma | Female | >=65 | I/II | Unknown | Unknown | SD |
| SULT1A1 | insertion | In_Frame_Ins | novel | c.178_179insAGGTCAAGGTGAGGCAGGGCACAG | p.Met60delinsLysValLysValArgGlnGlyThrVal | p.M60delinsKVKVRQGTV | P50225 | protein_coding | TCGA-AN-A0FN-01 | Breast | breast invasive carcinoma | Female | <65 | I/II | Unknown | Unknown | SD | ||
| SULT1A1 | SNV | Missense_Mutation | rs764663532 | c.833C>T | p.Ala278Val | p.A278V | P50225 | protein_coding | tolerated(0.15) | benign(0.001) | TCGA-2W-A8YY-01 | Cervix | cervical & endocervical cancer | Female | <65 | I/II | Chemotherapy | cisplatin | CR |
| SULT1A1 | SNV | Missense_Mutation | rs72547527 | c.110N>A | p.Arg37Gln | p.R37Q | P50225 | protein_coding | tolerated(0.09) | benign(0.014) | TCGA-IR-A3LA-01 | Cervix | cervical & endocervical cancer | Female | <65 | I/II | Chemotherapy | cisplatin | CR |
| SULT1A1 | SNV | Missense_Mutation | c.220N>G | p.Pro74Ala | p.P74A | P50225 | protein_coding | tolerated(0.63) | benign(0.013) | TCGA-R2-A69V-01 | Cervix | cervical & endocervical cancer | Female | <65 | I/II | Chemotherapy | cisplatin | SD | |
| SULT1A1 | SNV | Missense_Mutation | rs201320226 | c.232N>T | p.Arg78Trp | p.R78W | P50225 | protein_coding | deleterious(0) | probably_damaging(1) | TCGA-AA-3672-01 | Colorectum | colon adenocarcinoma | Female | >=65 | III/IV | Unknown | Unknown | SD |
| SULT1A1 | SNV | Missense_Mutation | rs767993186 | c.812C>T | p.Ala271Val | p.A271V | P50225 | protein_coding | deleterious(0.03) | possibly_damaging(0.491) | TCGA-CK-4951-01 | Colorectum | colon adenocarcinoma | Female | >=65 | I/II | Unknown | Unknown | PD |
| SULT1A1 | SNV | Missense_Mutation | novel | c.637N>T | p.Arg213Cys | p.R213C | P50225 | protein_coding | tolerated(0.07) | benign(0.179) | TCGA-A5-A0G2-01 | Endometrium | uterine corpus endometrioid carcinoma | Female | <65 | III/IV | Unknown | Unknown | SD |
| SULT1A1 | SNV | Missense_Mutation | rs771144668 | c.508G>A | p.Gly170Arg | p.G170R | P50225 | protein_coding | deleterious(0.02) | probably_damaging(0.995) | TCGA-AJ-A3BG-01 | Endometrium | uterine corpus endometrioid carcinoma | Female | >=65 | I/II | Chemotherapy | carboplatin | PD |
| Page: 1 2 3 |
Top |
Related drugs of malignant transformation related genes |
| Identification of chemicals and drugs interact with genes involved in malignant transfromation |
| (DGIdb 4.0) |
| Entrez ID | Symbol | Category | Interaction Types | Drug Claim Name | Drug Name | PMIDs |
| 6817 | SULT1A1 | DRUGGABLE GENOME, ENZYME | acetaminophen | ACETAMINOPHEN | 30908574,23462933,26049587,6957279 | |
| 6817 | SULT1A1 | DRUGGABLE GENOME, ENZYME | minoxidil | MINOXIDIL | 2390100 | |
| 6817 | SULT1A1 | DRUGGABLE GENOME, ENZYME | desmethylnaproxen | |||
| 6817 | SULT1A1 | DRUGGABLE GENOME, ENZYME | tapentadol | TAPENTADOL | ||
| 6817 | SULT1A1 | DRUGGABLE GENOME, ENZYME | estrogens | ESTRONE SODIUM SULFATE | 11062153,11906176,12034366,9068609 | |
| 6817 | SULT1A1 | DRUGGABLE GENOME, ENZYME | conjugated estrogens | 16985250 |
| Page: 1 |

Copyright 2023-Present -The University of Texas Health Science Center at Houston |