Schematic overview of the cellular and molecular mechanisms involved in the cancer progression, including the proposed cellular and molecular mechanisms in cancer cells trajectory. AT1: alveolar type 1 cells; AT2: alveolar type 2 cells; AAH: atypical adenomatous hyperplasia; AIS: adenocarcinoma in situ; MIA: minimally invasive adenocarcinoma; IA: invasive adenocarcinoma; EMT: epithelial-mesenchymal transition

Home

Download

Statistics

Help

Contact

Center for Computational Systems Medicine
leaf

Gene summary

leaf

Malignant transformation analysis

leaf

Malignant transformation related pathway analysis

leaf

Cell-cell communication analysis

leaf

Single-cell gene regulatory network inference analysis

leaf

Somatic mutation of malignant transformation related genes

leaf

Related drugs of malignant transformation related genes

Gene: SULF1

Gene summary for SULF1

check button Gene summary.

Gene informationSpeciesHuman
Gene symbol

SULF1

Gene ID

23213

Gene namesulfatase 1
Gene AliasSULF-1
Cytomap8q13.2-q13.3
Gene Typeprotein-coding
GO ID

GO:0000003

UniProtAcc

A0A024R809


Top

Malignant transformation analysis

check button Identification of the aberrant gene expression in precancerous and cancerous lesions by comparing the gene expression of stem-like cells in diseased tissues with normal stem cells
check button Malignant transformation involving gene list.
Entrez IDSymbolReplicatesSpeciesOrganTissueAdj P-valueLog2FCMalignancy
23213SULF1P5T-EHumanEsophagusESCC5.50e-128.80e-010.1327
23213SULF1P8T-EHumanEsophagusESCC4.26e-123.53e-010.0889
23213SULF1P9T-EHumanEsophagusESCC4.33e-077.88e-010.1131
23213SULF1P10T-EHumanEsophagusESCC1.63e-054.11e-010.116
23213SULF1P12T-EHumanEsophagusESCC7.88e-297.95e-010.1122
23213SULF1P15T-EHumanEsophagusESCC4.99e-137.28e-010.1149
23213SULF1P23T-EHumanEsophagusESCC2.71e-024.23e-010.108
23213SULF1P26T-EHumanEsophagusESCC2.58e-156.21e-010.1276
23213SULF1P27T-EHumanEsophagusESCC3.52e-113.92e-010.1055
23213SULF1P30T-EHumanEsophagusESCC2.71e-098.09e-010.137
23213SULF1P32T-EHumanEsophagusESCC7.52e-074.92e-010.1666
23213SULF1P40T-EHumanEsophagusESCC1.75e-033.79e-010.109
23213SULF1P44T-EHumanEsophagusESCC1.05e-031.20e+000.1096
23213SULF1P47T-EHumanEsophagusESCC2.97e-037.23e-010.1067
23213SULF1P48T-EHumanEsophagusESCC3.10e-082.92e-010.0959
23213SULF1P54T-EHumanEsophagusESCC1.35e-115.74e-010.0975
23213SULF1P62T-EHumanEsophagusESCC3.59e-091.35e-010.1302
23213SULF1P74T-EHumanEsophagusESCC1.90e-207.63e-010.1479
23213SULF1P76T-EHumanEsophagusESCC2.25e-032.67e-010.1207
23213SULF1RNA-P17T-P17T-2HumanLungIAC1.69e-069.03e-010.3371
Page: 1 2 3 

check button Transcriptomic changes along malignancy continuum.
TissueExpression DynamicsAbbreviation
EndometriumThe image shows the transcriptomic changes along malignancy continuum.log2FC in expression of this searched gene in stem-like cells from each diseased tissue sample relative to stem-like cells in normal samples in each tissue plotted against the malignancy continuum. Samples are colored based on if they are from different disease stage.AEH: Atypical endometrial hyperplasia
EEC: Endometrioid Cancer
EsophagusThe image shows the transcriptomic changes along malignancy continuum.log2FC in expression of this searched gene in stem-like cells from each diseased tissue sample relative to stem-like cells in normal samples in each tissue plotted against the malignancy continuum. Samples are colored based on if they are from different disease stage.ESCC: Esophageal squamous cell carcinoma
HGIN: High-grade intraepithelial neoplasias
LGIN: Low-grade intraepithelial neoplasias
LungThe image shows the transcriptomic changes along malignancy continuum.log2FC in expression of this searched gene in stem-like cells from each diseased tissue sample relative to stem-like cells in normal samples in each tissue plotted against the malignancy continuum. Samples are colored based on if they are from different disease stage.
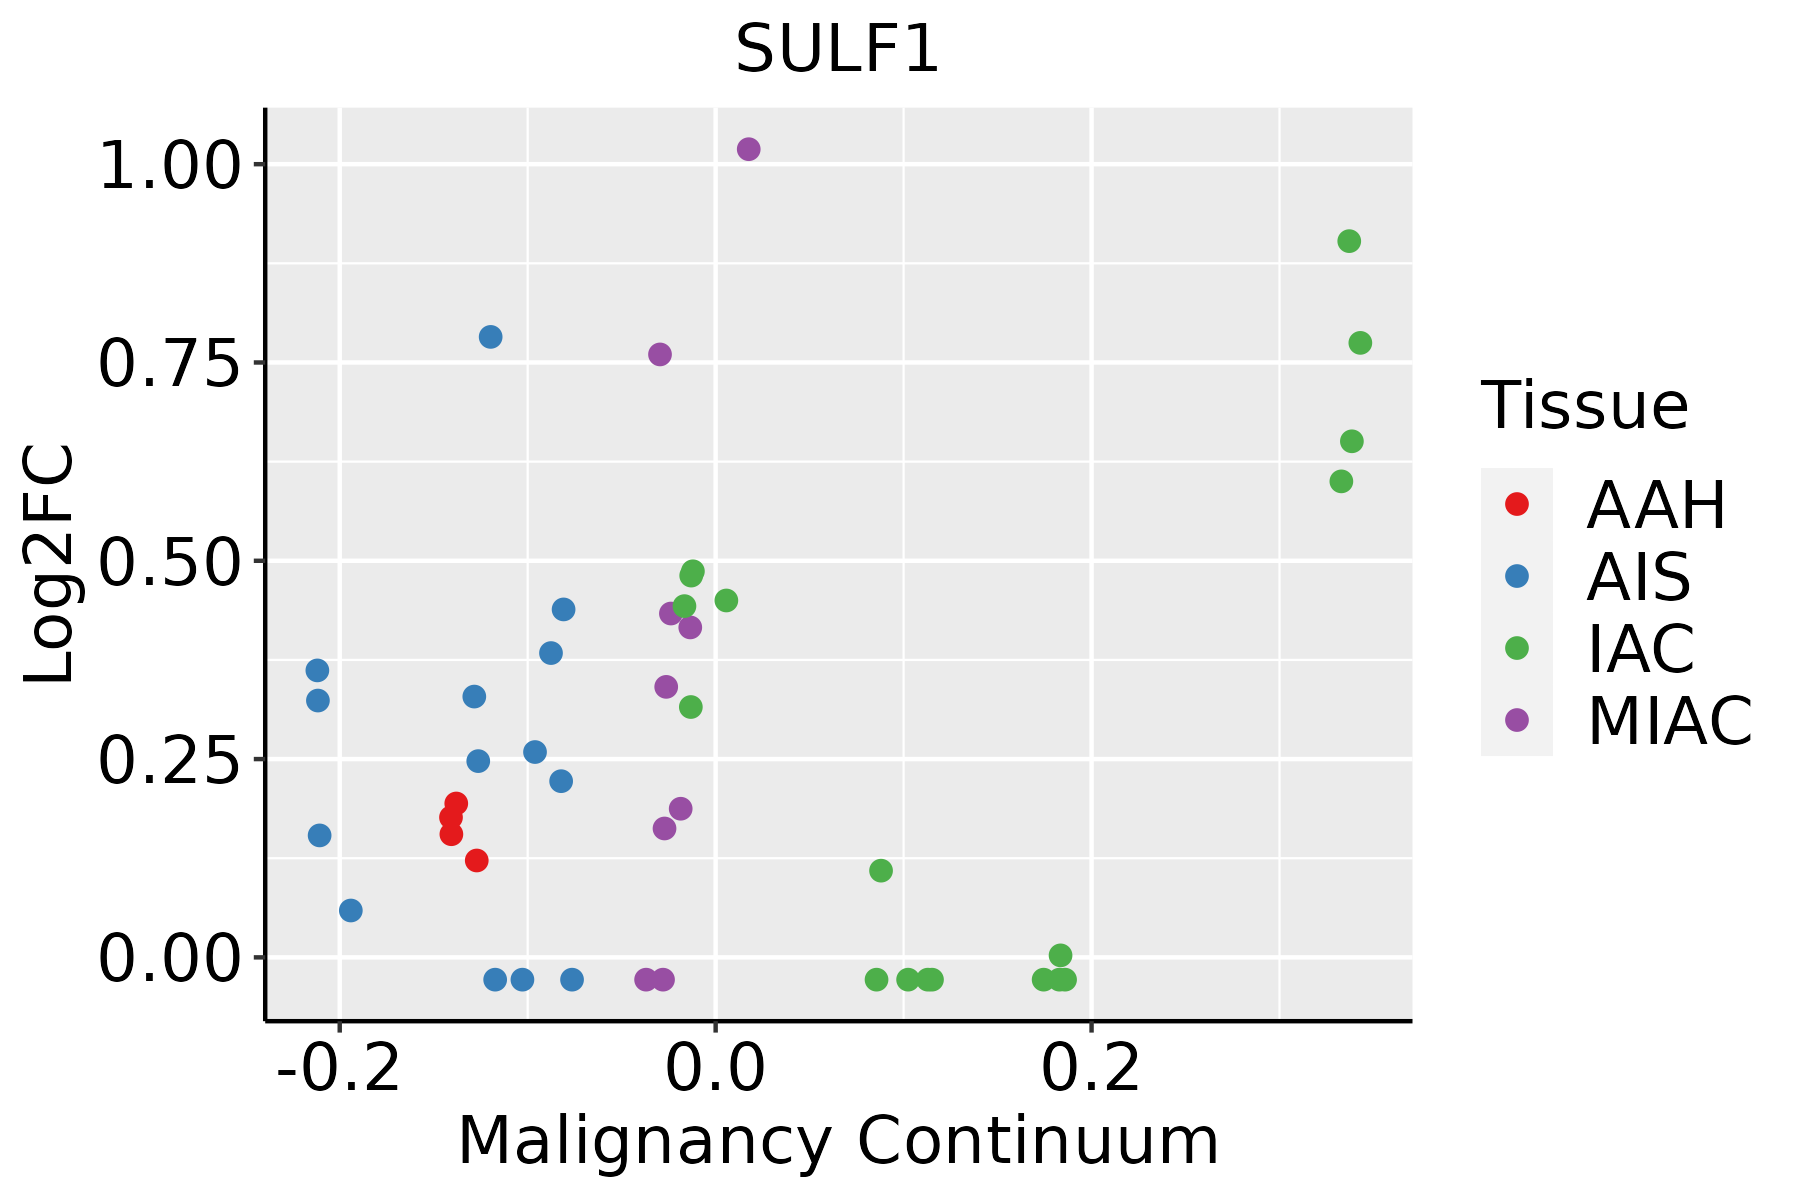
AAH: Atypical adenomatous hyperplasia
AIS: Adenocarcinoma in situ
IAC: Invasive lung adenocarcinoma
MIA: Minimally invasive adenocarcinoma
ProstateThe image shows the transcriptomic changes along malignancy continuum.log2FC in expression of this searched gene in stem-like cells from each diseased tissue sample relative to stem-like cells in normal samples in each tissue plotted against the malignancy continuum. Samples are colored based on if they are from different disease stage.
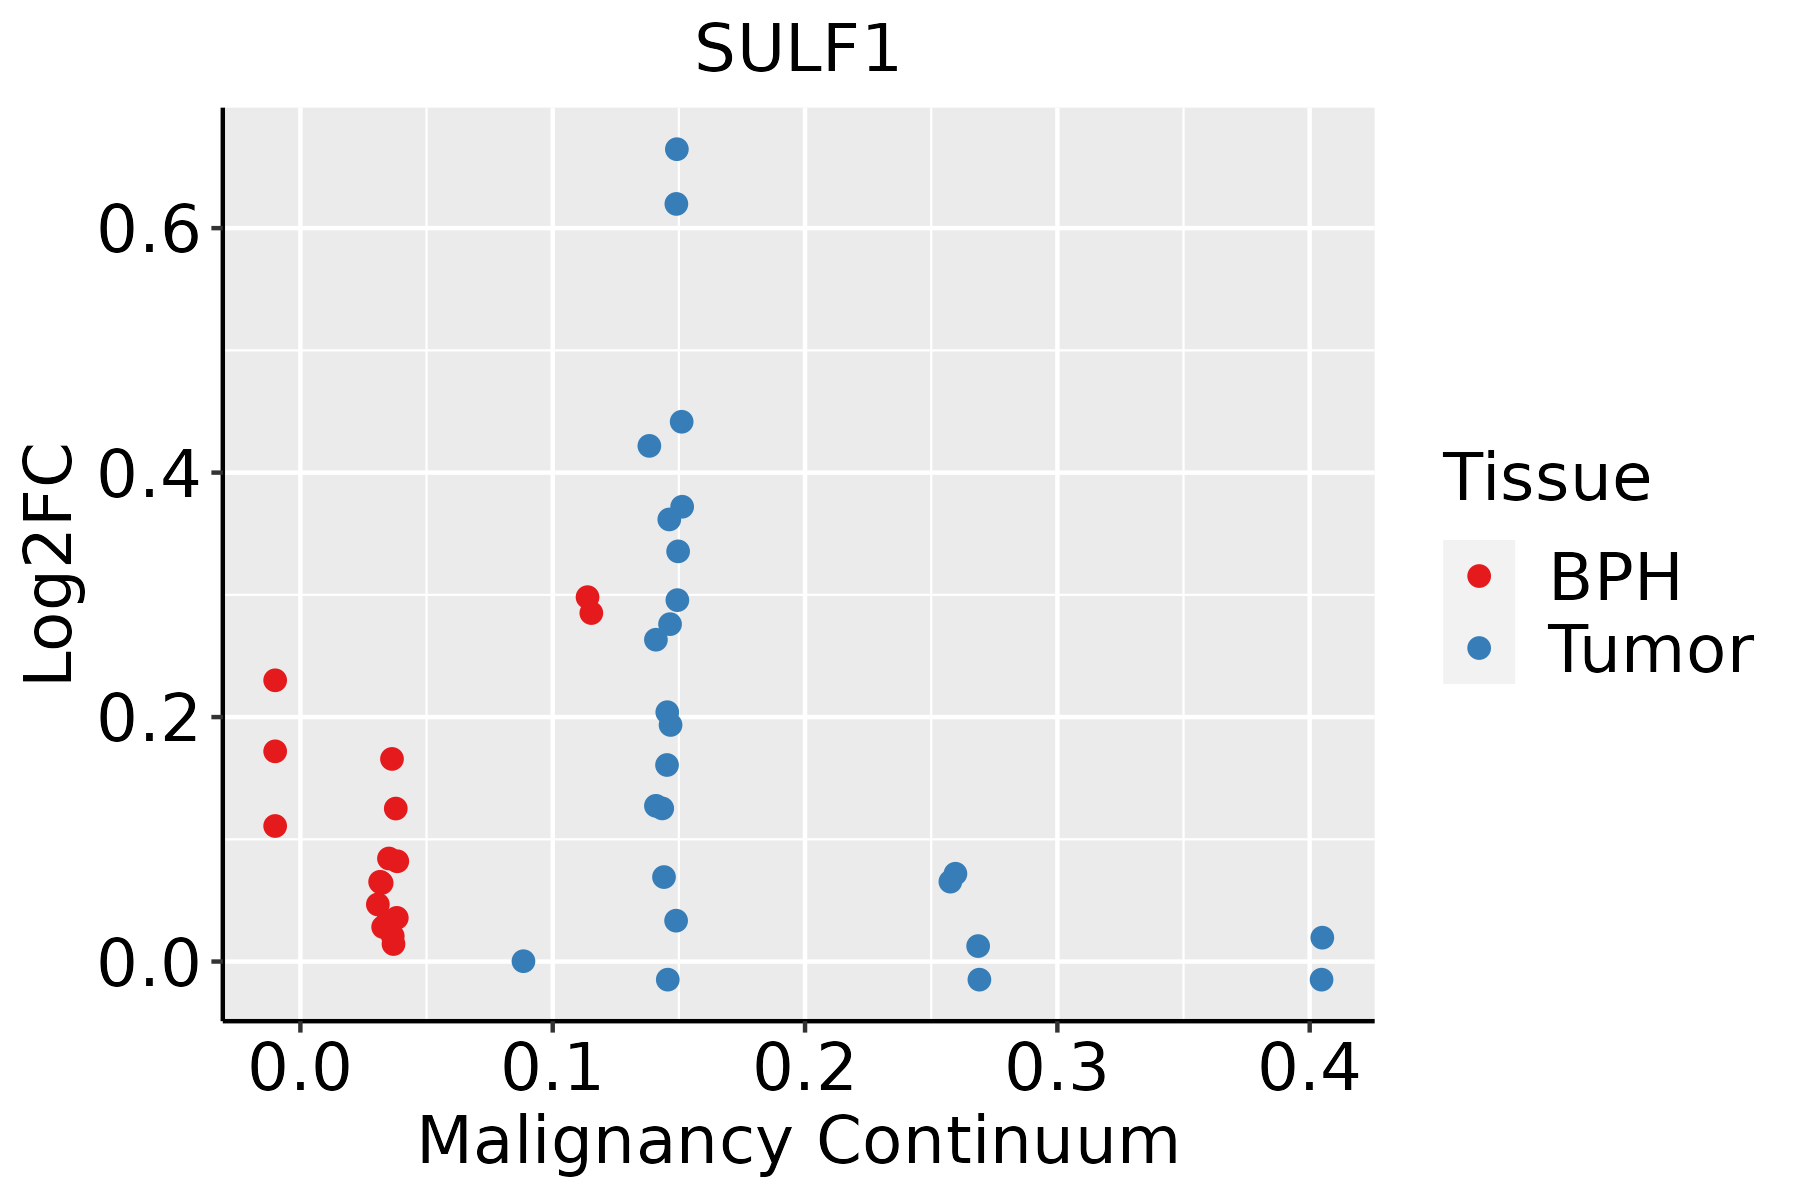
BPH: Benign Prostatic Hyperplasia
ThyroidThe image shows the transcriptomic changes along malignancy continuum.log2FC in expression of this searched gene in stem-like cells from each diseased tissue sample relative to stem-like cells in normal samples in each tissue plotted against the malignancy continuum. Samples are colored based on if they are from different disease stage.
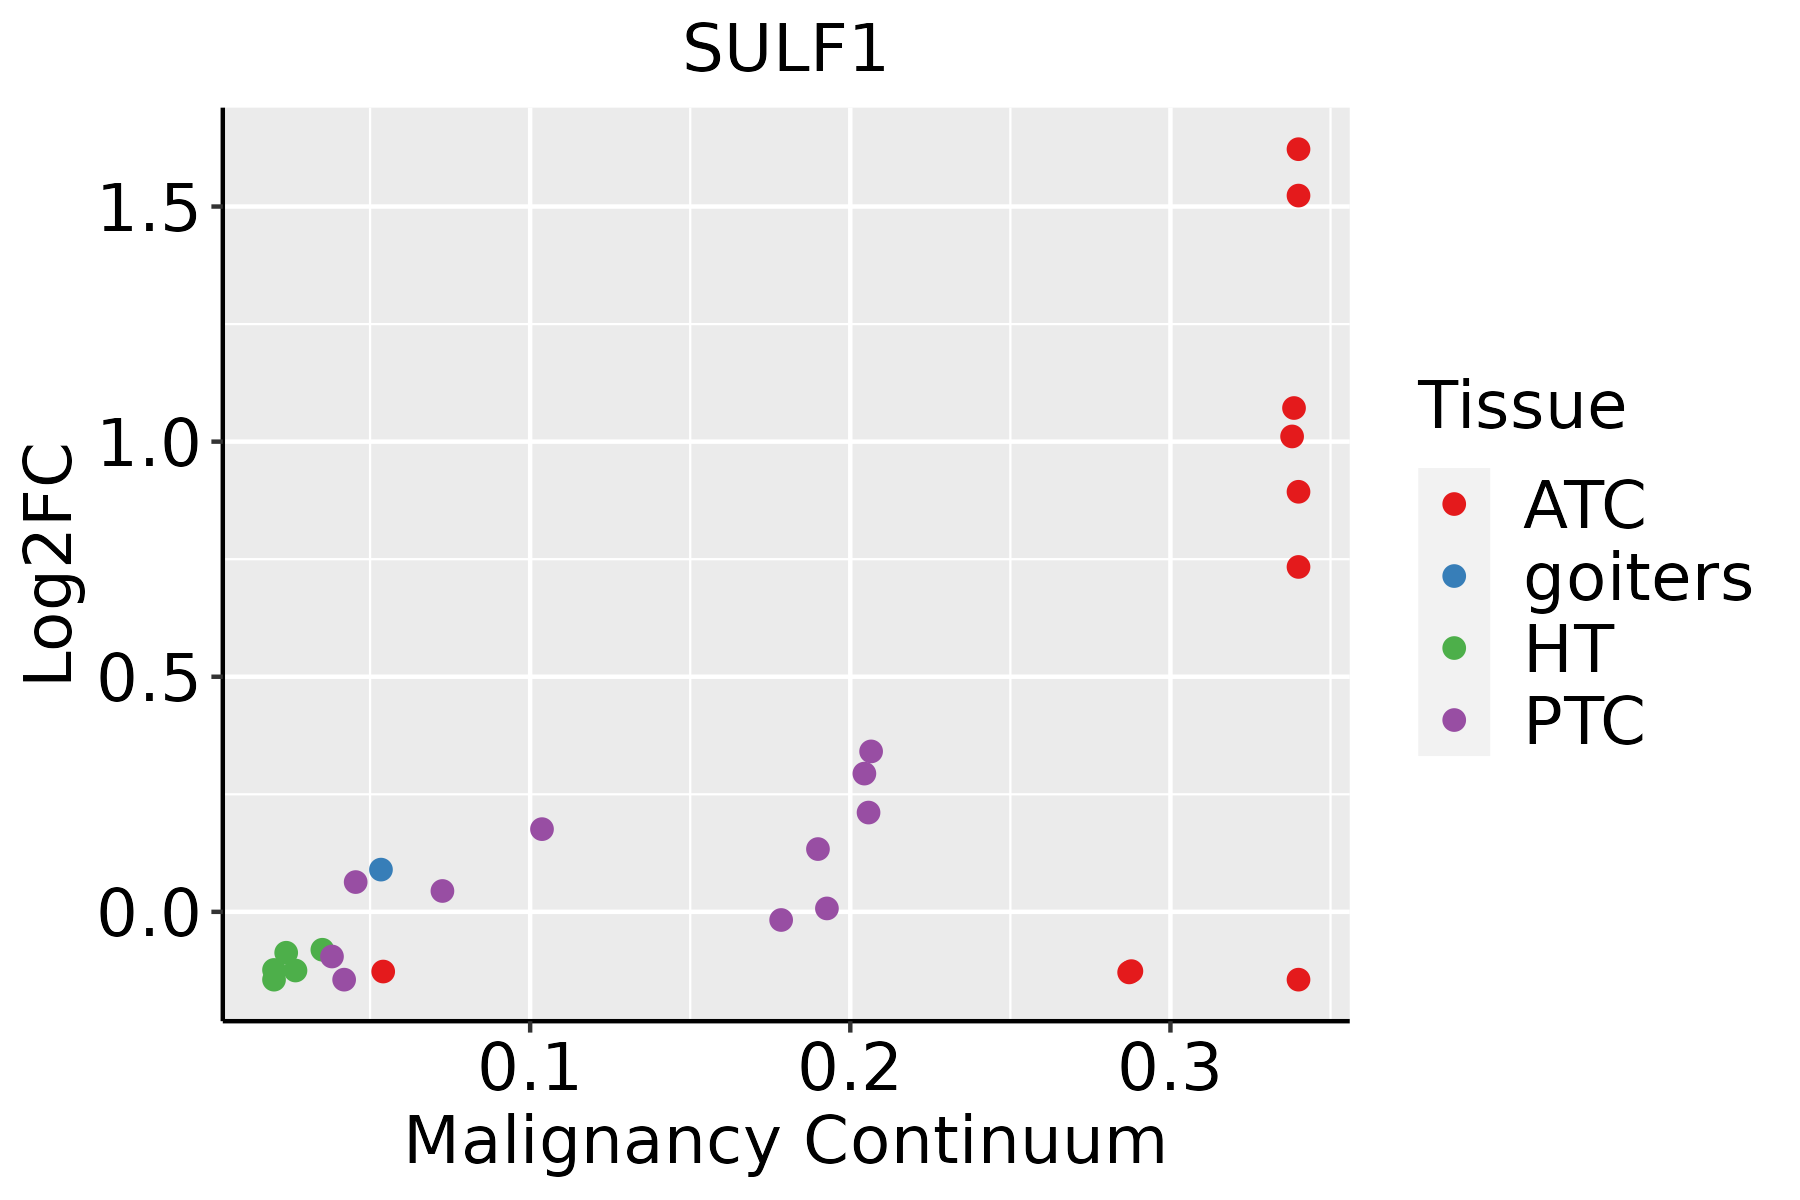
ATC: Anaplastic thyroid cancer
HT: Hashimoto's thyroiditis
PTC: Papillary thyroid cancer
∗log2FC in expression of this searched gene in stem-like cells from each diseased tissue sample relative to stem-like cells in normal samples in each tissue plotted against the malignancy continuum. Samples are colored based on if they are from different disease stage.

Top

Malignant transformation related pathway analysis

check buttonFind out the enriched GO biological processes and KEGG pathways involved in transition from healthy to precancer to cancer
check button Figure of enriched GO biological processes.
TissueDisease StageEnriched GO biological Processes
ColorectumADGO analysis - Figure of enriched GO biological processes: Top 15 enriched GO BP terms are showed in the bar plot of each disease state in each tissue. Each row represents a significant GO biological process which is colored according to the -log10(p.adjust).
ColorectumSERGO analysis - Figure of enriched GO biological processes: Top 15 enriched GO BP terms are showed in the bar plot of each disease state in each tissue. Each row represents a significant GO biological process which is colored according to the -log10(p.adjust).
ColorectumMSSGO analysis - Figure of enriched GO biological processes: Top 15 enriched GO BP terms are showed in the bar plot of each disease state in each tissue. Each row represents a significant GO biological process which is colored according to the -log10(p.adjust).
ColorectumMSI-HGO analysis - Figure of enriched GO biological processes: Top 15 enriched GO BP terms are showed in the bar plot of each disease state in each tissue. Each row represents a significant GO biological process which is colored according to the -log10(p.adjust).
ColorectumFAPGO analysis - Figure of enriched GO biological processes: Top 15 enriched GO BP terms are showed in the bar plot of each disease state in each tissue. Each row represents a significant GO biological process which is colored according to the -log10(p.adjust).
∗Top 15 enriched GO BP terms are showed in the bar plot of each disease state in each tissue. Each row represents a significant GO biological process which is colored according to the -log10(p.adjust).
Page: 1 2 3 4 5 6 7 8 9 

check button Enriched GO biological processes.
GO IDTissueDisease StageDescriptionGene RatioBg Ratiopvaluep.adjustCount
GO:0048732111EsophagusESCCgland development269/8552436/187237.81e-122.95e-10269
GO:001605517EsophagusESCCWnt signaling pathway268/8552444/187232.32e-106.58e-09268
GO:019873817EsophagusESCCcell-cell signaling by wnt269/8552446/187232.41e-106.79e-09269
GO:00163316EsophagusESCCmorphogenesis of embryonic epithelium98/8552147/187232.12e-073.27e-0698
GO:0061458110EsophagusESCCreproductive system development247/8552427/187232.24e-073.42e-06247
GO:00091002EsophagusESCCglycoprotein metabolic process226/8552387/187232.64e-073.94e-06226
GO:004860818EsophagusESCCreproductive structure development245/8552424/187232.82e-074.14e-06245
GO:003011117EsophagusESCCregulation of Wnt signaling pathway194/8552328/187235.39e-077.14e-06194
GO:002261216EsophagusESCCgland morphogenesis78/8552118/187235.83e-066.03e-0578
GO:00301984EsophagusESCCextracellular matrix organization171/8552301/187236.08e-054.67e-04171
GO:003017716EsophagusESCCpositive regulation of Wnt signaling pathway87/8552140/187236.18e-054.73e-0487
GO:00430624EsophagusESCCextracellular structure organization171/8552302/187237.73e-055.76e-04171
GO:00452294EsophagusESCCexternal encapsulating structure organization172/8552304/187237.80e-055.80e-04172
GO:005067318EsophagusESCCepithelial cell proliferation238/8552437/187231.19e-048.20e-04238
GO:000717810EsophagusESCCtransmembrane receptor protein serine/threonine kinase signaling pathway195/8552355/187232.58e-041.58e-03195
GO:00308506EsophagusESCCprostate gland development32/855245/187234.87e-042.70e-0332
GO:005067817EsophagusESCCregulation of epithelial cell proliferation206/8552381/187235.51e-043.02e-03206
GO:00603485EsophagusESCCbone development115/8552205/187231.67e-037.72e-03115
GO:000181916EsophagusESCCpositive regulation of cytokine production244/8552467/187232.29e-031.01e-02244
GO:0006029EsophagusESCCproteoglycan metabolic process48/855279/187234.93e-031.89e-0248
Page: 1 2 3 4 5 6 7 8 9 10 11 12 

check button Enriched KEGG pathways.
Pathway IDTissueDisease StageDescriptionGene RatioBg Ratiopvaluep.adjustqvalueCount
Page: 1 

Top

Cell-cell communication analysis

check buttonIdentification of potential cell-cell interactions between two cell types and their ligand-receptor pairs for different disease states
LigandReceptorLRpairPathwayTissueDisease Stage
Page: 1 

Top

Single-cell gene regulatory network inference analysis

check buttonFind out the significant the regulons (TFs) and the target genes of each regulon across cell types for different disease states
TFCell TypeTissueDisease StageTarget GeneRSSRegulon Activity
∗The dot plots of a searched regulon are shown for all cell subpopulations in each disease state of each tissue based on the regulon specific score inferred using pySCENIC and by calculating the average expression.
Page: 1 

Top

Somatic mutation of malignant transformation related genes

check buttonAnnotation of somatic variants for genes involved in malignant transformation
Hugo SymbolVariant ClassVariant ClassificationdbSNP RSHGVScHGVSpHGVSp ShortSWISSPROTBIOTYPESIFTPolyPhenTumor Sample BarcodeTissueHistologySexAgeStageTherapy TypesDrugsOutcome
SULF1SNVMissense_Mutationc.1681N>Ap.Glu561Lysp.E561KQ8IWU6protein_codingtolerated(0.3)benign(0.32)TCGA-A2-A0CX-01Breastbreast invasive carcinomaFemale<65I/IIChemotherapyadriamycinSD
SULF1SNVMissense_Mutationc.1457N>Ap.Arg486Glnp.R486QQ8IWU6protein_codingtolerated(0.14)benign(0.221)TCGA-AC-A23H-01Breastbreast invasive carcinomaFemale>=65I/IIUnknownUnknownPD
SULF1SNVMissense_Mutationc.2291N>Ap.Ser764Tyrp.S764YQ8IWU6protein_codingdeleterious(0)possibly_damaging(0.641)TCGA-AR-A0TY-01Breastbreast invasive carcinomaFemale<65I/IIUnspecificPaclitaxelPD
SULF1SNVMissense_Mutationc.2157C>Ap.Asn719Lysp.N719KQ8IWU6protein_codingtolerated(0.85)benign(0.007)TCGA-C8-A133-01Breastbreast invasive carcinomaFemale>=65III/IVUnknownUnknownSD
SULF1SNVMissense_Mutationc.436N>Ap.Glu146Lysp.E146KQ8IWU6protein_codingtolerated(0.08)possibly_damaging(0.557)TCGA-E9-A1R4-01Breastbreast invasive carcinomaFemale>=65I/IIChemotherapy5-fluorouracilSD
SULF1insertionIn_Frame_Insnovelc.1468_1469insACGGGCTTGAAGGATp.Arg490delinsHisGlyLeuGluGlyTrpp.R490delinsHGLEGWQ8IWU6protein_codingTCGA-AN-A0AL-01Breastbreast invasive carcinomaFemale<65III/IVUnknownUnknownSD
SULF1insertionFrame_Shift_Insnovelc.320_321insGp.Asn108GlnfsTer15p.N108Qfs*15Q8IWU6protein_codingTCGA-AN-A0FD-01Breastbreast invasive carcinomaFemale>=65I/IIUnknownUnknownSD
SULF1insertionFrame_Shift_Insnovelc.321_322insTGCACTTTGCTp.Asn108CysfsTer59p.N108Cfs*59Q8IWU6protein_codingTCGA-AN-A0FD-01Breastbreast invasive carcinomaFemale>=65I/IIUnknownUnknownSD
SULF1SNVMissense_Mutationnovelc.380N>Tp.Ala127Valp.A127VQ8IWU6protein_codingdeleterious(0)benign(0.18)TCGA-2W-A8YY-01Cervixcervical & endocervical cancerFemale<65I/IIChemotherapycisplatinCR
SULF1SNVMissense_Mutationc.2575N>Ap.Asp859Asnp.D859NQ8IWU6protein_codingtolerated_low_confidence(0.16)benign(0.138)TCGA-EK-A2IP-01Cervixcervical & endocervical cancerFemale<65I/IIUnknownUnknownSD
Page: 1 2 3 4 5 6 7 8 9 10 11 12 13 14 15 16 17 18 19 

Top

Related drugs of malignant transformation related genes

check buttonIdentification of chemicals and drugs interact with genes involved in malignant transfromation
(DGIdb 4.0)
Entrez IDSymbolCategoryInteraction TypesDrug Claim NameDrug NamePMIDs
Page: 1