
|
|||||
|
 | |
| |
| |
| |
| |
| |
|
Gene: SUGT1 |
Gene summary for SUGT1 |
| Gene information | Species | Human | Gene symbol | SUGT1 | Gene ID | 10910 |
| Gene name | SGT1 homolog, MIS12 kinetochore complex assembly cochaperone | |
| Gene Alias | SGT1 | |
| Cytomap | 13q14.3 | |
| Gene Type | protein-coding | GO ID | GO:0000278 | UniProtAcc | A8K7W3 |
Top |
Malignant transformation analysis |
| Identification of the aberrant gene expression in precancerous and cancerous lesions by comparing the gene expression of stem-like cells in diseased tissues with normal stem cells |
| Entrez ID | Symbol | Replicates | Species | Organ | Tissue | Adj P-value | Log2FC | Malignancy |
| 10910 | SUGT1 | LZE3D | Human | Esophagus | HGIN | 4.05e-03 | 3.89e-01 | 0.0668 |
| 10910 | SUGT1 | LZE4T | Human | Esophagus | ESCC | 1.28e-14 | 4.78e-01 | 0.0811 |
| 10910 | SUGT1 | LZE5T | Human | Esophagus | ESCC | 1.15e-03 | 4.99e-01 | 0.0514 |
| 10910 | SUGT1 | LZE7T | Human | Esophagus | ESCC | 8.14e-08 | 2.19e-01 | 0.0667 |
| 10910 | SUGT1 | LZE8T | Human | Esophagus | ESCC | 1.19e-11 | 3.81e-01 | 0.067 |
| 10910 | SUGT1 | LZE20T | Human | Esophagus | ESCC | 1.04e-02 | 1.75e-01 | 0.0662 |
| 10910 | SUGT1 | LZE22D1 | Human | Esophagus | HGIN | 5.20e-04 | 1.30e-01 | 0.0595 |
| 10910 | SUGT1 | LZE22T | Human | Esophagus | ESCC | 6.34e-08 | 6.78e-01 | 0.068 |
| 10910 | SUGT1 | LZE24T | Human | Esophagus | ESCC | 1.32e-15 | 3.76e-01 | 0.0596 |
| 10910 | SUGT1 | LZE6T | Human | Esophagus | ESCC | 1.21e-08 | 2.55e-01 | 0.0845 |
| 10910 | SUGT1 | P1T-E | Human | Esophagus | ESCC | 6.72e-12 | 6.05e-01 | 0.0875 |
| 10910 | SUGT1 | P2T-E | Human | Esophagus | ESCC | 8.57e-39 | 7.57e-01 | 0.1177 |
| 10910 | SUGT1 | P4T-E | Human | Esophagus | ESCC | 1.14e-49 | 1.17e+00 | 0.1323 |
| 10910 | SUGT1 | P5T-E | Human | Esophagus | ESCC | 1.43e-21 | 4.65e-01 | 0.1327 |
| 10910 | SUGT1 | P8T-E | Human | Esophagus | ESCC | 2.91e-52 | 9.74e-01 | 0.0889 |
| 10910 | SUGT1 | P9T-E | Human | Esophagus | ESCC | 5.14e-35 | 7.47e-01 | 0.1131 |
| 10910 | SUGT1 | P10T-E | Human | Esophagus | ESCC | 4.91e-71 | 1.22e+00 | 0.116 |
| 10910 | SUGT1 | P11T-E | Human | Esophagus | ESCC | 4.90e-14 | 5.61e-01 | 0.1426 |
| 10910 | SUGT1 | P12T-E | Human | Esophagus | ESCC | 1.32e-38 | 7.62e-01 | 0.1122 |
| 10910 | SUGT1 | P15T-E | Human | Esophagus | ESCC | 7.76e-38 | 8.58e-01 | 0.1149 |
| Page: 1 2 3 4 5 6 7 |
| Tissue | Expression Dynamics | Abbreviation |
| Esophagus | 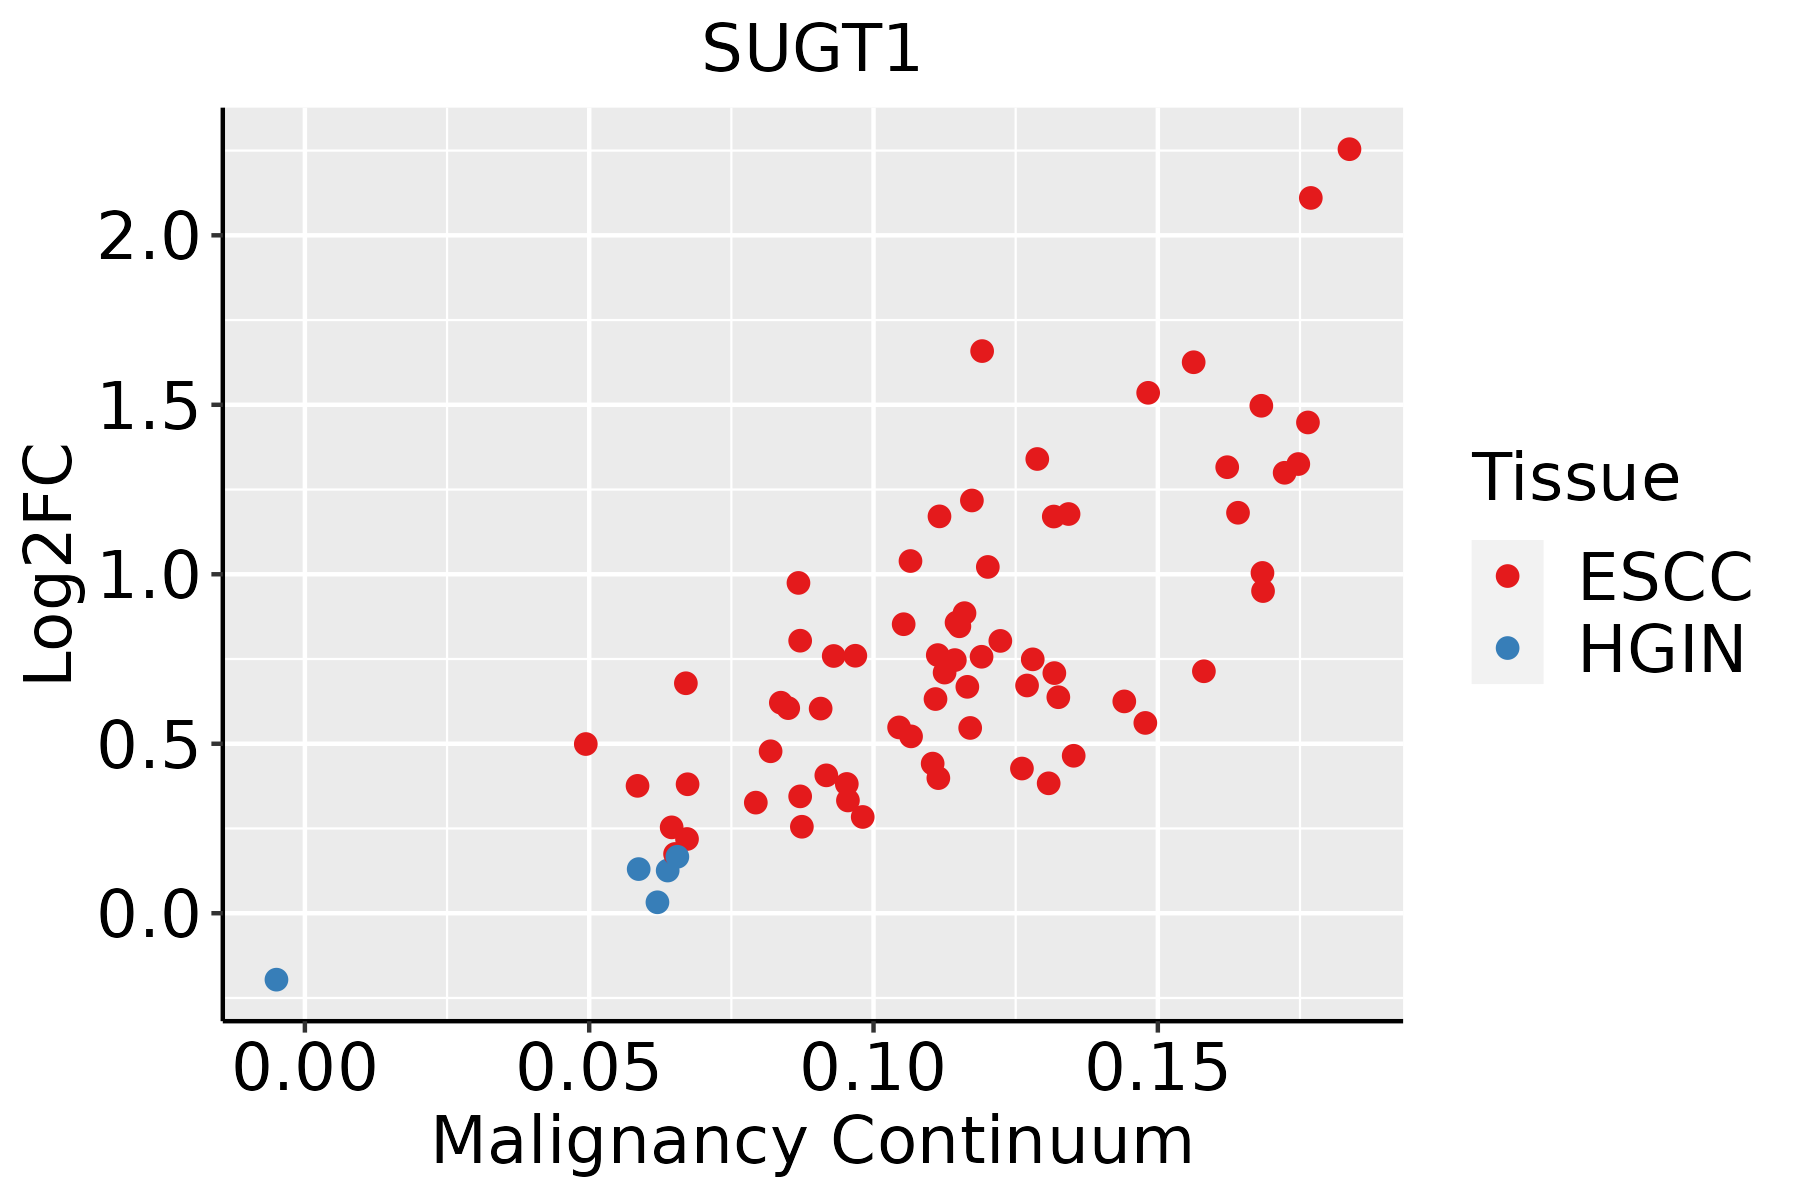 | ESCC: Esophageal squamous cell carcinoma |
| HGIN: High-grade intraepithelial neoplasias | ||
| LGIN: Low-grade intraepithelial neoplasias | ||
| Liver | 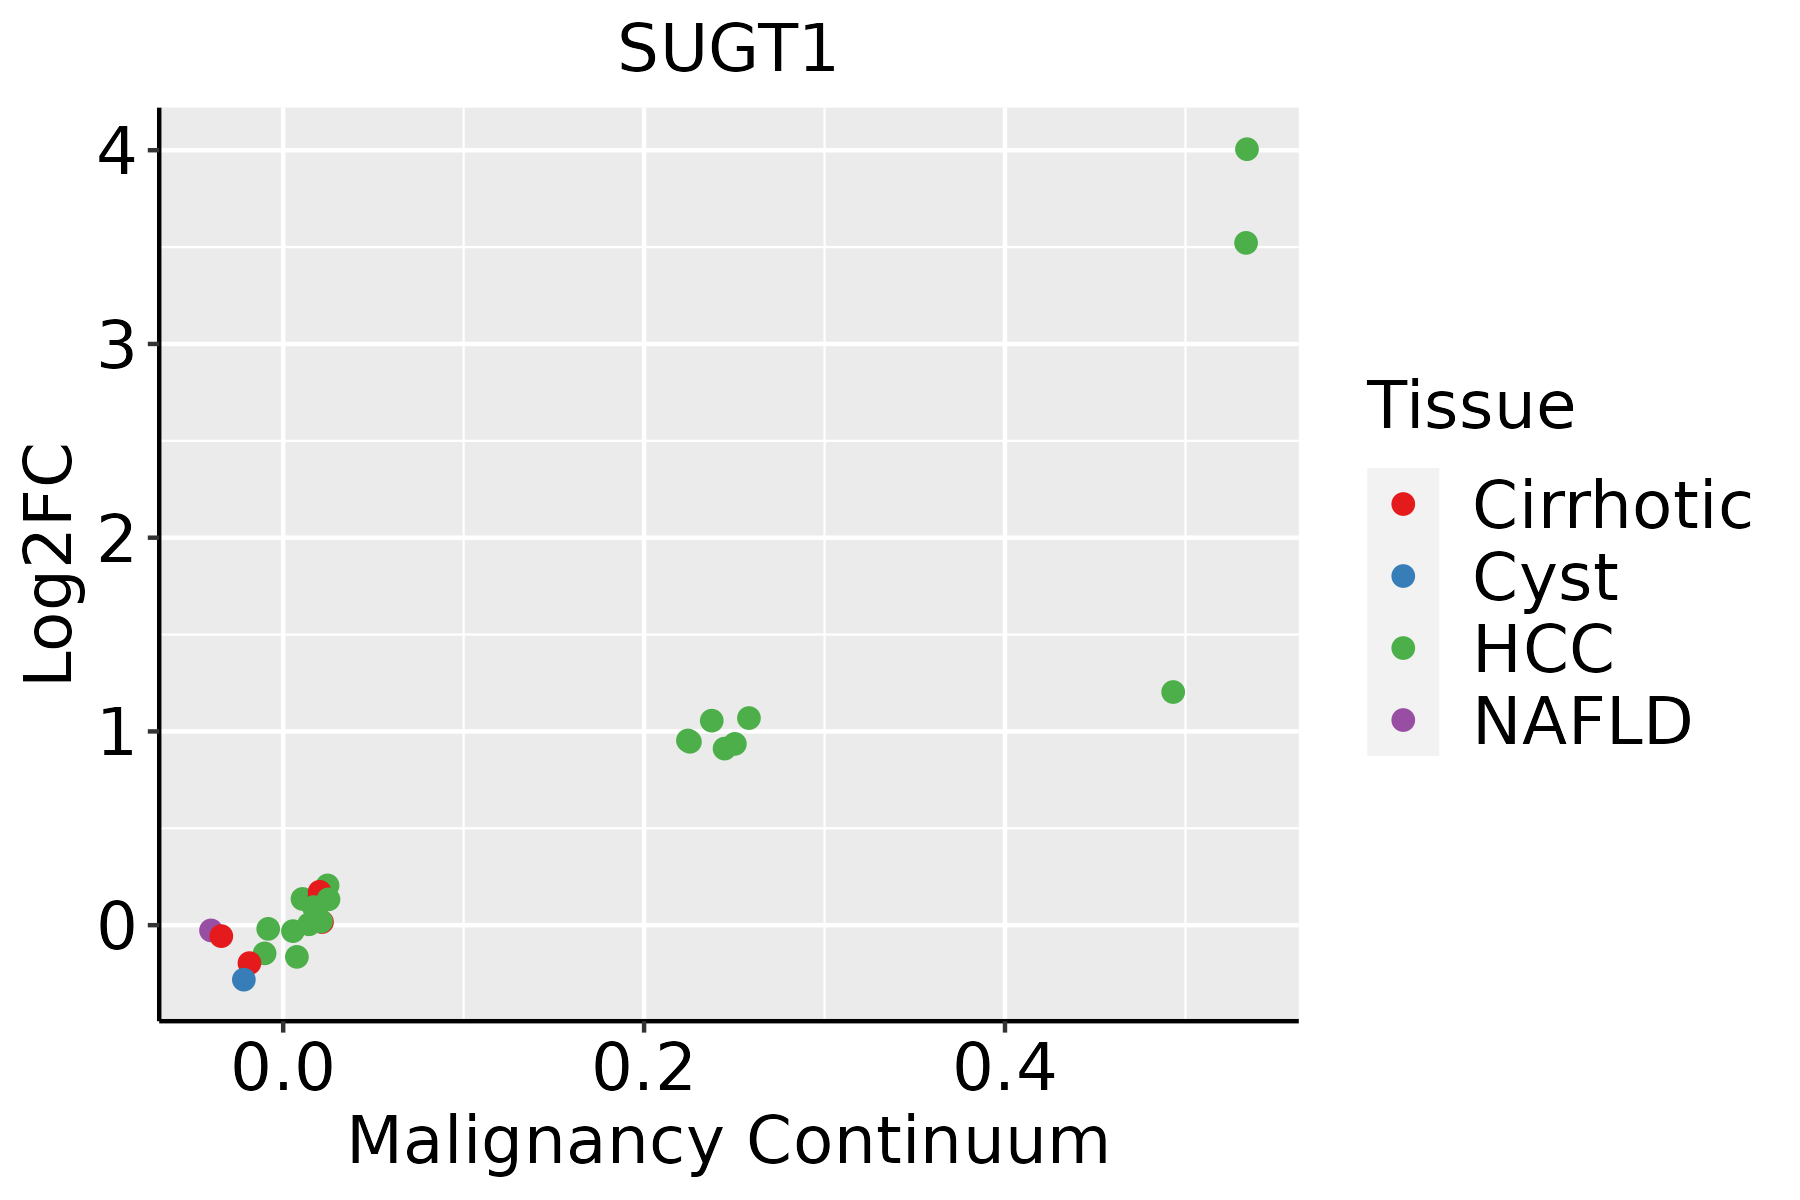 | HCC: Hepatocellular carcinoma |
| NAFLD: Non-alcoholic fatty liver disease | ||
| Oral Cavity | 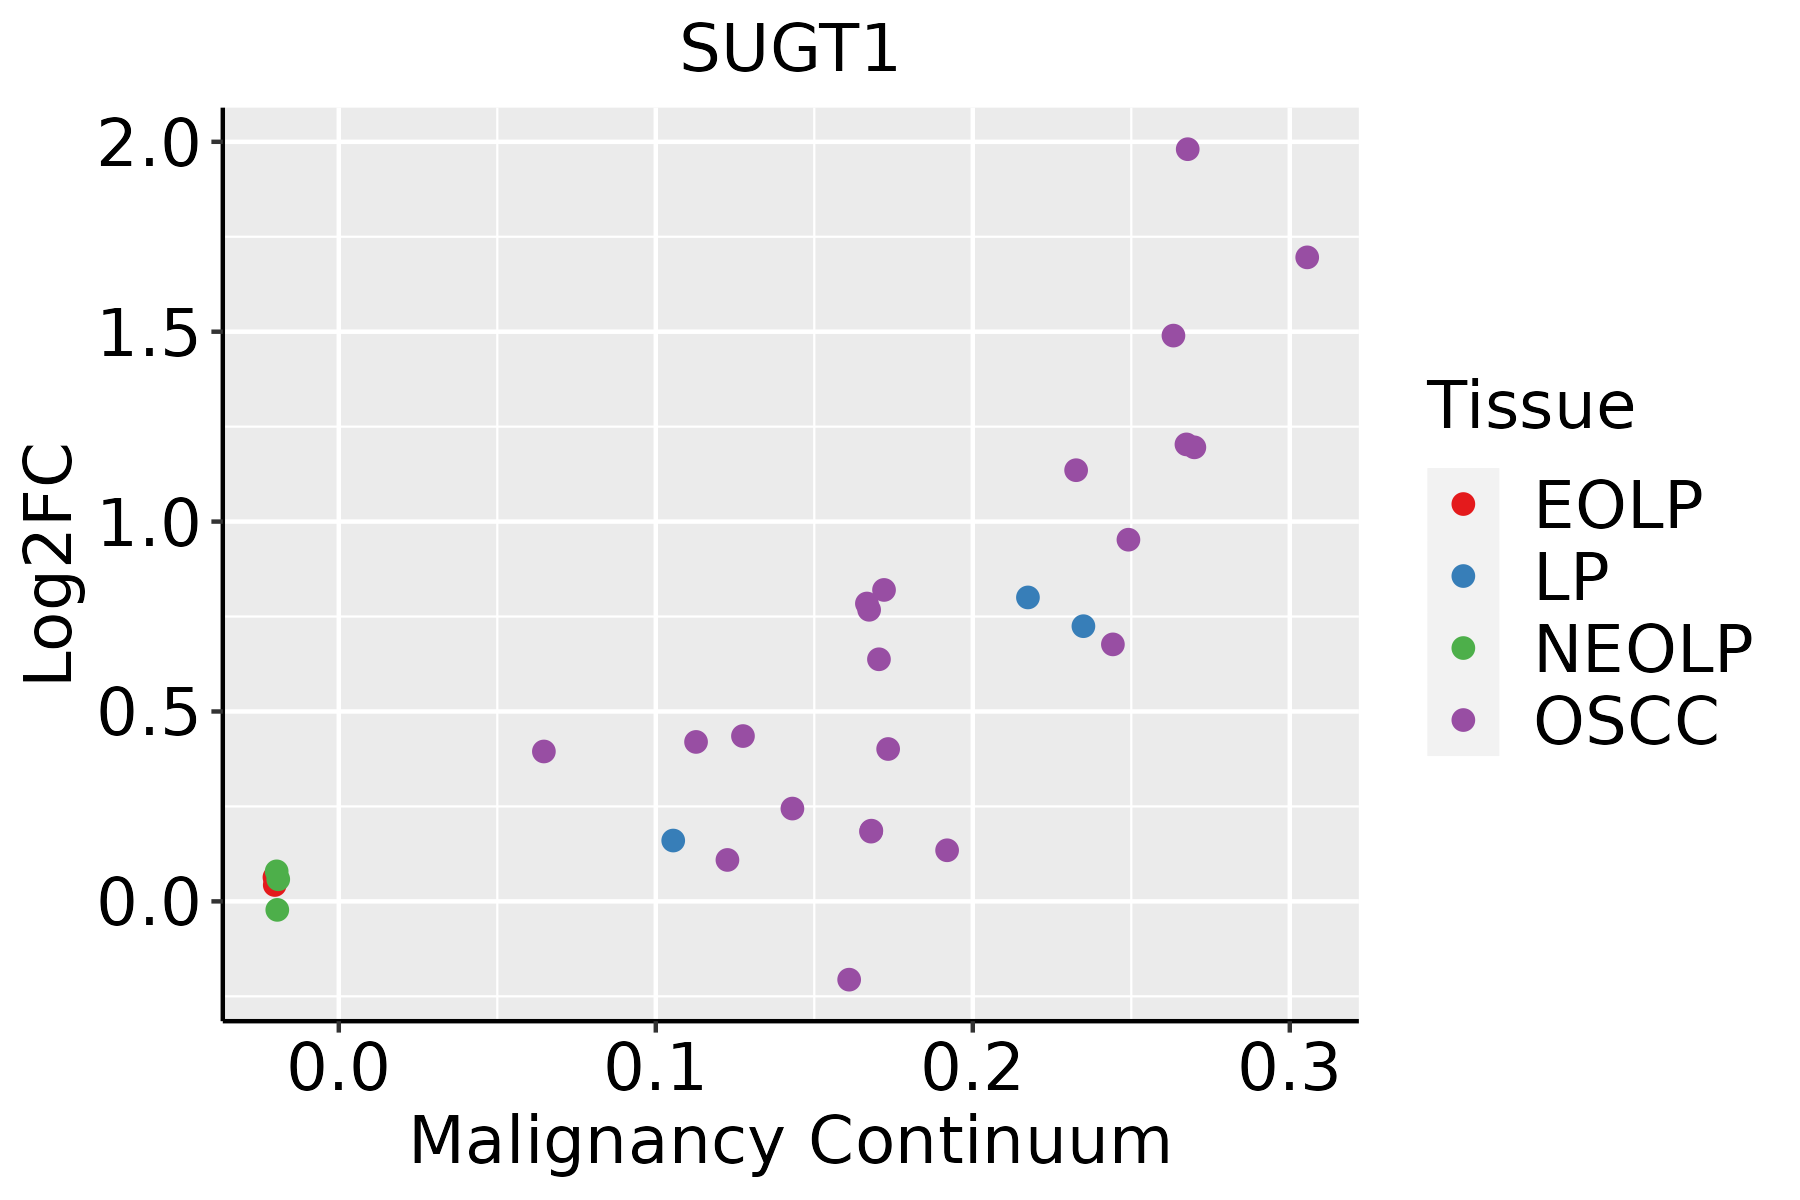 | EOLP: Erosive Oral lichen planus |
| LP: leukoplakia | ||
| NEOLP: Non-erosive oral lichen planus | ||
| OSCC: Oral squamous cell carcinoma | ||
| Prostate |  | BPH: Benign Prostatic Hyperplasia |
| Skin |  | AK: Actinic keratosis |
| cSCC: Cutaneous squamous cell carcinoma | ||
| SCCIS:squamous cell carcinoma in situ | ||
| Thyroid | 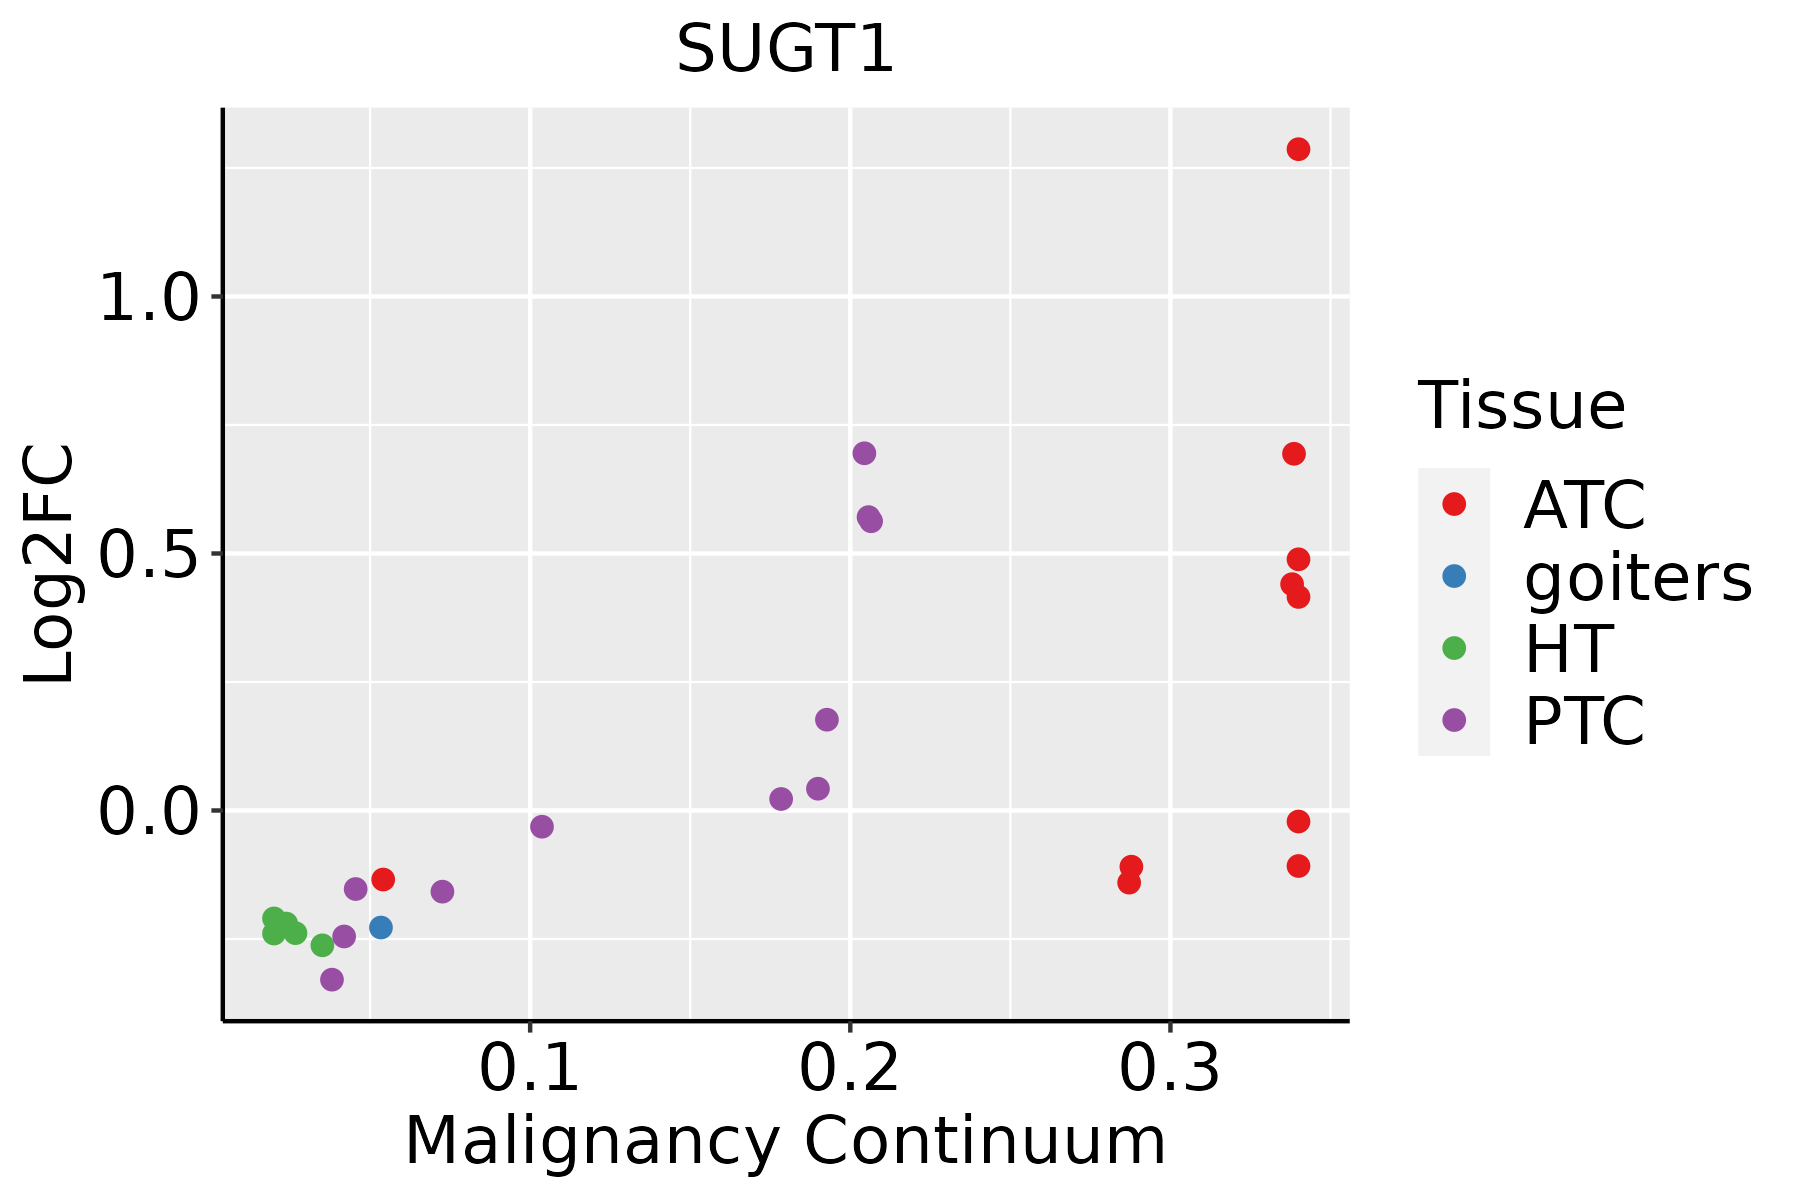 | ATC: Anaplastic thyroid cancer |
| HT: Hashimoto's thyroiditis | ||
| PTC: Papillary thyroid cancer |
| ∗log2FC in expression of this searched gene in stem-like cells from each diseased tissue sample relative to stem-like cells in normal samples in each tissue plotted against the malignancy continuum. Samples are colored based on if they are from different disease stage. |
Top |
Malignant transformation related pathway analysis |
| Find out the enriched GO biological processes and KEGG pathways involved in transition from healthy to precancer to cancer |
| Tissue | Disease Stage | Enriched GO biological Processes |
| Colorectum | AD |  |
| Colorectum | SER |  |
| Colorectum | MSS |  |
| Colorectum | MSI-H |  |
| Colorectum | FAP |  |
| ∗Top 15 enriched GO BP terms are showed in the bar plot of each disease state in each tissue. Each row represents a significant GO biological process which is colored according to the -log10(p.adjust). |
| Page: 1 2 3 4 5 6 7 8 9 |
| GO ID | Tissue | Disease Stage | Description | Gene Ratio | Bg Ratio | pvalue | p.adjust | Count |
| GO:003164727 | Esophagus | HGIN | regulation of protein stability | 96/2587 | 298/18723 | 2.21e-16 | 5.76e-14 | 96 |
| GO:005082127 | Esophagus | HGIN | protein stabilization | 64/2587 | 191/18723 | 3.11e-12 | 4.24e-10 | 64 |
| GO:0031647111 | Esophagus | ESCC | regulation of protein stability | 223/8552 | 298/18723 | 5.76e-25 | 1.52e-22 | 223 |
| GO:0050821111 | Esophagus | ESCC | protein stabilization | 140/8552 | 191/18723 | 6.50e-15 | 3.61e-13 | 140 |
| GO:003164712 | Liver | Cirrhotic | regulation of protein stability | 144/4634 | 298/18723 | 6.74e-19 | 1.28e-16 | 144 |
| GO:005082112 | Liver | Cirrhotic | protein stabilization | 97/4634 | 191/18723 | 6.67e-15 | 6.97e-13 | 97 |
| GO:003164722 | Liver | HCC | regulation of protein stability | 211/7958 | 298/18723 | 2.29e-23 | 5.01e-21 | 211 |
| GO:005082122 | Liver | HCC | protein stabilization | 139/7958 | 191/18723 | 1.61e-17 | 1.71e-15 | 139 |
| GO:003164720 | Oral cavity | OSCC | regulation of protein stability | 193/7305 | 298/18723 | 1.30e-19 | 1.95e-17 | 193 |
| GO:005082120 | Oral cavity | OSCC | protein stabilization | 122/7305 | 191/18723 | 2.69e-12 | 1.09e-10 | 122 |
| GO:003164718 | Prostate | BPH | regulation of protein stability | 111/3107 | 298/18723 | 4.58e-18 | 1.42e-15 | 111 |
| GO:005082118 | Prostate | BPH | protein stabilization | 75/3107 | 191/18723 | 4.96e-14 | 5.68e-12 | 75 |
| GO:003164719 | Prostate | Tumor | regulation of protein stability | 112/3246 | 298/18723 | 4.18e-17 | 1.18e-14 | 112 |
| GO:005082119 | Prostate | Tumor | protein stabilization | 76/3246 | 191/18723 | 1.55e-13 | 1.73e-11 | 76 |
| GO:003164728 | Skin | AK | regulation of protein stability | 64/1910 | 298/18723 | 5.93e-09 | 4.14e-07 | 64 |
| GO:005082128 | Skin | AK | protein stabilization | 47/1910 | 191/18723 | 7.41e-09 | 4.99e-07 | 47 |
| GO:003164729 | Skin | cSCC | regulation of protein stability | 144/4864 | 298/18723 | 6.51e-17 | 6.80e-15 | 144 |
| GO:0050821112 | Skin | cSCC | protein stabilization | 96/4864 | 191/18723 | 5.00e-13 | 2.93e-11 | 96 |
| GO:0031647113 | Thyroid | PTC | regulation of protein stability | 174/5968 | 298/18723 | 2.05e-21 | 4.05e-19 | 174 |
| GO:0050821113 | Thyroid | PTC | protein stabilization | 115/5968 | 191/18723 | 5.67e-16 | 4.31e-14 | 115 |
| Page: 1 2 |
| Pathway ID | Tissue | Disease Stage | Description | Gene Ratio | Bg Ratio | pvalue | p.adjust | qvalue | Count |
| hsa046219 | Esophagus | HGIN | NOD-like receptor signaling pathway | 45/1383 | 186/8465 | 3.40e-03 | 2.54e-02 | 2.02e-02 | 45 |
| hsa0462114 | Esophagus | HGIN | NOD-like receptor signaling pathway | 45/1383 | 186/8465 | 3.40e-03 | 2.54e-02 | 2.02e-02 | 45 |
| hsa0462122 | Esophagus | ESCC | NOD-like receptor signaling pathway | 116/4205 | 186/8465 | 2.90e-04 | 1.03e-03 | 5.30e-04 | 116 |
| hsa0462132 | Esophagus | ESCC | NOD-like receptor signaling pathway | 116/4205 | 186/8465 | 2.90e-04 | 1.03e-03 | 5.30e-04 | 116 |
| hsa046218 | Oral cavity | OSCC | NOD-like receptor signaling pathway | 108/3704 | 186/8465 | 5.13e-05 | 2.07e-04 | 1.05e-04 | 108 |
| hsa0462113 | Oral cavity | OSCC | NOD-like receptor signaling pathway | 108/3704 | 186/8465 | 5.13e-05 | 2.07e-04 | 1.05e-04 | 108 |
| Page: 1 |
Top |
Cell-cell communication analysis |
| Identification of potential cell-cell interactions between two cell types and their ligand-receptor pairs for different disease states |
| Ligand | Receptor | LRpair | Pathway | Tissue | Disease Stage |
| Page: 1 |
Top |
Single-cell gene regulatory network inference analysis |
| Find out the significant the regulons (TFs) and the target genes of each regulon across cell types for different disease states |
| TF | Cell Type | Tissue | Disease Stage | Target Gene | RSS | Regulon Activity |
| ∗The dot plots of a searched regulon are shown for all cell subpopulations in each disease state of each tissue based on the regulon specific score inferred using pySCENIC and by calculating the average expression. |
| Page: 1 |
Top |
Somatic mutation of malignant transformation related genes |
| Annotation of somatic variants for genes involved in malignant transformation |
| Hugo Symbol | Variant Class | Variant Classification | dbSNP RS | HGVSc | HGVSp | HGVSp Short | SWISSPROT | BIOTYPE | SIFT | PolyPhen | Tumor Sample Barcode | Tissue | Histology | Sex | Age | Stage | Therapy Types | Drugs | Outcome |
| SUGT1 | SNV | Missense_Mutation | novel | c.897N>T | p.Lys299Asn | p.K299N | Q9Y2Z0 | protein_coding | deleterious(0) | probably_damaging(0.992) | TCGA-AN-A046-01 | Breast | breast invasive carcinoma | Female | >=65 | I/II | Unknown | Unknown | SD |
| SUGT1 | SNV | Missense_Mutation | c.723N>C | p.Lys241Asn | p.K241N | Q9Y2Z0 | protein_coding | deleterious(0) | probably_damaging(0.999) | TCGA-E2-A14R-01 | Breast | breast invasive carcinoma | Female | <65 | I/II | Chemotherapy | doxorubicin | PD | |
| SUGT1 | insertion | Nonsense_Mutation | novel | c.940_941insTTGAAGTGTATGGTTCTTAA | p.Gln314LeufsTer7 | p.Q314Lfs*7 | Q9Y2Z0 | protein_coding | TCGA-AN-A0FW-01 | Breast | breast invasive carcinoma | Female | >=65 | III/IV | Unknown | Unknown | SD | ||
| SUGT1 | SNV | Missense_Mutation | c.607N>C | p.Glu203Gln | p.E203Q | Q9Y2Z0 | protein_coding | deleterious(0.01) | possibly_damaging(0.771) | TCGA-C5-A1BK-01 | Cervix | cervical & endocervical cancer | Female | <65 | I/II | Unknown | Unknown | SD | |
| SUGT1 | SNV | Missense_Mutation | novel | c.463N>G | p.Gln155Glu | p.Q155E | Q9Y2Z0 | protein_coding | tolerated(1) | benign(0) | TCGA-VS-A958-01 | Cervix | cervical & endocervical cancer | Female | <65 | I/II | Chemotherapy | cisplatin | CR |
| SUGT1 | SNV | Missense_Mutation | rs764131039 | c.45C>A | p.Phe15Leu | p.F15L | Q9Y2Z0 | protein_coding | tolerated(0.1) | benign(0) | TCGA-AA-3866-01 | Colorectum | colon adenocarcinoma | Female | >=65 | I/II | Unknown | Unknown | SD |
| SUGT1 | SNV | Missense_Mutation | novel | c.1018T>G | p.Leu340Val | p.L340V | Q9Y2Z0 | protein_coding | deleterious(0) | probably_damaging(1) | TCGA-F5-6814-01 | Colorectum | rectum adenocarcinoma | Male | <65 | I/II | Unknown | Unknown | SD |
| SUGT1 | SNV | Missense_Mutation | c.300N>C | p.Glu100Asp | p.E100D | Q9Y2Z0 | protein_coding | tolerated(0.24) | benign(0.091) | TCGA-AP-A059-01 | Endometrium | uterine corpus endometrioid carcinoma | Female | >=65 | I/II | Unknown | Unknown | SD | |
| SUGT1 | SNV | Missense_Mutation | c.568N>G | p.Lys190Glu | p.K190E | Q9Y2Z0 | protein_coding | deleterious(0) | probably_damaging(1) | TCGA-AP-A059-01 | Endometrium | uterine corpus endometrioid carcinoma | Female | >=65 | I/II | Unknown | Unknown | SD | |
| SUGT1 | SNV | Missense_Mutation | rs750001919 | c.289N>A | p.Ala97Thr | p.A97T | Q9Y2Z0 | protein_coding | tolerated(0.13) | benign(0.164) | TCGA-AP-A1DK-01 | Endometrium | uterine corpus endometrioid carcinoma | Female | <65 | I/II | Unknown | Unknown | SD |
| Page: 1 2 3 |
Top |
Related drugs of malignant transformation related genes |
| Identification of chemicals and drugs interact with genes involved in malignant transfromation |
| (DGIdb 4.0) |
| Entrez ID | Symbol | Category | Interaction Types | Drug Claim Name | Drug Name | PMIDs |
| Page: 1 |

Copyright 2023-Present -The University of Texas Health Science Center at Houston |