
|
|||||
|
 | |
| |
| |
| |
| |
| |
|
Gene: SUGCT |
Gene summary for SUGCT |
| Gene information | Species | Human | Gene symbol | SUGCT | Gene ID | 79783 |
| Gene name | succinyl-CoA:glutarate-CoA transferase | |
| Gene Alias | C7orf10 | |
| Cytomap | 7p14.1 | |
| Gene Type | protein-coding | GO ID | GO:0005575 | UniProtAcc | Q9HAC7 |
Top |
Malignant transformation analysis |
| Identification of the aberrant gene expression in precancerous and cancerous lesions by comparing the gene expression of stem-like cells in diseased tissues with normal stem cells |
| Entrez ID | Symbol | Replicates | Species | Organ | Tissue | Adj P-value | Log2FC | Malignancy |
| 79783 | SUGCT | HTA11_3410_2000001011 | Human | Colorectum | AD | 1.83e-10 | -4.70e-01 | 0.0155 |
| 79783 | SUGCT | HTA11_347_2000001011 | Human | Colorectum | AD | 1.16e-06 | 5.73e-01 | -0.1954 |
| 79783 | SUGCT | HTA11_866_3004761011 | Human | Colorectum | AD | 1.06e-09 | -4.67e-01 | 0.096 |
| 79783 | SUGCT | HTA11_7696_3000711011 | Human | Colorectum | AD | 2.54e-14 | -4.70e-01 | 0.0674 |
| 79783 | SUGCT | HTA11_99999970781_79442 | Human | Colorectum | MSS | 1.70e-06 | -3.20e-01 | 0.294 |
| 79783 | SUGCT | HTA11_99999974143_84620 | Human | Colorectum | MSS | 5.66e-15 | -4.86e-01 | 0.3005 |
| 79783 | SUGCT | F007 | Human | Colorectum | FAP | 8.61e-05 | -4.57e-01 | 0.1176 |
| 79783 | SUGCT | A002-C-010 | Human | Colorectum | FAP | 1.72e-13 | -4.87e-01 | 0.242 |
| 79783 | SUGCT | A001-C-207 | Human | Colorectum | FAP | 2.86e-07 | -4.33e-01 | 0.1278 |
| 79783 | SUGCT | A015-C-203 | Human | Colorectum | FAP | 1.11e-14 | -4.10e-01 | -0.1294 |
| 79783 | SUGCT | A015-C-204 | Human | Colorectum | FAP | 1.14e-04 | -3.60e-01 | -0.0228 |
| 79783 | SUGCT | A002-C-201 | Human | Colorectum | FAP | 1.04e-16 | -5.13e-01 | 0.0324 |
| 79783 | SUGCT | A002-C-203 | Human | Colorectum | FAP | 7.93e-14 | -4.63e-01 | 0.2786 |
| 79783 | SUGCT | A001-C-119 | Human | Colorectum | FAP | 2.67e-07 | -4.91e-01 | -0.1557 |
| 79783 | SUGCT | A001-C-108 | Human | Colorectum | FAP | 8.70e-13 | -4.57e-01 | -0.0272 |
| 79783 | SUGCT | A002-C-205 | Human | Colorectum | FAP | 7.61e-16 | -4.89e-01 | -0.1236 |
| 79783 | SUGCT | A001-C-104 | Human | Colorectum | FAP | 1.90e-09 | -4.08e-01 | 0.0184 |
| 79783 | SUGCT | A015-C-005 | Human | Colorectum | FAP | 2.40e-07 | -4.23e-01 | -0.0336 |
| 79783 | SUGCT | A015-C-006 | Human | Colorectum | FAP | 8.77e-10 | -4.64e-01 | -0.0994 |
| 79783 | SUGCT | A015-C-106 | Human | Colorectum | FAP | 9.64e-13 | -3.80e-01 | -0.0511 |
| Page: 1 2 3 4 5 |
| Tissue | Expression Dynamics | Abbreviation |
| Colorectum (GSE201348) |  | FAP: Familial adenomatous polyposis |
| CRC: Colorectal cancer | ||
| Colorectum (HTA11) |  | AD: Adenomas |
| SER: Sessile serrated lesions | ||
| MSI-H: Microsatellite-high colorectal cancer | ||
| MSS: Microsatellite stable colorectal cancer | ||
| Esophagus | 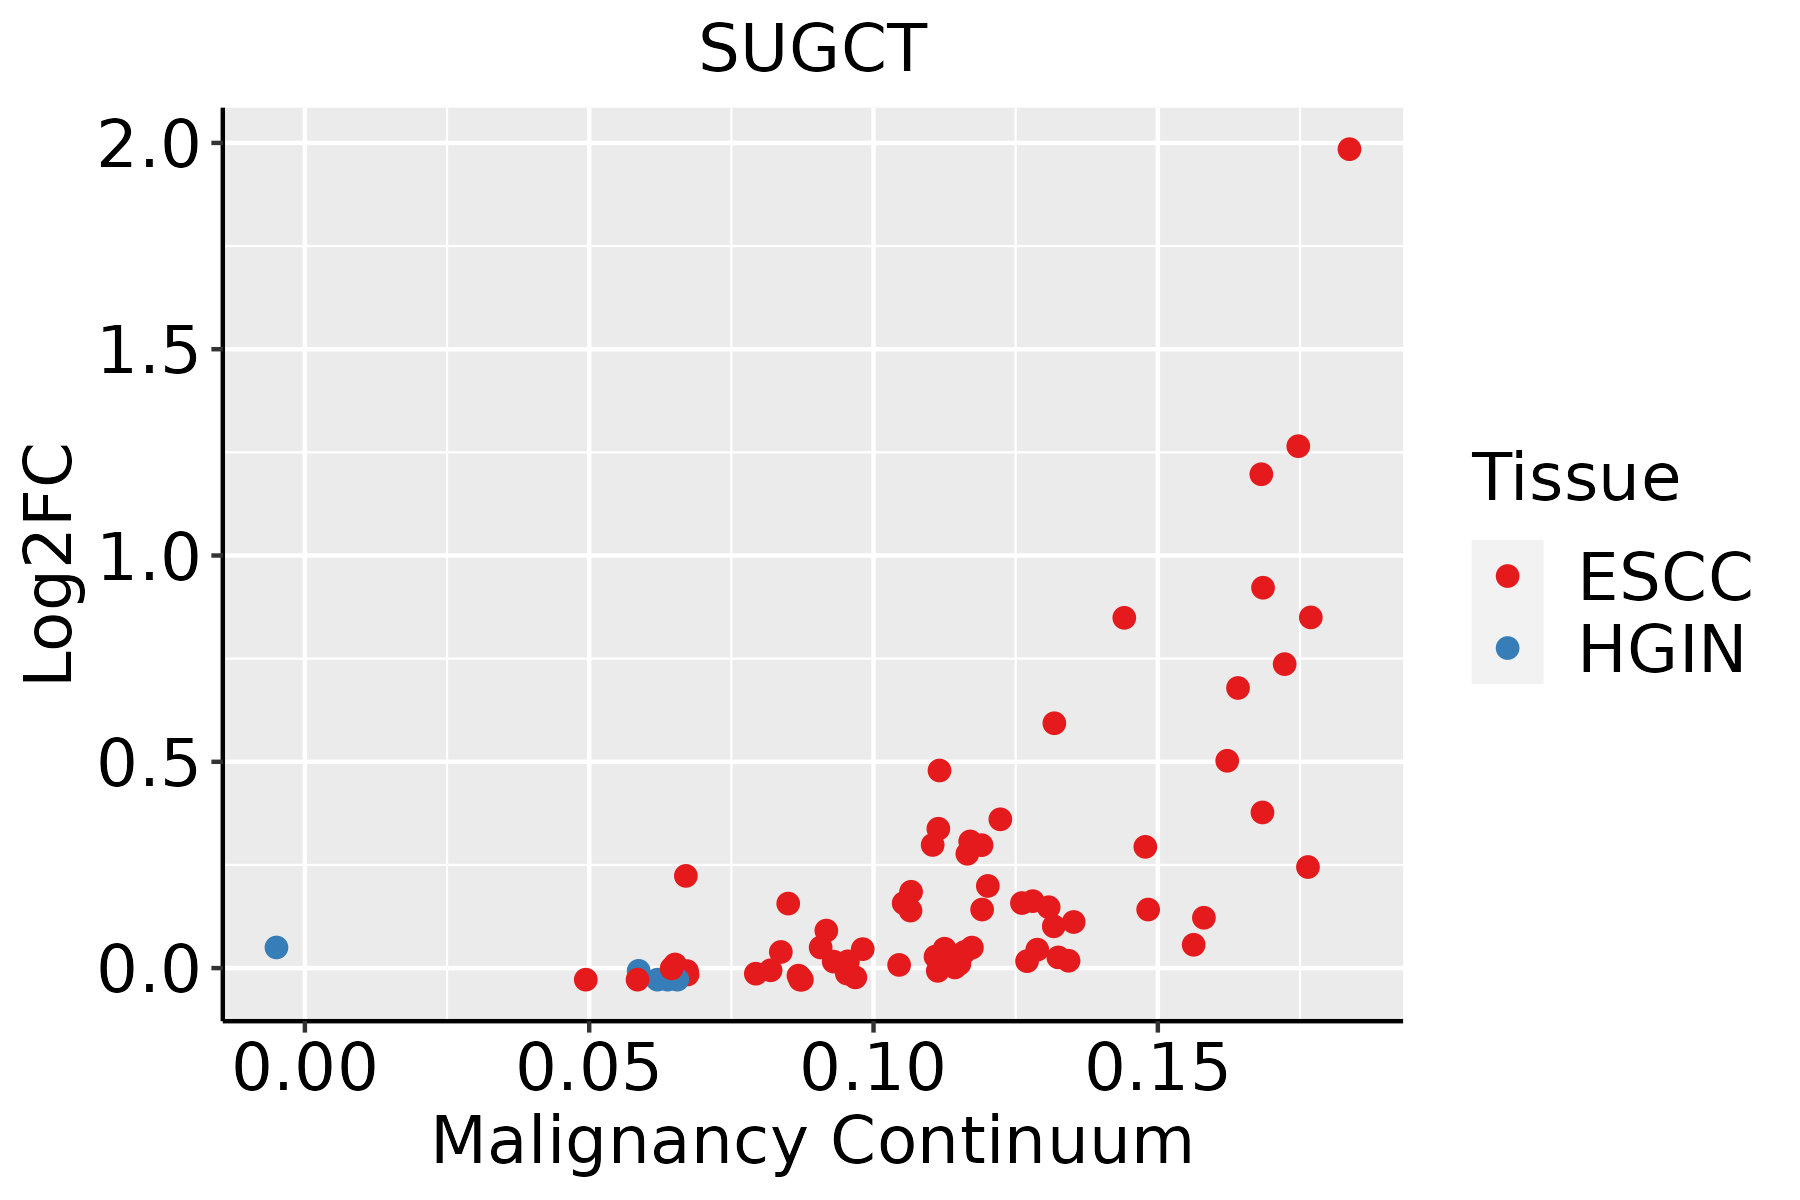 | ESCC: Esophageal squamous cell carcinoma |
| HGIN: High-grade intraepithelial neoplasias | ||
| LGIN: Low-grade intraepithelial neoplasias | ||
| Liver | 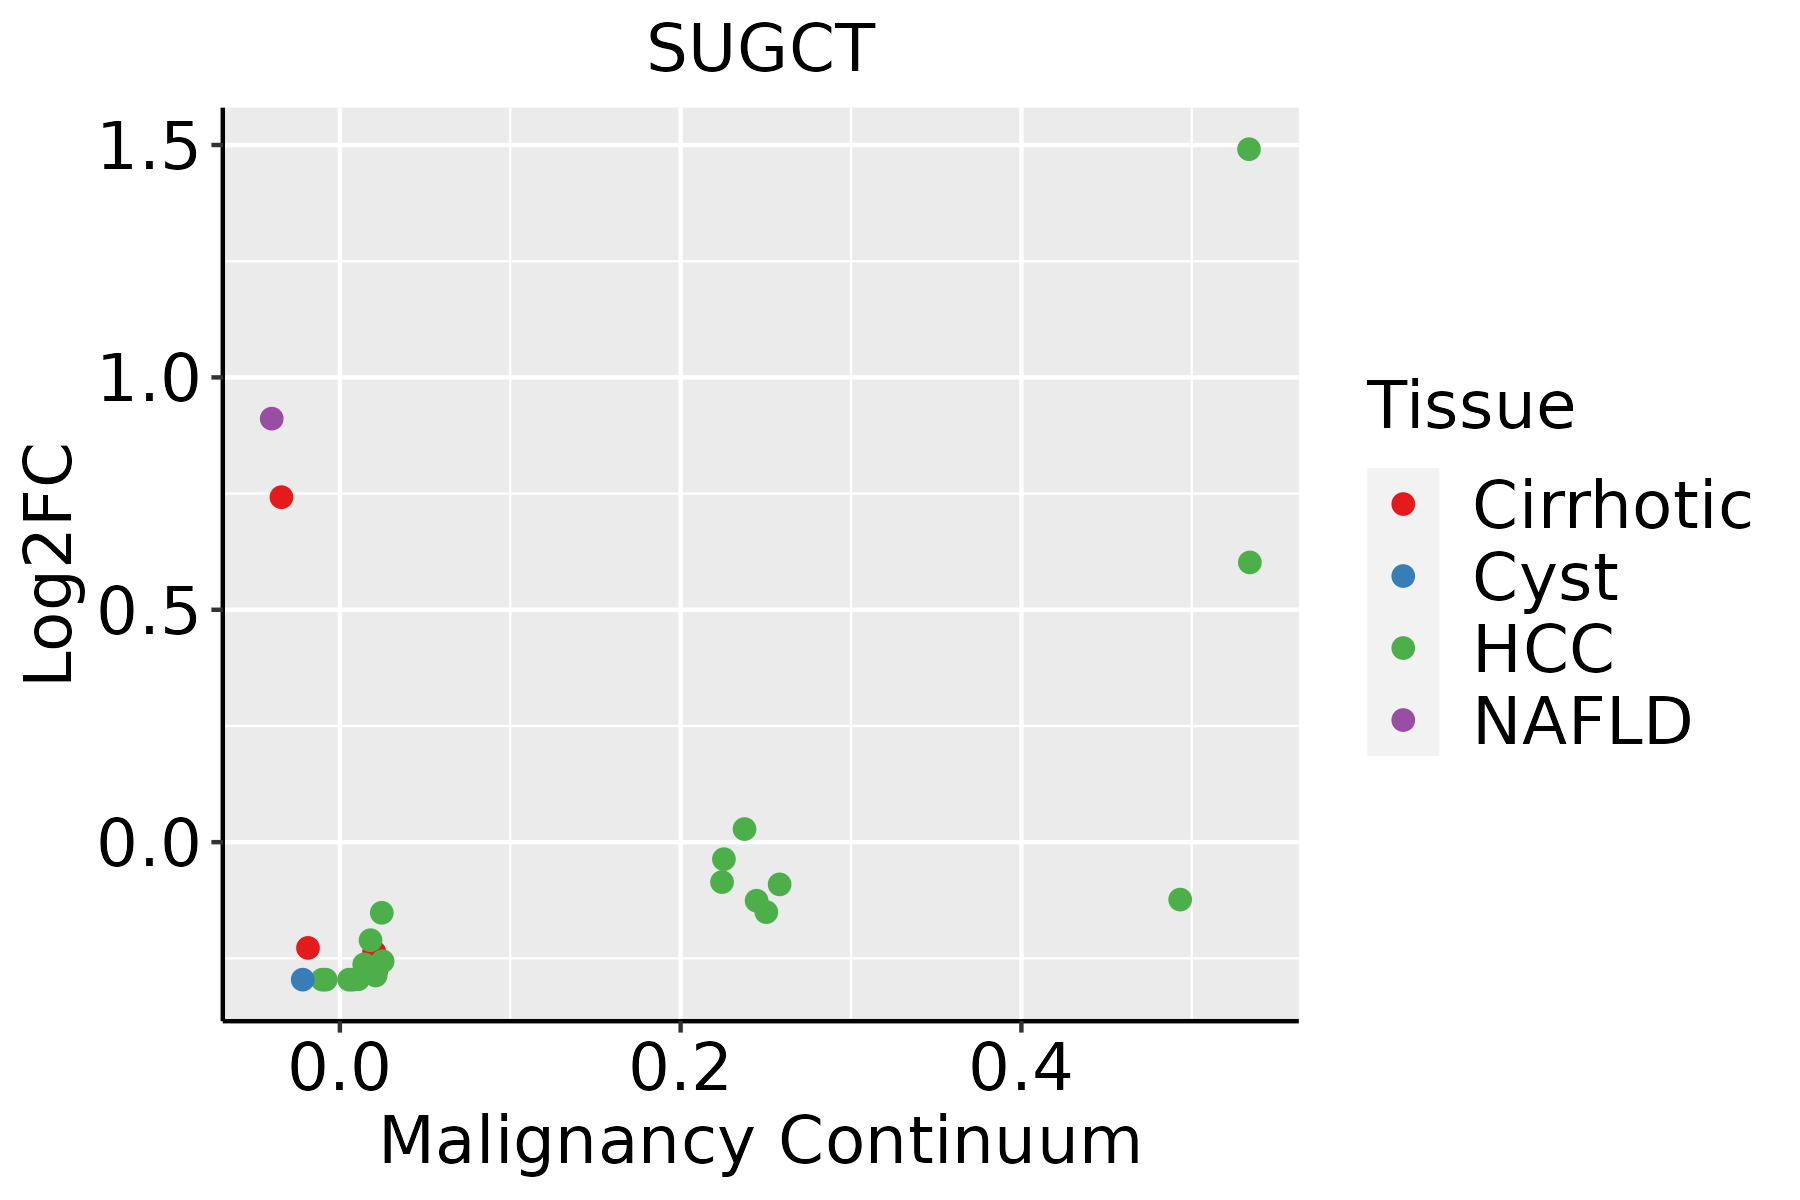 | HCC: Hepatocellular carcinoma |
| NAFLD: Non-alcoholic fatty liver disease | ||
| Oral Cavity | 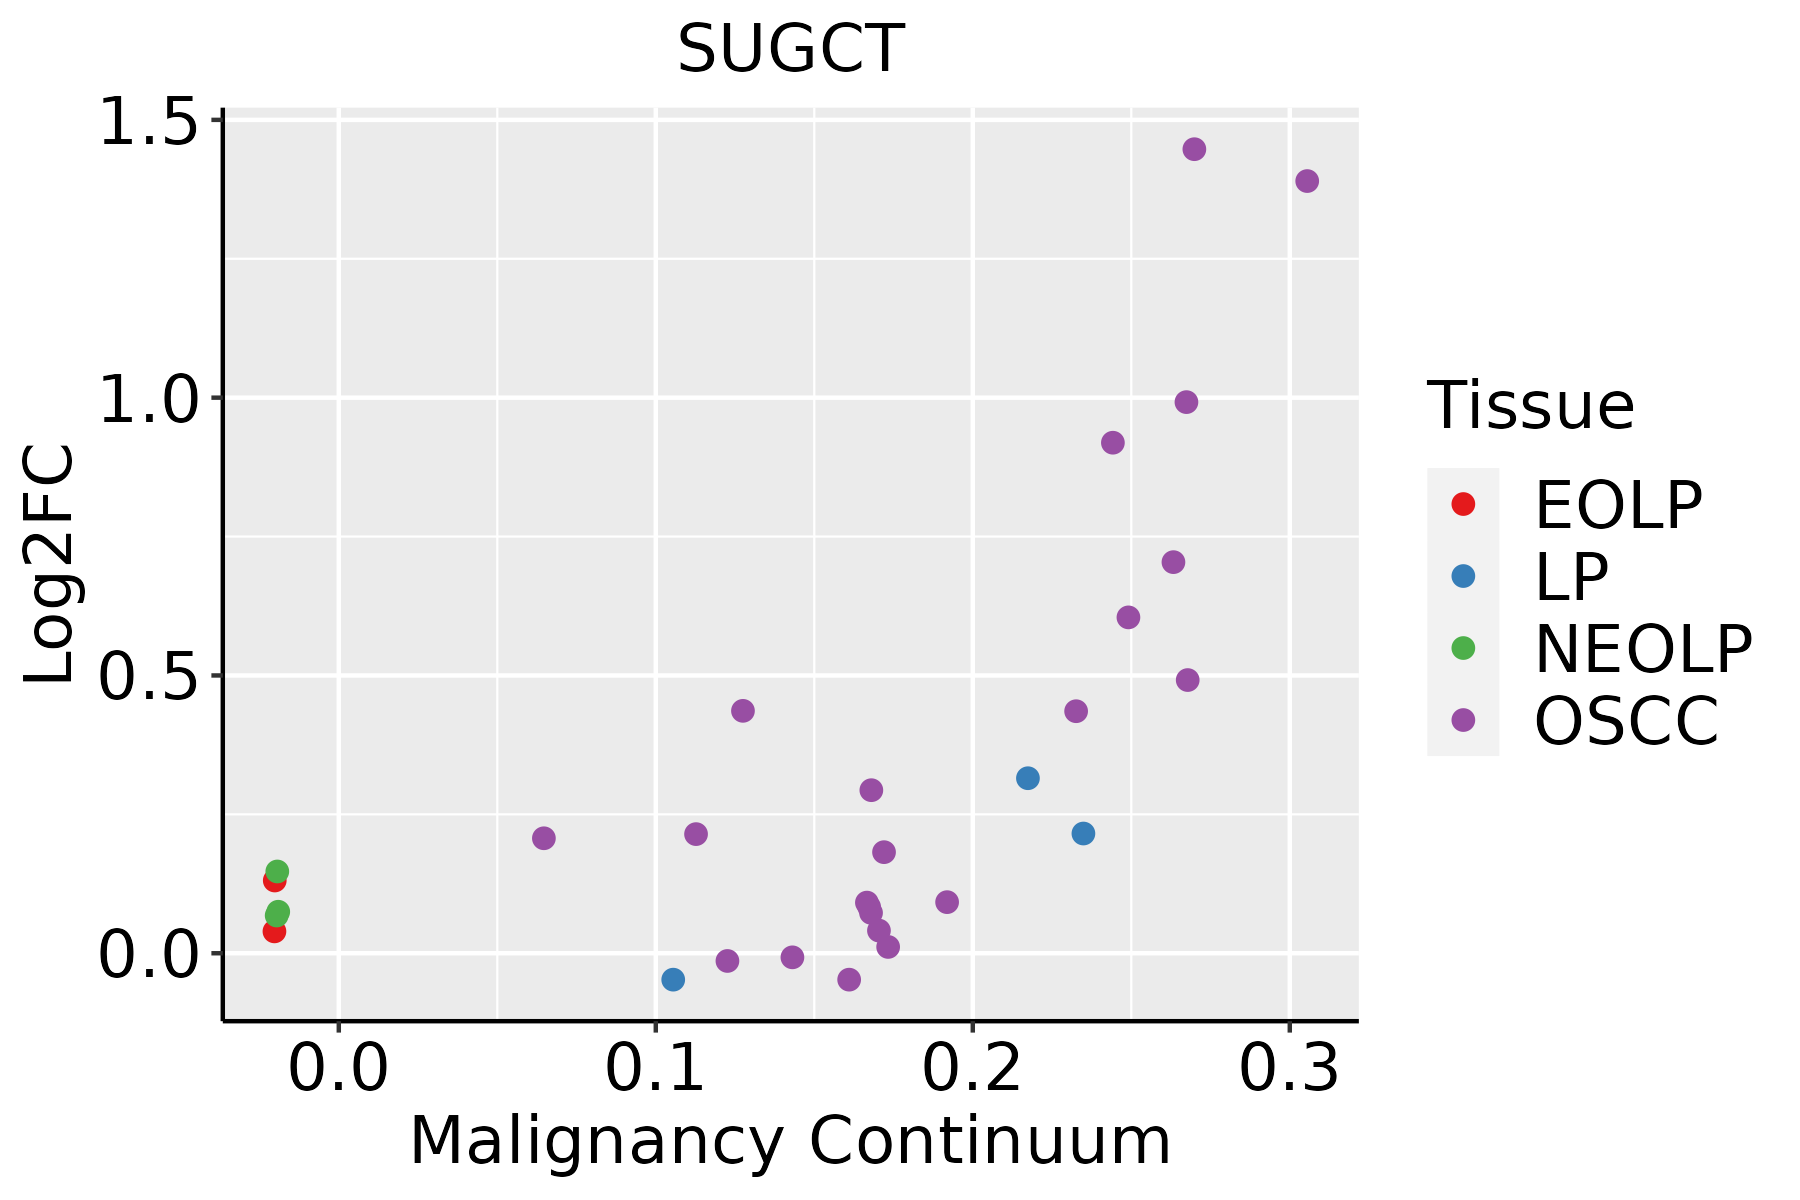 | EOLP: Erosive Oral lichen planus |
| LP: leukoplakia | ||
| NEOLP: Non-erosive oral lichen planus | ||
| OSCC: Oral squamous cell carcinoma | ||
| Skin | 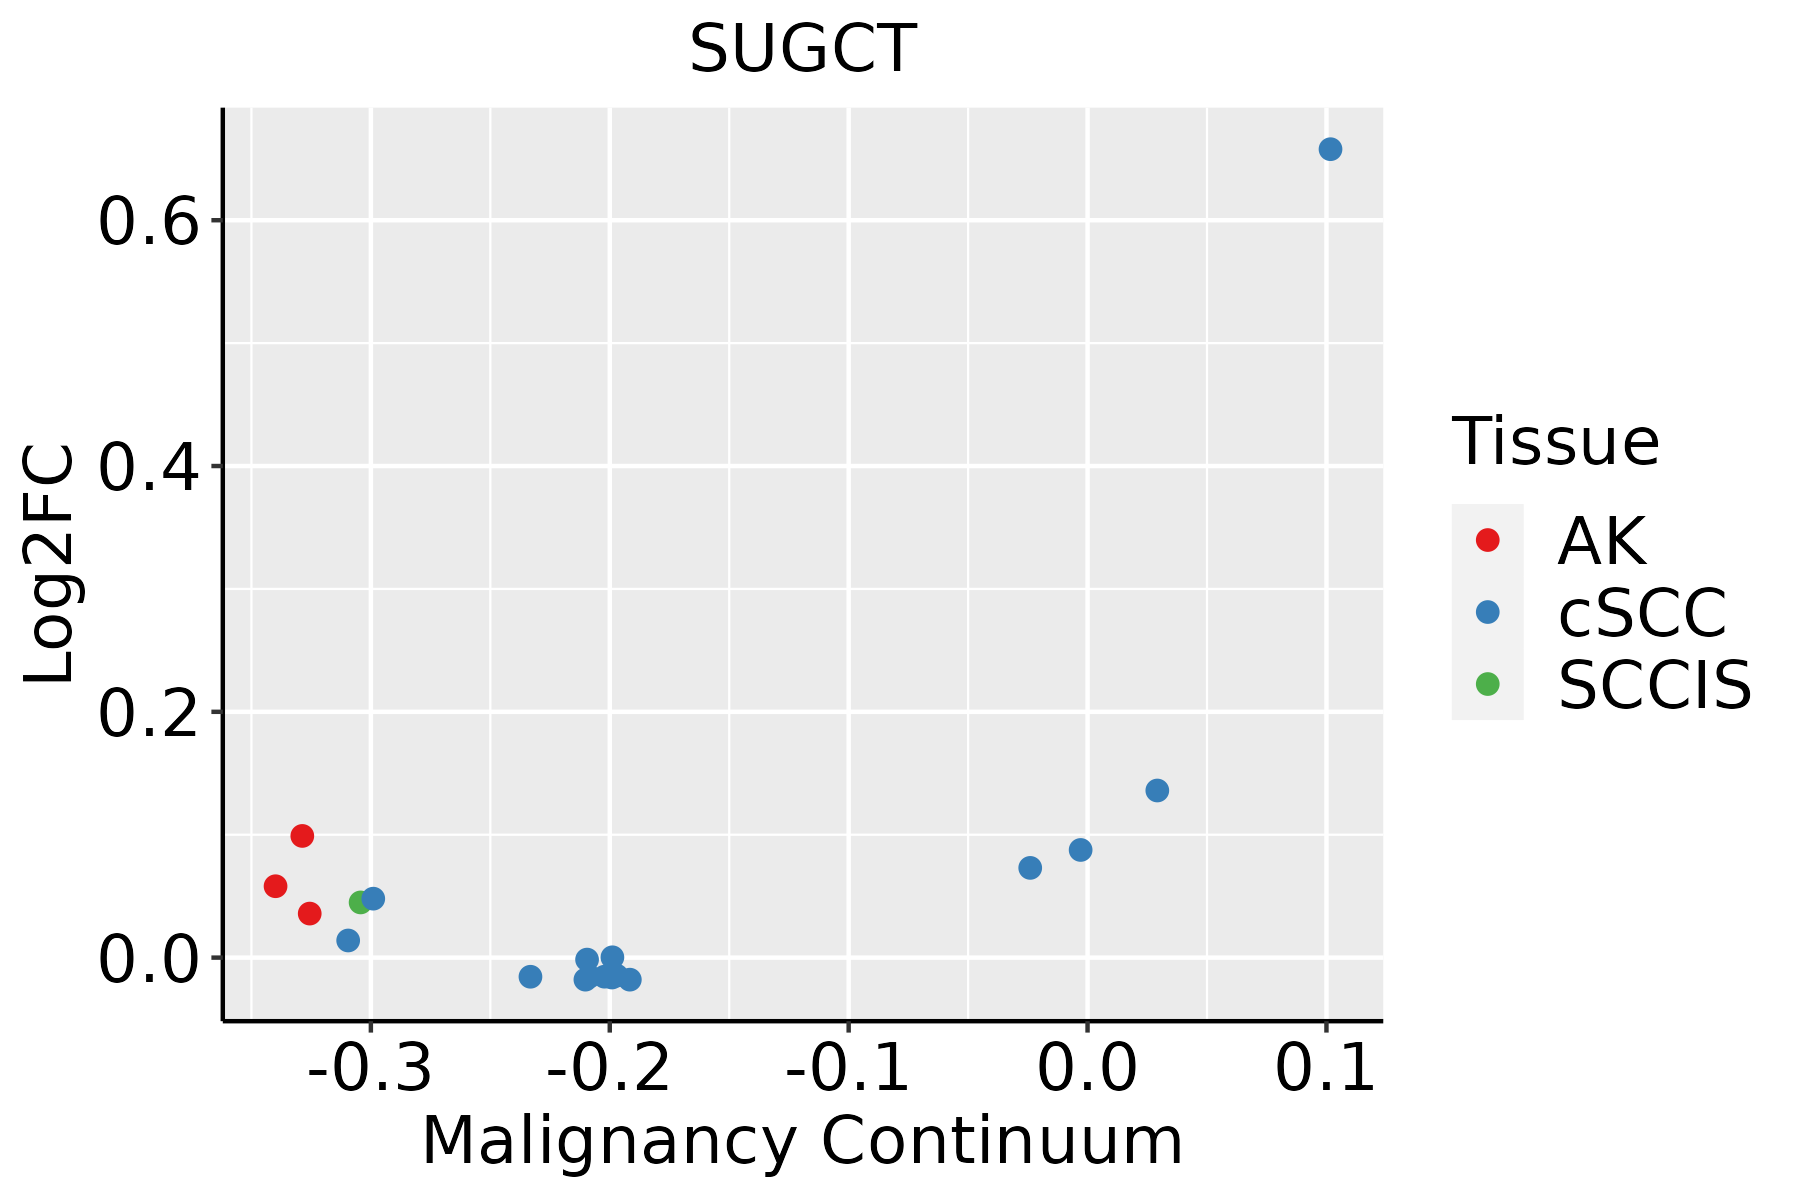 | AK: Actinic keratosis |
| cSCC: Cutaneous squamous cell carcinoma | ||
| SCCIS:squamous cell carcinoma in situ |
| ∗log2FC in expression of this searched gene in stem-like cells from each diseased tissue sample relative to stem-like cells in normal samples in each tissue plotted against the malignancy continuum. Samples are colored based on if they are from different disease stage. |
Top |
Malignant transformation related pathway analysis |
| Find out the enriched GO biological processes and KEGG pathways involved in transition from healthy to precancer to cancer |
| Tissue | Disease Stage | Enriched GO biological Processes |
| Colorectum | AD |  |
| Colorectum | SER |  |
| Colorectum | MSS |  |
| Colorectum | MSI-H |  |
| Colorectum | FAP |  |
| ∗Top 15 enriched GO BP terms are showed in the bar plot of each disease state in each tissue. Each row represents a significant GO biological process which is colored according to the -log10(p.adjust). |
| Page: 1 2 3 4 5 6 7 8 9 |
| GO ID | Tissue | Disease Stage | Description | Gene Ratio | Bg Ratio | pvalue | p.adjust | Count |
| Page: 1 |
| Pathway ID | Tissue | Disease Stage | Description | Gene Ratio | Bg Ratio | pvalue | p.adjust | qvalue | Count |
| Page: 1 |
Top |
Cell-cell communication analysis |
| Identification of potential cell-cell interactions between two cell types and their ligand-receptor pairs for different disease states |
| Ligand | Receptor | LRpair | Pathway | Tissue | Disease Stage |
| Page: 1 |
Top |
Single-cell gene regulatory network inference analysis |
| Find out the significant the regulons (TFs) and the target genes of each regulon across cell types for different disease states |
| TF | Cell Type | Tissue | Disease Stage | Target Gene | RSS | Regulon Activity |
| ∗The dot plots of a searched regulon are shown for all cell subpopulations in each disease state of each tissue based on the regulon specific score inferred using pySCENIC and by calculating the average expression. |
| Page: 1 |
Top |
Somatic mutation of malignant transformation related genes |
| Annotation of somatic variants for genes involved in malignant transformation |
| Hugo Symbol | Variant Class | Variant Classification | dbSNP RS | HGVSc | HGVSp | HGVSp Short | SWISSPROT | BIOTYPE | SIFT | PolyPhen | Tumor Sample Barcode | Tissue | Histology | Sex | Age | Stage | Therapy Types | Drugs | Outcome |
| SUGCT | SNV | Missense_Mutation | novel | c.554T>C | p.Val185Ala | p.V185A | Q9HAC7 | protein_coding | deleterious(0) | benign(0.384) | TCGA-AN-A046-01 | Breast | breast invasive carcinoma | Female | >=65 | I/II | Unknown | Unknown | SD |
| SUGCT | SNV | Missense_Mutation | c.1133N>C | p.Ser378Thr | p.S378T | Q9HAC7 | protein_coding | tolerated(0.94) | benign(0.003) | TCGA-AR-A1AH-01 | Breast | breast invasive carcinoma | Female | <65 | I/II | Unspecific | PD | ||
| SUGCT | SNV | Missense_Mutation | c.1039N>C | p.Tyr347His | p.Y347H | Q9HAC7 | protein_coding | tolerated(0.13) | benign(0) | TCGA-C8-A26Y-01 | Breast | breast invasive carcinoma | Female | >=65 | I/II | Unknown | Unknown | SD | |
| SUGCT | SNV | Missense_Mutation | c.160C>G | p.Leu54Val | p.L54V | Q9HAC7 | protein_coding | tolerated(0.12) | possibly_damaging(0.591) | TCGA-C5-A1MK-01 | Cervix | cervical & endocervical cancer | Female | >=65 | III/IV | Chemotherapy | carboplatin | PD | |
| SUGCT | SNV | Missense_Mutation | rs747138567 | c.613N>T | p.Arg205Cys | p.R205C | Q9HAC7 | protein_coding | deleterious(0) | probably_damaging(0.993) | TCGA-AA-3510-01 | Colorectum | colon adenocarcinoma | Male | >=65 | I/II | Unknown | Unknown | SD |
| SUGCT | SNV | Missense_Mutation | c.890N>T | p.Gln297Leu | p.Q297L | Q9HAC7 | protein_coding | tolerated(1) | benign(0.056) | TCGA-AA-A010-01 | Colorectum | colon adenocarcinoma | Female | <65 | I/II | Chemotherapy | folinic | CR | |
| SUGCT | SNV | Missense_Mutation | rs759909394 | c.1246N>A | p.Val416Ile | p.V416I | Q9HAC7 | protein_coding | tolerated(0.19) | benign(0.007) | TCGA-D5-6531-01 | Colorectum | colon adenocarcinoma | Male | >=65 | I/II | Unknown | Unknown | SD |
| SUGCT | SNV | Missense_Mutation | c.154N>C | p.Lys52Gln | p.K52Q | Q9HAC7 | protein_coding | deleterious(0) | possibly_damaging(0.49) | TCGA-EI-6882-01 | Colorectum | rectum adenocarcinoma | Male | <65 | I/II | Unknown | Unknown | SD | |
| SUGCT | SNV | Missense_Mutation | rs376341860 | c.323N>A | p.Arg108Gln | p.R108Q | Q9HAC7 | protein_coding | deleterious(0) | probably_damaging(1) | TCGA-EI-6917-01 | Colorectum | rectum adenocarcinoma | Male | <65 | III/IV | Chemotherapy | 5fluorouracil+oxaciplatina+l-folinian | SD |
| SUGCT | SNV | Missense_Mutation | novel | c.696N>C | p.Lys232Asn | p.K232N | Q9HAC7 | protein_coding | deleterious(0.04) | possibly_damaging(0.809) | TCGA-EI-6917-01 | Colorectum | rectum adenocarcinoma | Male | <65 | III/IV | Chemotherapy | 5fluorouracil+oxaciplatina+l-folinian | SD |
| Page: 1 2 3 4 5 6 7 |
Top |
Related drugs of malignant transformation related genes |
| Identification of chemicals and drugs interact with genes involved in malignant transfromation |
| (DGIdb 4.0) |
| Entrez ID | Symbol | Category | Interaction Types | Drug Claim Name | Drug Name | PMIDs |
| 79783 | SUGCT | ENZYME | hormonal contraceptives for systemic use | 28750087 |
| Page: 1 |

Copyright 2023-Present -The University of Texas Health Science Center at Houston |