
|
|||||
|
 | |
| |
| |
| |
| |
| |
|
Gene: SUDS3 |
Gene summary for SUDS3 |
| Gene information | Species | Human | Gene symbol | SUDS3 | Gene ID | 64426 |
| Gene name | SDS3 homolog, SIN3A corepressor complex component | |
| Gene Alias | SAP45 | |
| Cytomap | 12q24.23 | |
| Gene Type | protein-coding | GO ID | GO:0000122 | UniProtAcc | Q9H7L9 |
Top |
Malignant transformation analysis |
| Identification of the aberrant gene expression in precancerous and cancerous lesions by comparing the gene expression of stem-like cells in diseased tissues with normal stem cells |
| Entrez ID | Symbol | Replicates | Species | Organ | Tissue | Adj P-value | Log2FC | Malignancy |
| 64426 | SUDS3 | LZE2T | Human | Esophagus | ESCC | 3.48e-05 | 5.45e-01 | 0.082 |
| 64426 | SUDS3 | LZE4T | Human | Esophagus | ESCC | 3.37e-13 | 3.42e-01 | 0.0811 |
| 64426 | SUDS3 | LZE5T | Human | Esophagus | ESCC | 4.30e-09 | 5.67e-01 | 0.0514 |
| 64426 | SUDS3 | LZE7T | Human | Esophagus | ESCC | 3.20e-09 | 3.08e-01 | 0.0667 |
| 64426 | SUDS3 | LZE8T | Human | Esophagus | ESCC | 2.21e-09 | 1.68e-01 | 0.067 |
| 64426 | SUDS3 | LZE20T | Human | Esophagus | ESCC | 1.25e-09 | 3.75e-01 | 0.0662 |
| 64426 | SUDS3 | LZE22D1 | Human | Esophagus | HGIN | 9.10e-04 | 2.19e-01 | 0.0595 |
| 64426 | SUDS3 | LZE22T | Human | Esophagus | ESCC | 1.26e-09 | 3.83e-01 | 0.068 |
| 64426 | SUDS3 | LZE24T | Human | Esophagus | ESCC | 5.37e-25 | 6.25e-01 | 0.0596 |
| 64426 | SUDS3 | LZE21T | Human | Esophagus | ESCC | 2.54e-02 | 3.01e-01 | 0.0655 |
| 64426 | SUDS3 | P1T-E | Human | Esophagus | ESCC | 1.42e-25 | 1.05e+00 | 0.0875 |
| 64426 | SUDS3 | P2T-E | Human | Esophagus | ESCC | 2.12e-61 | 1.16e+00 | 0.1177 |
| 64426 | SUDS3 | P4T-E | Human | Esophagus | ESCC | 1.96e-45 | 9.77e-01 | 0.1323 |
| 64426 | SUDS3 | P5T-E | Human | Esophagus | ESCC | 1.91e-25 | 6.52e-01 | 0.1327 |
| 64426 | SUDS3 | P8T-E | Human | Esophagus | ESCC | 7.05e-42 | 8.35e-01 | 0.0889 |
| 64426 | SUDS3 | P9T-E | Human | Esophagus | ESCC | 8.31e-22 | 3.56e-01 | 0.1131 |
| 64426 | SUDS3 | P10T-E | Human | Esophagus | ESCC | 2.91e-19 | 4.38e-01 | 0.116 |
| 64426 | SUDS3 | P11T-E | Human | Esophagus | ESCC | 3.28e-16 | 5.88e-01 | 0.1426 |
| 64426 | SUDS3 | P12T-E | Human | Esophagus | ESCC | 2.32e-20 | 4.94e-01 | 0.1122 |
| 64426 | SUDS3 | P15T-E | Human | Esophagus | ESCC | 1.90e-34 | 8.04e-01 | 0.1149 |
| Page: 1 2 3 4 5 6 |
| Tissue | Expression Dynamics | Abbreviation |
| Esophagus | 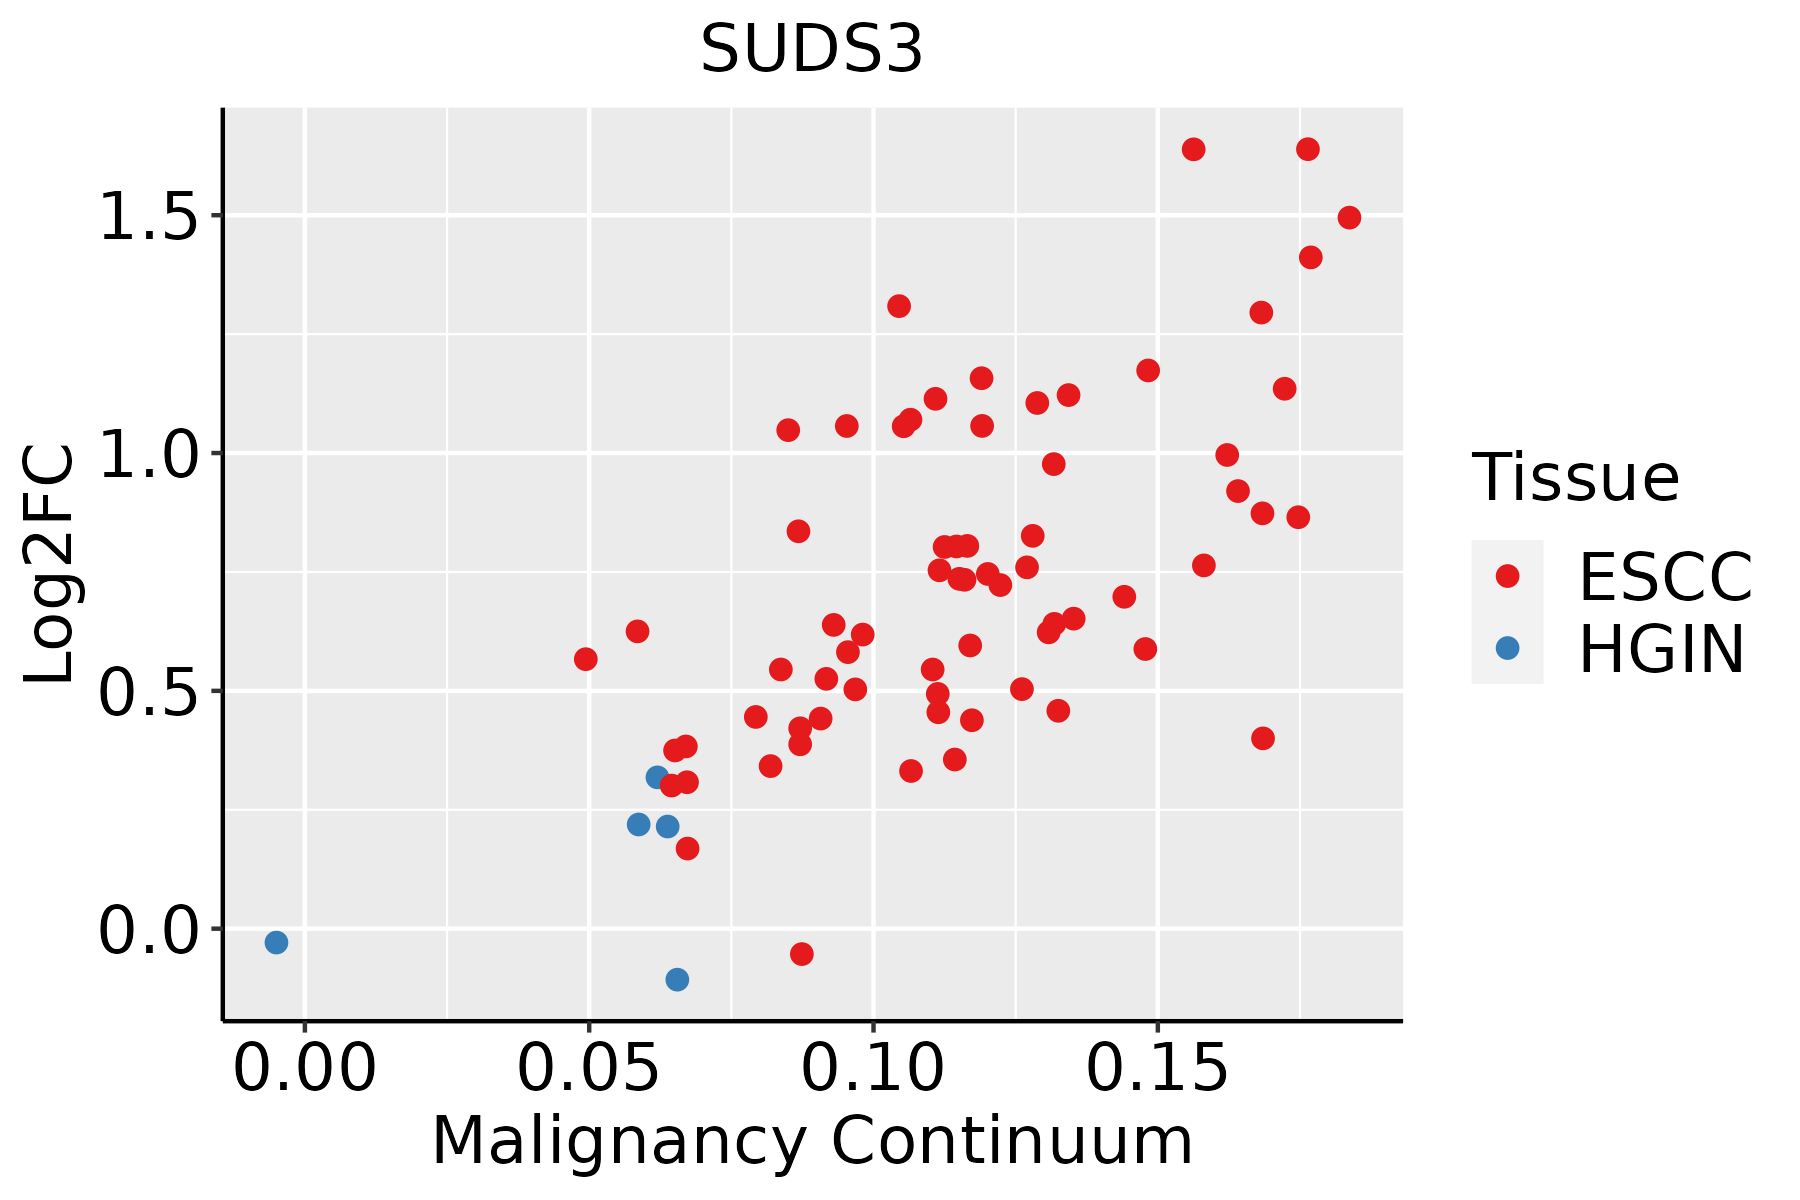 | ESCC: Esophageal squamous cell carcinoma |
| HGIN: High-grade intraepithelial neoplasias | ||
| LGIN: Low-grade intraepithelial neoplasias | ||
| Liver | 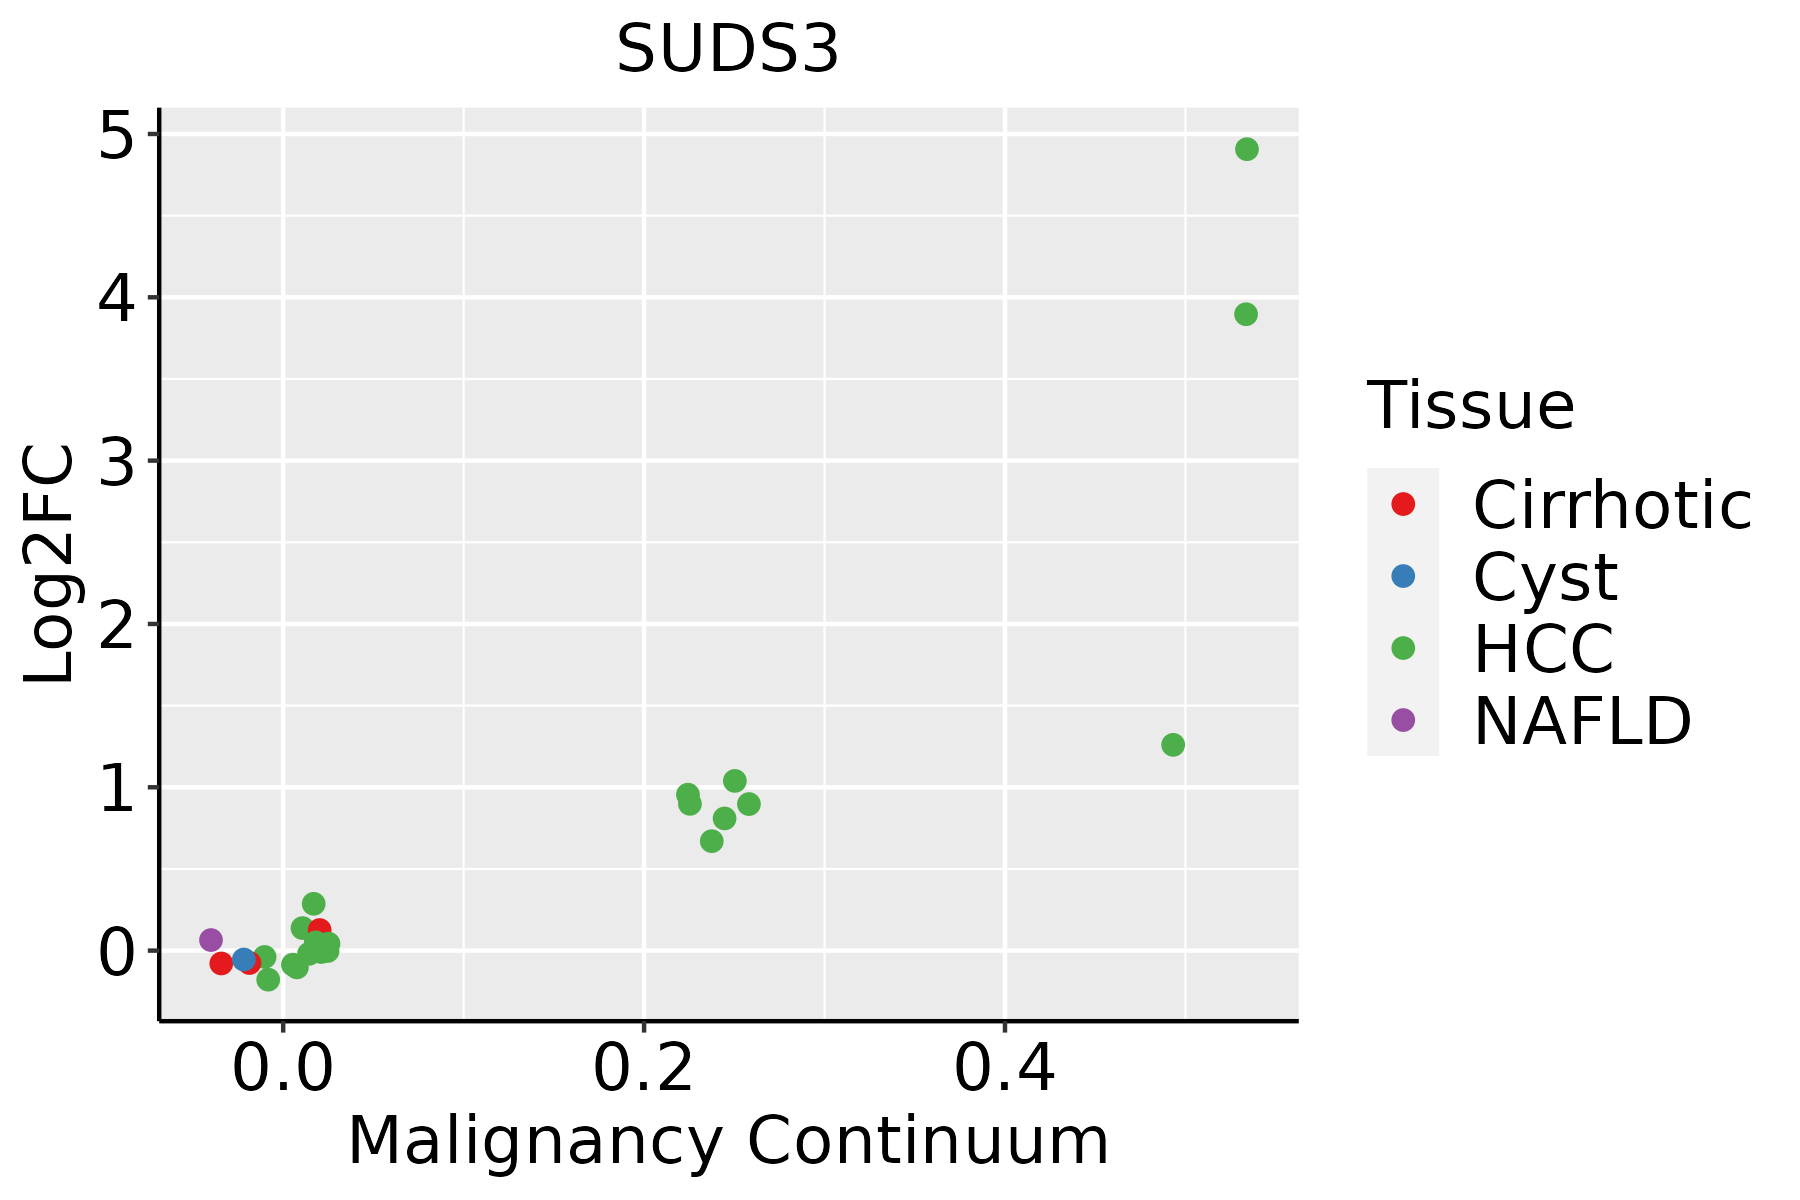 | HCC: Hepatocellular carcinoma |
| NAFLD: Non-alcoholic fatty liver disease | ||
| Oral Cavity | 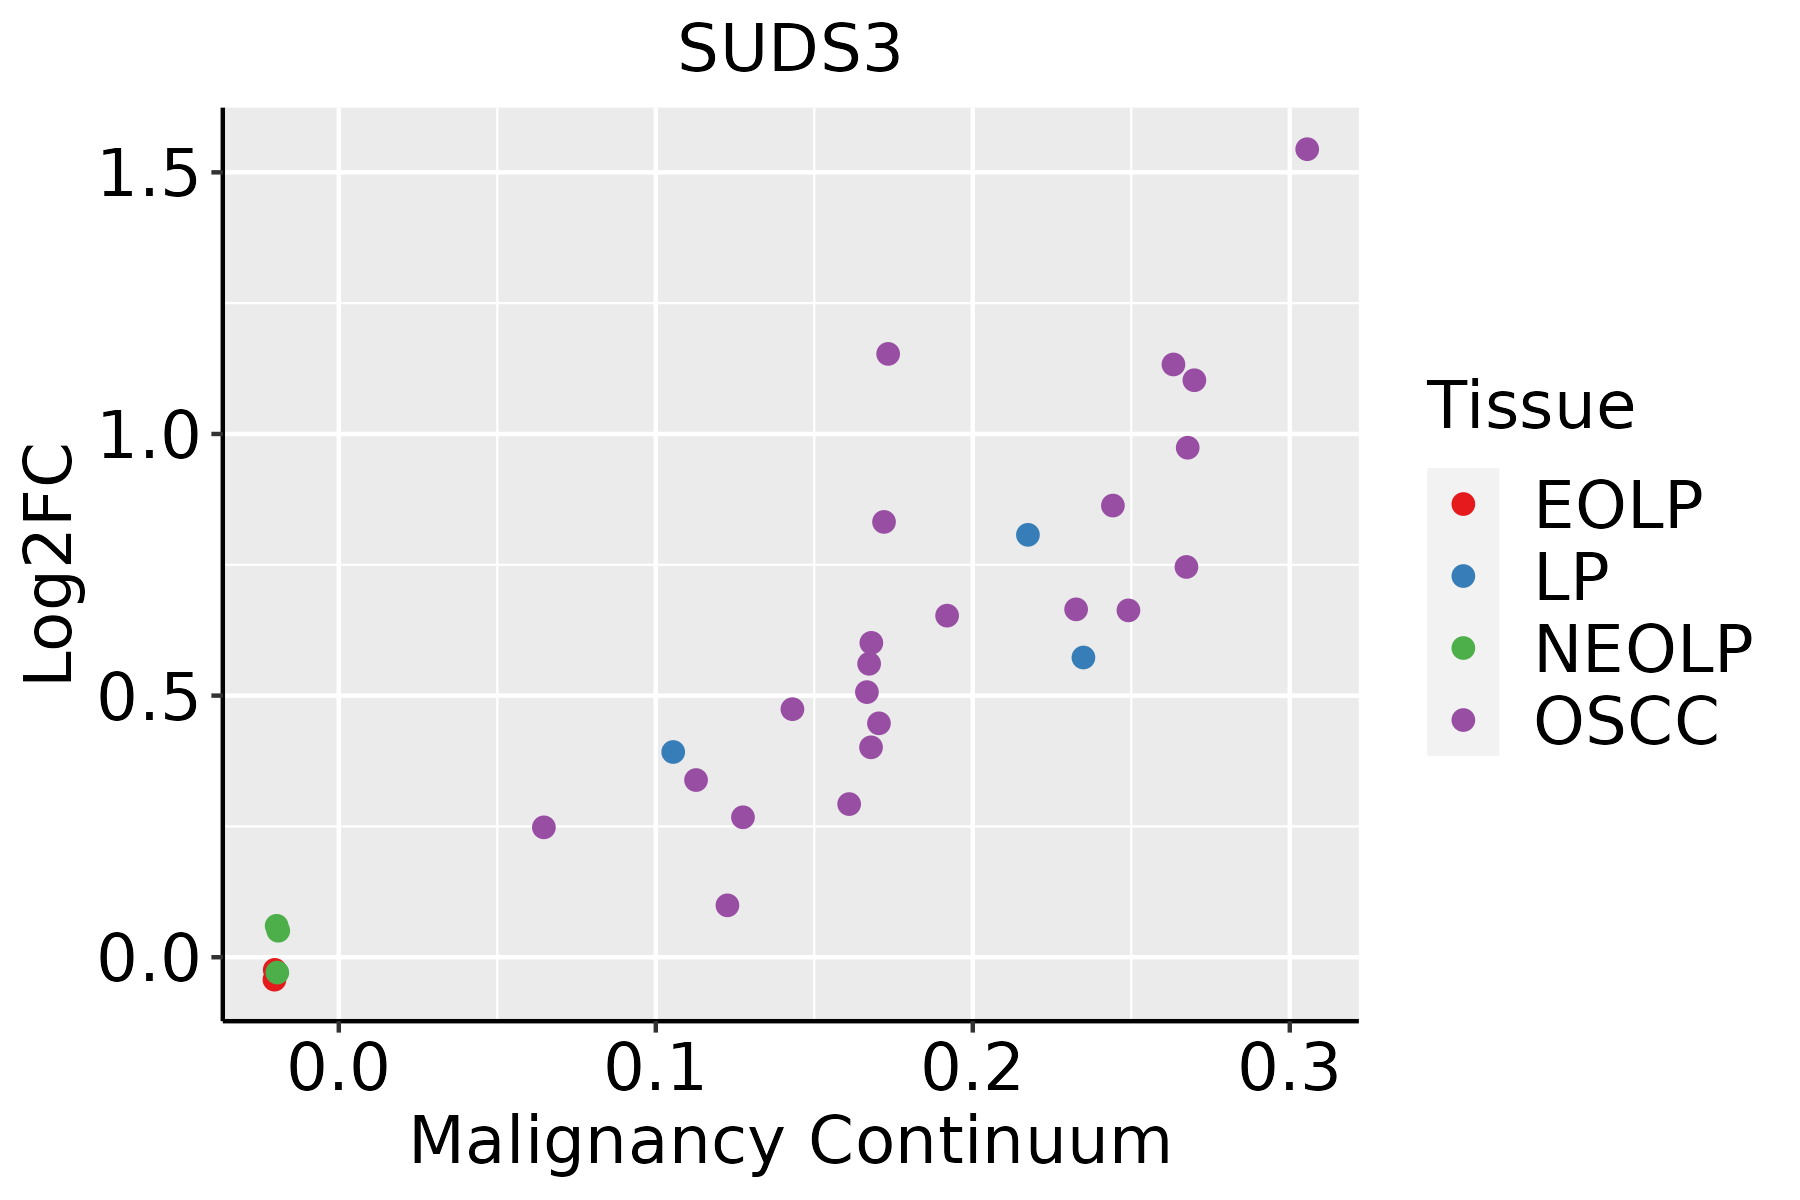 | EOLP: Erosive Oral lichen planus |
| LP: leukoplakia | ||
| NEOLP: Non-erosive oral lichen planus | ||
| OSCC: Oral squamous cell carcinoma | ||
| Prostate | 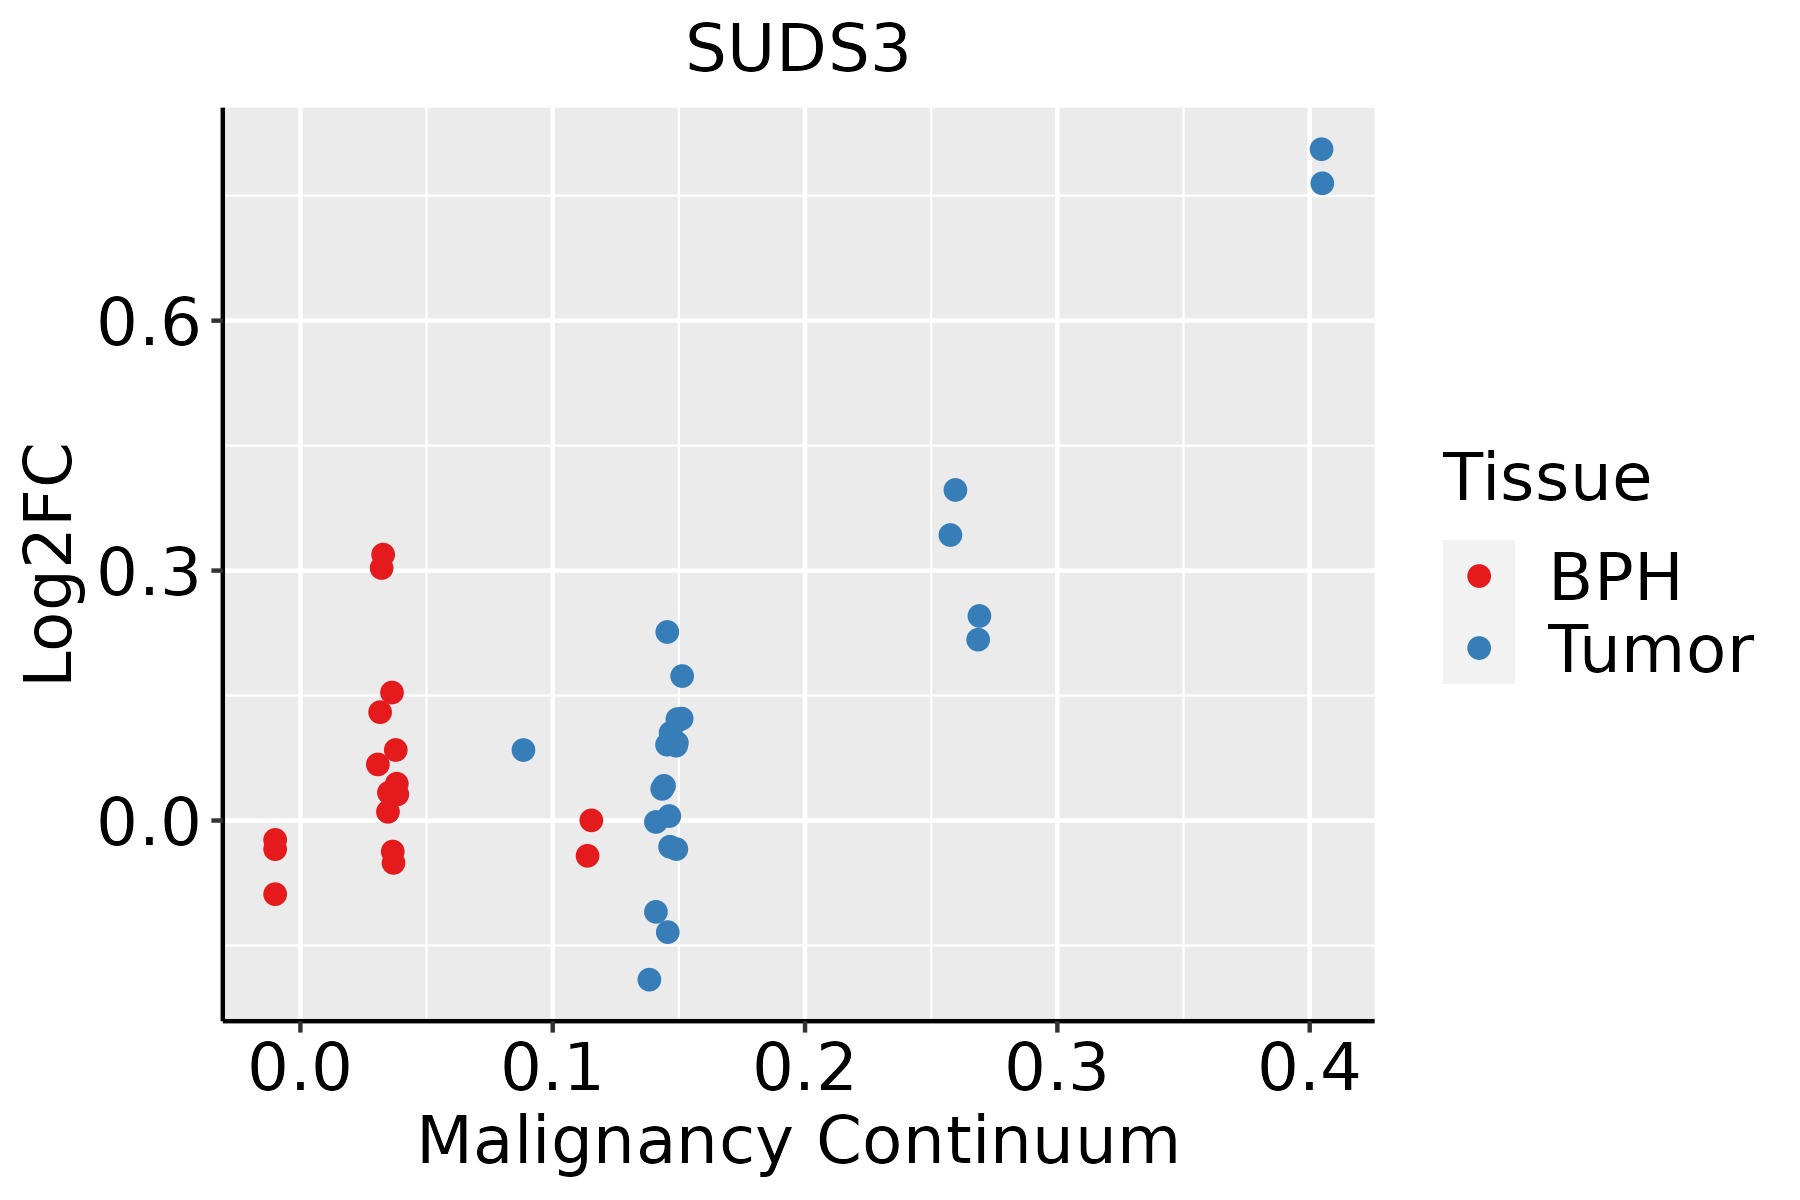 | BPH: Benign Prostatic Hyperplasia |
| Skin |  | AK: Actinic keratosis |
| cSCC: Cutaneous squamous cell carcinoma | ||
| SCCIS:squamous cell carcinoma in situ | ||
| Thyroid | 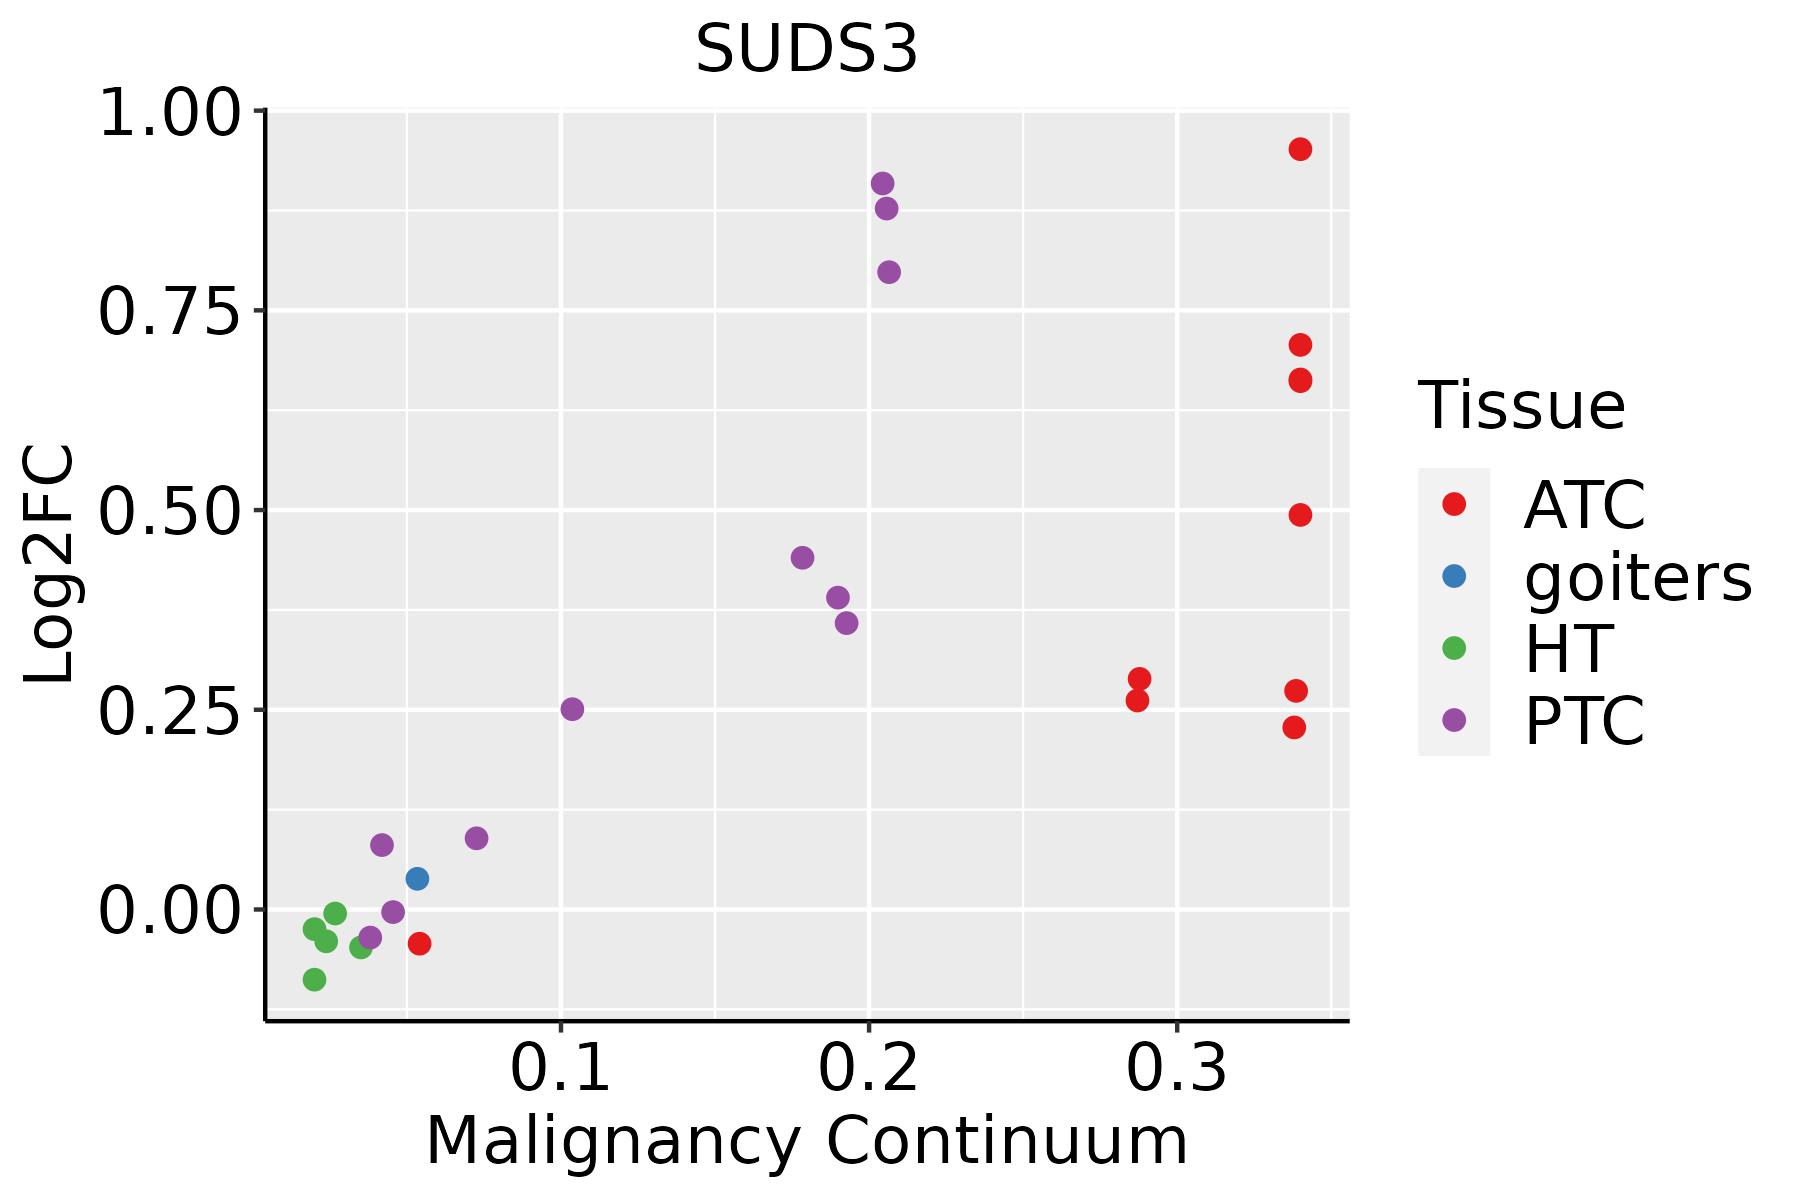 | ATC: Anaplastic thyroid cancer |
| HT: Hashimoto's thyroiditis | ||
| PTC: Papillary thyroid cancer |
| ∗log2FC in expression of this searched gene in stem-like cells from each diseased tissue sample relative to stem-like cells in normal samples in each tissue plotted against the malignancy continuum. Samples are colored based on if they are from different disease stage. |
Top |
Malignant transformation related pathway analysis |
| Find out the enriched GO biological processes and KEGG pathways involved in transition from healthy to precancer to cancer |
| Tissue | Disease Stage | Enriched GO biological Processes |
| Colorectum | AD |  |
| Colorectum | SER |  |
| Colorectum | MSS |  |
| Colorectum | MSI-H |  |
| Colorectum | FAP |  |
| ∗Top 15 enriched GO BP terms are showed in the bar plot of each disease state in each tissue. Each row represents a significant GO biological process which is colored according to the -log10(p.adjust). |
| Page: 1 2 3 4 5 6 7 8 9 |
| GO ID | Tissue | Disease Stage | Description | Gene Ratio | Bg Ratio | pvalue | p.adjust | Count |
| GO:00165708 | Esophagus | HGIN | histone modification | 92/2587 | 463/18723 | 1.70e-04 | 3.30e-03 | 92 |
| GO:002176220 | Esophagus | HGIN | substantia nigra development | 14/2587 | 44/18723 | 1.75e-03 | 1.90e-02 | 14 |
| GO:001657015 | Esophagus | ESCC | histone modification | 323/8552 | 463/18723 | 2.61e-26 | 7.88e-24 | 323 |
| GO:00356015 | Esophagus | ESCC | protein deacylation | 79/8552 | 112/18723 | 8.30e-08 | 1.42e-06 | 79 |
| GO:00987325 | Esophagus | ESCC | macromolecule deacylation | 80/8552 | 116/18723 | 3.19e-07 | 4.50e-06 | 80 |
| GO:00165754 | Esophagus | ESCC | histone deacetylation | 60/8552 | 82/18723 | 3.85e-07 | 5.32e-06 | 60 |
| GO:00064765 | Esophagus | ESCC | protein deacetylation | 70/8552 | 101/18723 | 1.29e-06 | 1.58e-05 | 70 |
| GO:0021762111 | Esophagus | ESCC | substantia nigra development | 35/8552 | 44/18723 | 4.40e-06 | 4.69e-05 | 35 |
| GO:004885718 | Esophagus | ESCC | neural nucleus development | 44/8552 | 64/18723 | 1.59e-04 | 1.05e-03 | 44 |
| GO:003090118 | Esophagus | ESCC | midbrain development | 58/8552 | 90/18723 | 2.52e-04 | 1.55e-03 | 58 |
| GO:002176212 | Liver | Cirrhotic | substantia nigra development | 25/4634 | 44/18723 | 5.57e-06 | 9.10e-05 | 25 |
| GO:001657011 | Liver | Cirrhotic | histone modification | 154/4634 | 463/18723 | 1.92e-05 | 2.57e-04 | 154 |
| GO:004885712 | Liver | Cirrhotic | neural nucleus development | 28/4634 | 64/18723 | 6.78e-04 | 5.08e-03 | 28 |
| GO:003090111 | Liver | Cirrhotic | midbrain development | 35/4634 | 90/18723 | 2.06e-03 | 1.28e-02 | 35 |
| GO:0035601 | Liver | Cirrhotic | protein deacylation | 39/4634 | 112/18723 | 1.08e-02 | 4.75e-02 | 39 |
| GO:001657021 | Liver | HCC | histone modification | 283/7958 | 463/18723 | 2.68e-16 | 2.33e-14 | 283 |
| GO:002176222 | Liver | HCC | substantia nigra development | 33/7958 | 44/18723 | 1.21e-05 | 1.38e-04 | 33 |
| GO:003090121 | Liver | HCC | midbrain development | 54/7958 | 90/18723 | 6.04e-04 | 3.79e-03 | 54 |
| GO:0098732 | Liver | HCC | macromolecule deacylation | 67/7958 | 116/18723 | 6.46e-04 | 3.99e-03 | 67 |
| GO:00356011 | Liver | HCC | protein deacylation | 64/7958 | 112/18723 | 1.23e-03 | 6.83e-03 | 64 |
| Page: 1 2 3 4 |
| Pathway ID | Tissue | Disease Stage | Description | Gene Ratio | Bg Ratio | pvalue | p.adjust | qvalue | Count |
| Page: 1 |
Top |
Cell-cell communication analysis |
| Identification of potential cell-cell interactions between two cell types and their ligand-receptor pairs for different disease states |
| Ligand | Receptor | LRpair | Pathway | Tissue | Disease Stage |
| Page: 1 |
Top |
Single-cell gene regulatory network inference analysis |
| Find out the significant the regulons (TFs) and the target genes of each regulon across cell types for different disease states |
| TF | Cell Type | Tissue | Disease Stage | Target Gene | RSS | Regulon Activity |
| ∗The dot plots of a searched regulon are shown for all cell subpopulations in each disease state of each tissue based on the regulon specific score inferred using pySCENIC and by calculating the average expression. |
| Page: 1 |
Top |
Somatic mutation of malignant transformation related genes |
| Annotation of somatic variants for genes involved in malignant transformation |
| Hugo Symbol | Variant Class | Variant Classification | dbSNP RS | HGVSc | HGVSp | HGVSp Short | SWISSPROT | BIOTYPE | SIFT | PolyPhen | Tumor Sample Barcode | Tissue | Histology | Sex | Age | Stage | Therapy Types | Drugs | Outcome |
| SUDS3 | SNV | Missense_Mutation | c.743N>T | p.Ser248Phe | p.S248F | Q9H7L9 | protein_coding | tolerated(0.06) | benign(0.364) | TCGA-GM-A2D9-01 | Breast | breast invasive carcinoma | Female | >=65 | I/II | Hormone Therapy | arimidex | SD | |
| SUDS3 | SNV | Missense_Mutation | novel | c.297N>C | p.Met99Ile | p.M99I | Q9H7L9 | protein_coding | tolerated(0.08) | benign(0.003) | TCGA-HN-A2NL-01 | Breast | breast invasive carcinoma | Female | <65 | I/II | Chemotherapy | cyclophosphamide | SD |
| SUDS3 | SNV | Missense_Mutation | novel | c.293N>T | p.Arg98Ile | p.R98I | Q9H7L9 | protein_coding | deleterious(0.02) | probably_damaging(0.985) | TCGA-F5-6814-01 | Colorectum | rectum adenocarcinoma | Male | <65 | I/II | Unknown | Unknown | SD |
| SUDS3 | insertion | Frame_Shift_Ins | novel | c.303dupA | p.Leu102ThrfsTer21 | p.L102Tfs*21 | Q9H7L9 | protein_coding | TCGA-AA-A01P-01 | Colorectum | colon adenocarcinoma | Female | >=65 | III/IV | Unknown | Unknown | PD | ||
| SUDS3 | SNV | Missense_Mutation | c.973C>T | p.Arg325Cys | p.R325C | Q9H7L9 | protein_coding | deleterious(0) | probably_damaging(0.982) | TCGA-A5-A0G2-01 | Endometrium | uterine corpus endometrioid carcinoma | Female | <65 | III/IV | Unknown | Unknown | SD | |
| SUDS3 | SNV | Missense_Mutation | novel | c.914G>A | p.Ser305Asn | p.S305N | Q9H7L9 | protein_coding | tolerated(0.35) | possibly_damaging(0.878) | TCGA-A5-A1OF-01 | Endometrium | uterine corpus endometrioid carcinoma | Female | <65 | I/II | Unknown | Unknown | SD |
| SUDS3 | SNV | Missense_Mutation | novel | c.604N>T | p.Pro202Ser | p.P202S | Q9H7L9 | protein_coding | deleterious(0.04) | probably_damaging(0.992) | TCGA-AJ-A3EK-01 | Endometrium | uterine corpus endometrioid carcinoma | Female | <65 | I/II | Chemotherapy | carboplatin | CR |
| SUDS3 | SNV | Missense_Mutation | c.439A>G | p.Lys147Glu | p.K147E | Q9H7L9 | protein_coding | deleterious(0.01) | probably_damaging(0.982) | TCGA-AP-A056-01 | Endometrium | uterine corpus endometrioid carcinoma | Female | <65 | I/II | Unknown | Unknown | SD | |
| SUDS3 | SNV | Missense_Mutation | c.328N>G | p.Ile110Val | p.I110V | Q9H7L9 | protein_coding | tolerated(0.18) | benign(0.025) | TCGA-AP-A0LM-01 | Endometrium | uterine corpus endometrioid carcinoma | Female | <65 | III/IV | Chemotherapy | cisplatin | SD | |
| SUDS3 | SNV | Missense_Mutation | c.383N>G | p.Tyr128Cys | p.Y128C | Q9H7L9 | protein_coding | tolerated(0.16) | probably_damaging(0.997) | TCGA-AP-A0LM-01 | Endometrium | uterine corpus endometrioid carcinoma | Female | <65 | III/IV | Chemotherapy | cisplatin | SD |
| Page: 1 2 3 4 |
Top |
Related drugs of malignant transformation related genes |
| Identification of chemicals and drugs interact with genes involved in malignant transfromation |
| (DGIdb 4.0) |
| Entrez ID | Symbol | Category | Interaction Types | Drug Claim Name | Drug Name | PMIDs |
| Page: 1 |

Copyright 2023-Present -The University of Texas Health Science Center at Houston |