| Tissue | Expression Dynamics | Abbreviation |
| Cervix | 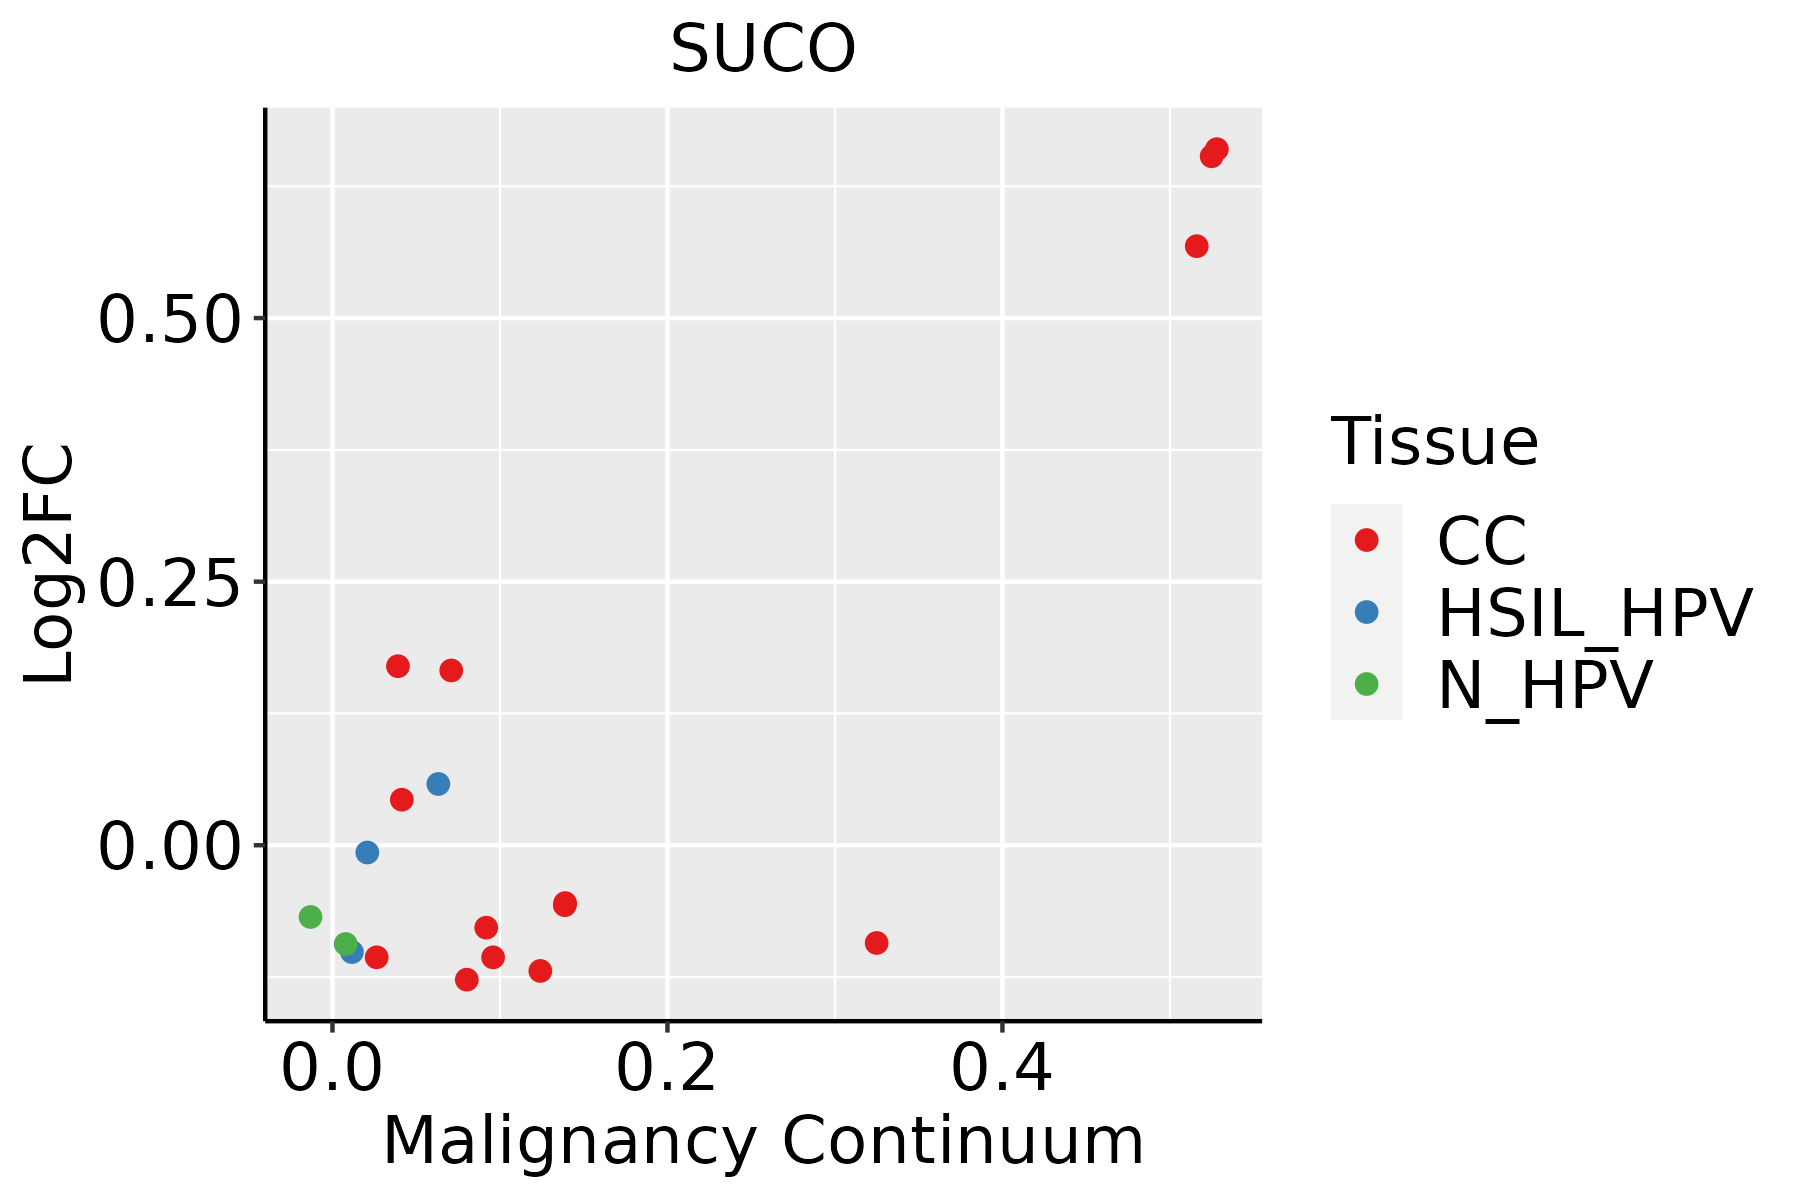 | CC: Cervix cancer |
| HSIL_HPV: HPV-infected high-grade squamous intraepithelial lesions |
| N_HPV: HPV-infected normal cervix |
| Esophagus | 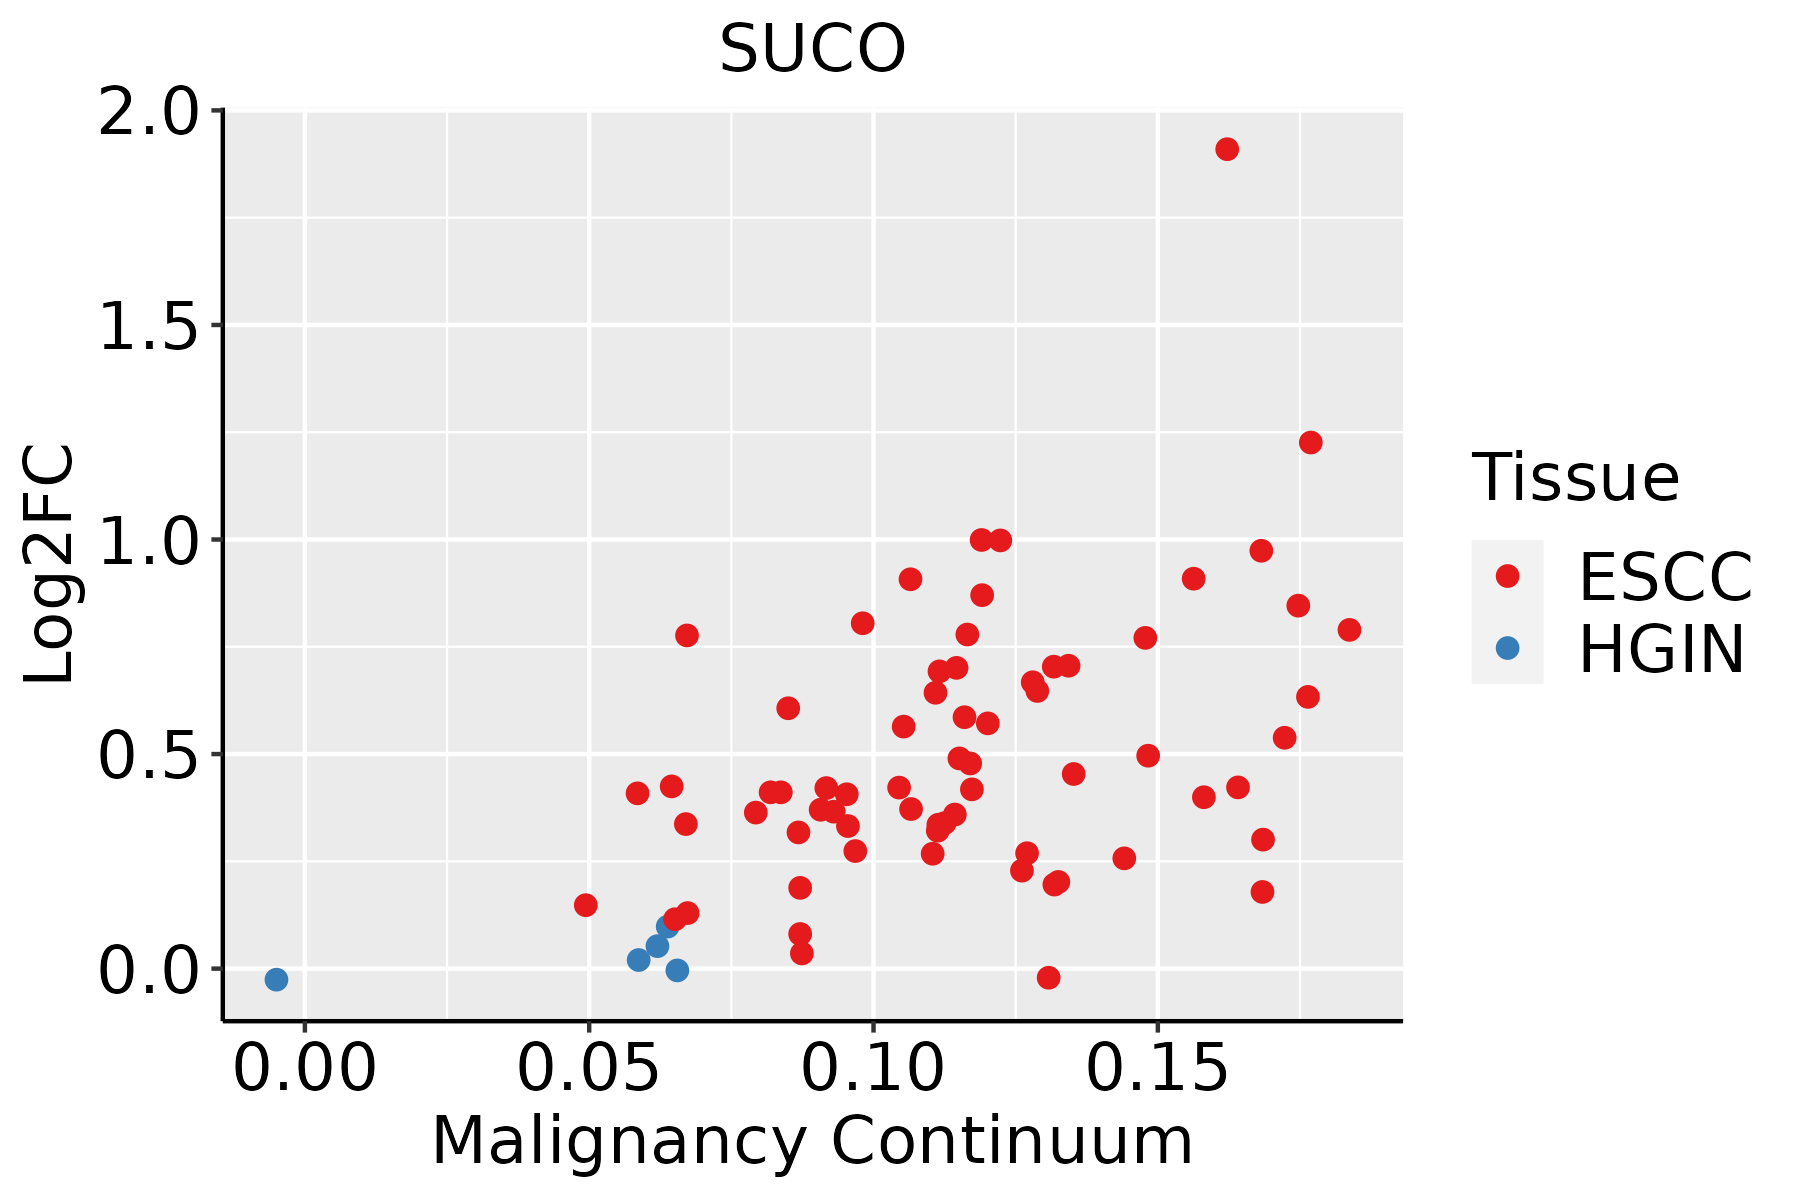 | ESCC: Esophageal squamous cell carcinoma |
| HGIN: High-grade intraepithelial neoplasias |
| LGIN: Low-grade intraepithelial neoplasias |
| Liver |  | HCC: Hepatocellular carcinoma |
| NAFLD: Non-alcoholic fatty liver disease |
| Oral Cavity | 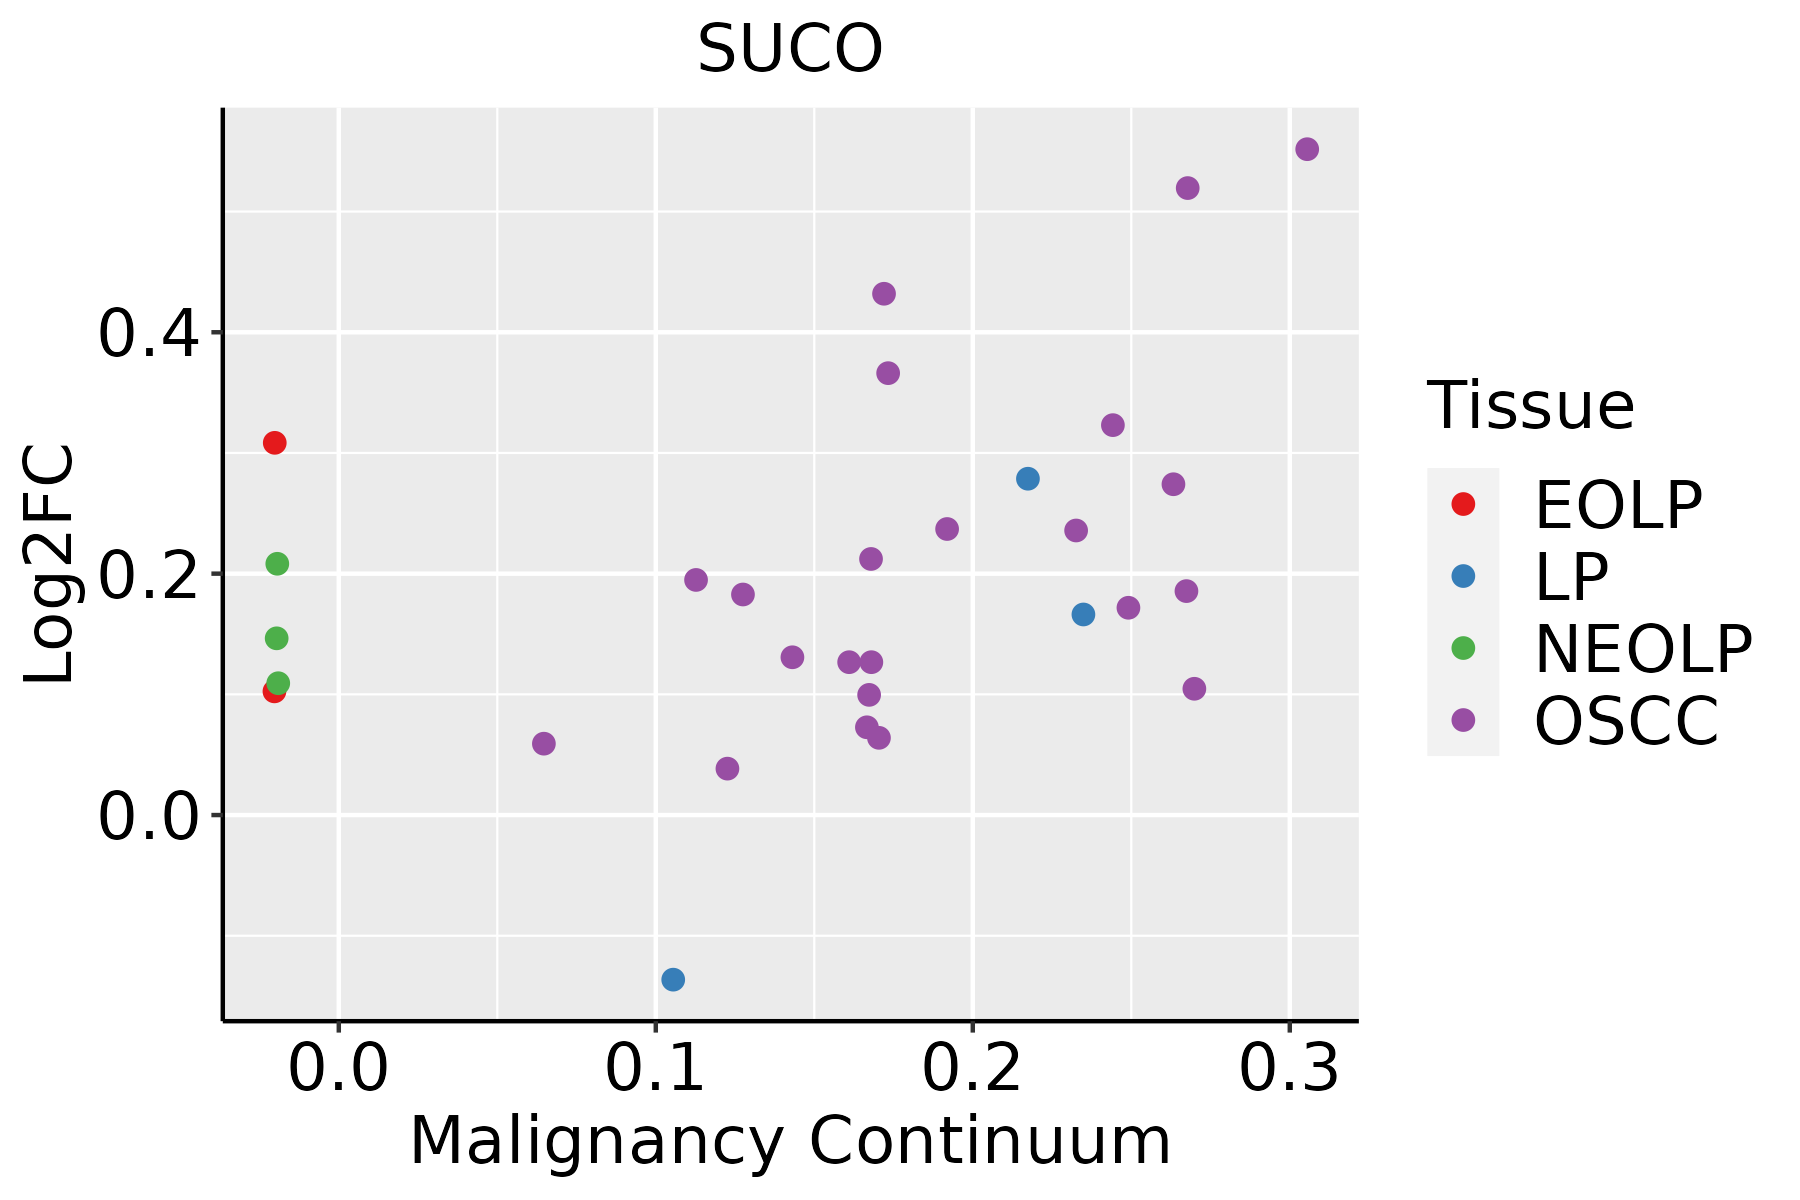 | EOLP: Erosive Oral lichen planus |
| LP: leukoplakia |
| NEOLP: Non-erosive oral lichen planus |
| OSCC: Oral squamous cell carcinoma |
| Prostate | 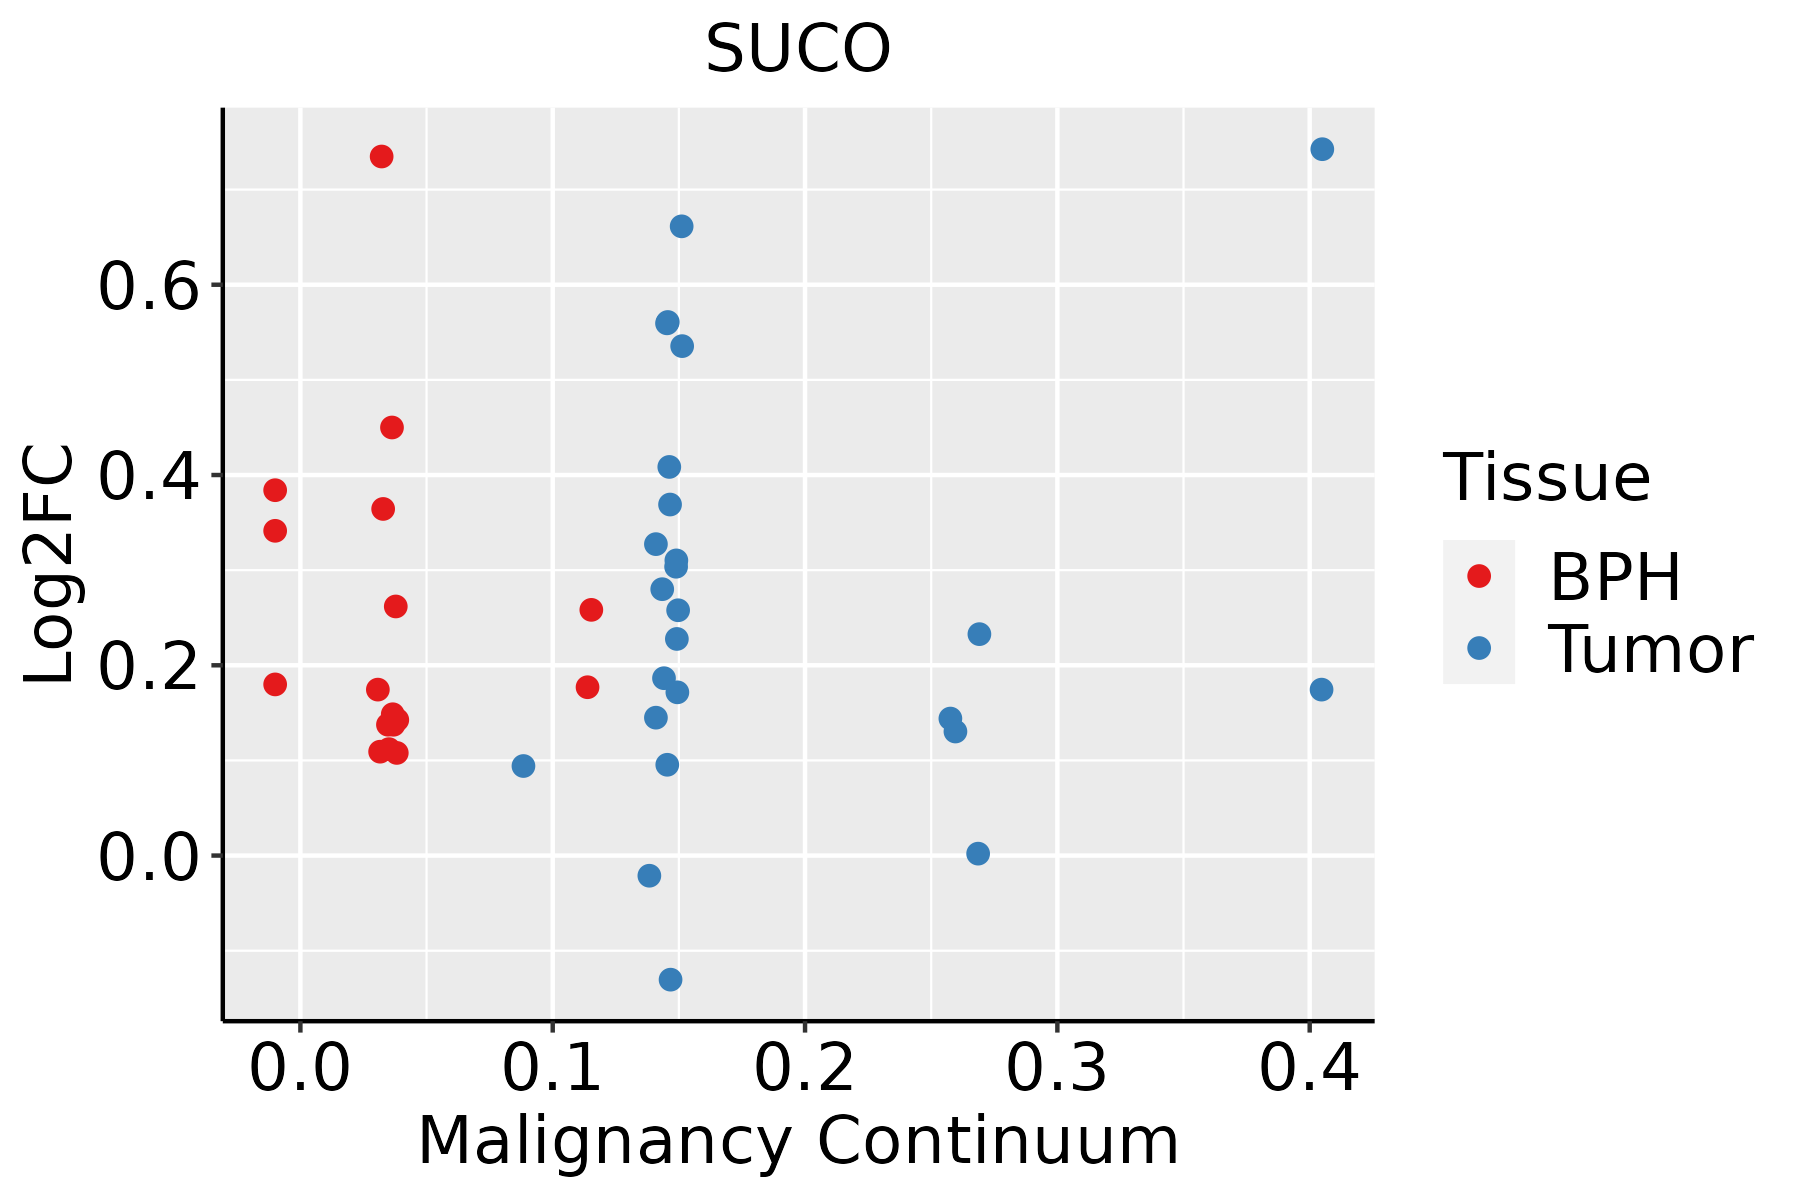 | BPH: Benign Prostatic Hyperplasia |
| Thyroid |  | ATC: Anaplastic thyroid cancer |
| HT: Hashimoto's thyroiditis |
| PTC: Papillary thyroid cancer |
| GO ID | Tissue | Disease Stage | Description | Gene Ratio | Bg Ratio | pvalue | p.adjust | Count |
| GO:00016497 | Cervix | CC | osteoblast differentiation | 47/2311 | 229/18723 | 2.88e-04 | 3.11e-03 | 47 |
| GO:0045667 | Cervix | CC | regulation of osteoblast differentiation | 29/2311 | 132/18723 | 1.32e-03 | 1.05e-02 | 29 |
| GO:00015037 | Cervix | CC | ossification | 71/2311 | 408/18723 | 1.67e-03 | 1.28e-02 | 71 |
| GO:00487712 | Cervix | CC | tissue remodeling | 34/2311 | 175/18723 | 4.68e-03 | 2.82e-02 | 34 |
| GO:0045669 | Cervix | CC | positive regulation of osteoblast differentiation | 16/2311 | 69/18723 | 8.75e-03 | 4.48e-02 | 16 |
| GO:000164918 | Esophagus | ESCC | osteoblast differentiation | 140/8552 | 229/18723 | 1.63e-06 | 1.95e-05 | 140 |
| GO:000150317 | Esophagus | ESCC | ossification | 232/8552 | 408/18723 | 3.00e-06 | 3.40e-05 | 232 |
| GO:00456675 | Esophagus | ESCC | regulation of osteoblast differentiation | 77/8552 | 132/18723 | 2.28e-03 | 1.00e-02 | 77 |
| GO:00329631 | Esophagus | ESCC | collagen metabolic process | 62/8552 | 104/18723 | 2.90e-03 | 1.22e-02 | 62 |
| GO:00456695 | Esophagus | ESCC | positive regulation of osteoblast differentiation | 43/8552 | 69/18723 | 3.93e-03 | 1.59e-02 | 43 |
| GO:000164911 | Liver | HCC | osteoblast differentiation | 115/7958 | 229/18723 | 1.08e-02 | 3.99e-02 | 115 |
| GO:000150310 | Oral cavity | OSCC | ossification | 203/7305 | 408/18723 | 5.54e-06 | 6.19e-05 | 203 |
| GO:000164910 | Oral cavity | OSCC | osteoblast differentiation | 118/7305 | 229/18723 | 7.51e-05 | 5.85e-04 | 118 |
| GO:0032963 | Oral cavity | OSCC | collagen metabolic process | 54/7305 | 104/18723 | 5.00e-03 | 1.96e-02 | 54 |
| GO:00487713 | Oral cavity | OSCC | tissue remodeling | 84/7305 | 175/18723 | 9.39e-03 | 3.36e-02 | 84 |
| GO:00456674 | Oral cavity | OSCC | regulation of osteoblast differentiation | 65/7305 | 132/18723 | 1.06e-02 | 3.60e-02 | 65 |
| GO:000150322 | Oral cavity | EOLP | ossification | 70/2218 | 408/18723 | 8.89e-04 | 6.81e-03 | 70 |
| GO:000164922 | Oral cavity | EOLP | osteoblast differentiation | 41/2218 | 229/18723 | 4.47e-03 | 2.42e-02 | 41 |
| GO:0032964 | Oral cavity | EOLP | collagen biosynthetic process | 13/2218 | 51/18723 | 5.43e-03 | 2.82e-02 | 13 |
| GO:0010712 | Oral cavity | EOLP | regulation of collagen metabolic process | 12/2218 | 47/18723 | 7.31e-03 | 3.54e-02 | 12 |
| Hugo Symbol | Variant Class | Variant Classification | dbSNP RS | HGVSc | HGVSp | HGVSp Short | SWISSPROT | BIOTYPE | SIFT | PolyPhen | Tumor Sample Barcode | Tissue | Histology | Sex | Age | Stage | Therapy Types | Drugs | Outcome |
| SUCO | SNV | Missense_Mutation | novel | c.2890N>G | p.Ser964Ala | p.S964A | Q9UBS9 | protein_coding | tolerated_low_confidence(0.21) | benign(0.011) | TCGA-A8-A0A4-01 | Breast | breast invasive carcinoma | Female | >=65 | I/II | Hormone Therapy | tamoxiphen | CR |
| SUCO | SNV | Missense_Mutation | | c.28C>G | p.Leu10Val | p.L10V | Q9UBS9 | protein_coding | tolerated_low_confidence(0.22) | benign(0) | TCGA-A8-A0A6-01 | Breast | breast invasive carcinoma | Female | <65 | III/IV | Chemotherapy | epirubicin | CR |
| SUCO | SNV | Missense_Mutation | novel | c.3992G>A | p.Gly1331Asp | p.G1331D | Q9UBS9 | protein_coding | deleterious_low_confidence(0) | probably_damaging(0.995) | TCGA-A8-A0A9-01 | Breast | breast invasive carcinoma | Female | >=65 | I/II | Hormone Therapy | anastrozole | SD |
| SUCO | SNV | Missense_Mutation | | c.715G>C | p.Asp239His | p.D239H | Q9UBS9 | protein_coding | deleterious_low_confidence(0.03) | possibly_damaging(0.874) | TCGA-AC-A23H-01 | Breast | breast invasive carcinoma | Female | >=65 | I/II | Unknown | Unknown | PD |
| SUCO | SNV | Missense_Mutation | | c.3121G>A | p.Glu1041Lys | p.E1041K | Q9UBS9 | protein_coding | deleterious(0) | probably_damaging(0.991) | TCGA-AC-A23H-01 | Breast | breast invasive carcinoma | Female | >=65 | I/II | Unknown | Unknown | PD |
| SUCO | SNV | Missense_Mutation | rs770645022 | c.1105A>G | p.Lys369Glu | p.K369E | Q9UBS9 | protein_coding | deleterious_low_confidence(0.04) | possibly_damaging(0.542) | TCGA-AN-A046-01 | Breast | breast invasive carcinoma | Female | >=65 | I/II | Unknown | Unknown | SD |
| SUCO | SNV | Missense_Mutation | | c.3497N>C | p.Val1166Ala | p.V1166A | Q9UBS9 | protein_coding | deleterious(0.03) | benign(0.036) | TCGA-AN-A0AK-01 | Breast | breast invasive carcinoma | Female | >=65 | I/II | Unknown | Unknown | SD |
| SUCO | SNV | Missense_Mutation | | c.2617N>C | p.Glu873Gln | p.E873Q | Q9UBS9 | protein_coding | deleterious_low_confidence(0) | probably_damaging(0.975) | TCGA-BH-A0DZ-01 | Breast | breast invasive carcinoma | Female | <65 | I/II | Chemotherapy | docetaxel | SD |
| SUCO | SNV | Missense_Mutation | | c.2281G>C | p.Glu761Gln | p.E761Q | Q9UBS9 | protein_coding | tolerated(0.09) | benign(0.067) | TCGA-BH-A209-01 | Breast | breast invasive carcinoma | Female | >=65 | I/II | Unknown | Unknown | SD |
| SUCO | SNV | Missense_Mutation | | c.3101N>T | p.Thr1034Ile | p.T1034I | Q9UBS9 | protein_coding | deleterious(0) | probably_damaging(0.992) | TCGA-D8-A140-01 | Breast | breast invasive carcinoma | Female | <65 | I/II | Chemotherapy | doxorubicin+cyclophosphamid | SD |


