
|
|||||
|
 | |
| |
| |
| |
| |
| |
|
Gene: SUCLG1 |
Gene summary for SUCLG1 |
| Gene information | Species | Human | Gene symbol | SUCLG1 | Gene ID | 8802 |
| Gene name | succinate-CoA ligase GDP/ADP-forming subunit alpha | |
| Gene Alias | GALPHA | |
| Cytomap | 2p11.2 | |
| Gene Type | protein-coding | GO ID | GO:0006091 | UniProtAcc | P53597 |
Top |
Malignant transformation analysis |
| Identification of the aberrant gene expression in precancerous and cancerous lesions by comparing the gene expression of stem-like cells in diseased tissues with normal stem cells |
| Entrez ID | Symbol | Replicates | Species | Organ | Tissue | Adj P-value | Log2FC | Malignancy |
| 8802 | SUCLG1 | HTA11_347_2000001011 | Human | Colorectum | AD | 1.85e-19 | 7.04e-01 | -0.1954 |
| 8802 | SUCLG1 | HTA11_83_2000001011 | Human | Colorectum | SER | 2.04e-03 | 5.36e-01 | -0.1526 |
| 8802 | SUCLG1 | HTA11_99999965104_69814 | Human | Colorectum | MSS | 1.70e-02 | 4.10e-01 | 0.281 |
| 8802 | SUCLG1 | F007 | Human | Colorectum | FAP | 3.05e-03 | -3.65e-01 | 0.1176 |
| 8802 | SUCLG1 | A001-C-207 | Human | Colorectum | FAP | 3.19e-05 | -3.38e-01 | 0.1278 |
| 8802 | SUCLG1 | A015-C-203 | Human | Colorectum | FAP | 1.40e-17 | -2.89e-01 | -0.1294 |
| 8802 | SUCLG1 | A015-C-204 | Human | Colorectum | FAP | 5.86e-03 | -2.11e-01 | -0.0228 |
| 8802 | SUCLG1 | A002-C-201 | Human | Colorectum | FAP | 1.59e-08 | -3.02e-01 | 0.0324 |
| 8802 | SUCLG1 | A002-C-203 | Human | Colorectum | FAP | 1.60e-06 | -2.98e-01 | 0.2786 |
| 8802 | SUCLG1 | A001-C-119 | Human | Colorectum | FAP | 3.06e-03 | -2.59e-01 | -0.1557 |
| 8802 | SUCLG1 | A001-C-108 | Human | Colorectum | FAP | 1.44e-12 | -2.87e-01 | -0.0272 |
| 8802 | SUCLG1 | A002-C-205 | Human | Colorectum | FAP | 1.32e-12 | -2.69e-01 | -0.1236 |
| 8802 | SUCLG1 | A001-C-104 | Human | Colorectum | FAP | 6.17e-03 | -2.33e-01 | 0.0184 |
| 8802 | SUCLG1 | A015-C-005 | Human | Colorectum | FAP | 1.25e-03 | -2.63e-01 | -0.0336 |
| 8802 | SUCLG1 | A015-C-006 | Human | Colorectum | FAP | 1.24e-09 | -3.94e-01 | -0.0994 |
| 8802 | SUCLG1 | A015-C-106 | Human | Colorectum | FAP | 2.09e-12 | -3.41e-01 | -0.0511 |
| 8802 | SUCLG1 | A002-C-114 | Human | Colorectum | FAP | 8.43e-11 | -3.56e-01 | -0.1561 |
| 8802 | SUCLG1 | A015-C-104 | Human | Colorectum | FAP | 5.05e-18 | -2.28e-01 | -0.1899 |
| 8802 | SUCLG1 | A001-C-014 | Human | Colorectum | FAP | 8.09e-11 | -2.66e-01 | 0.0135 |
| 8802 | SUCLG1 | A002-C-016 | Human | Colorectum | FAP | 2.01e-11 | -2.24e-01 | 0.0521 |
| Page: 1 2 3 4 5 6 7 8 |
| Tissue | Expression Dynamics | Abbreviation |
| Colorectum (GSE201348) |  | FAP: Familial adenomatous polyposis |
| CRC: Colorectal cancer | ||
| Colorectum (HTA11) | 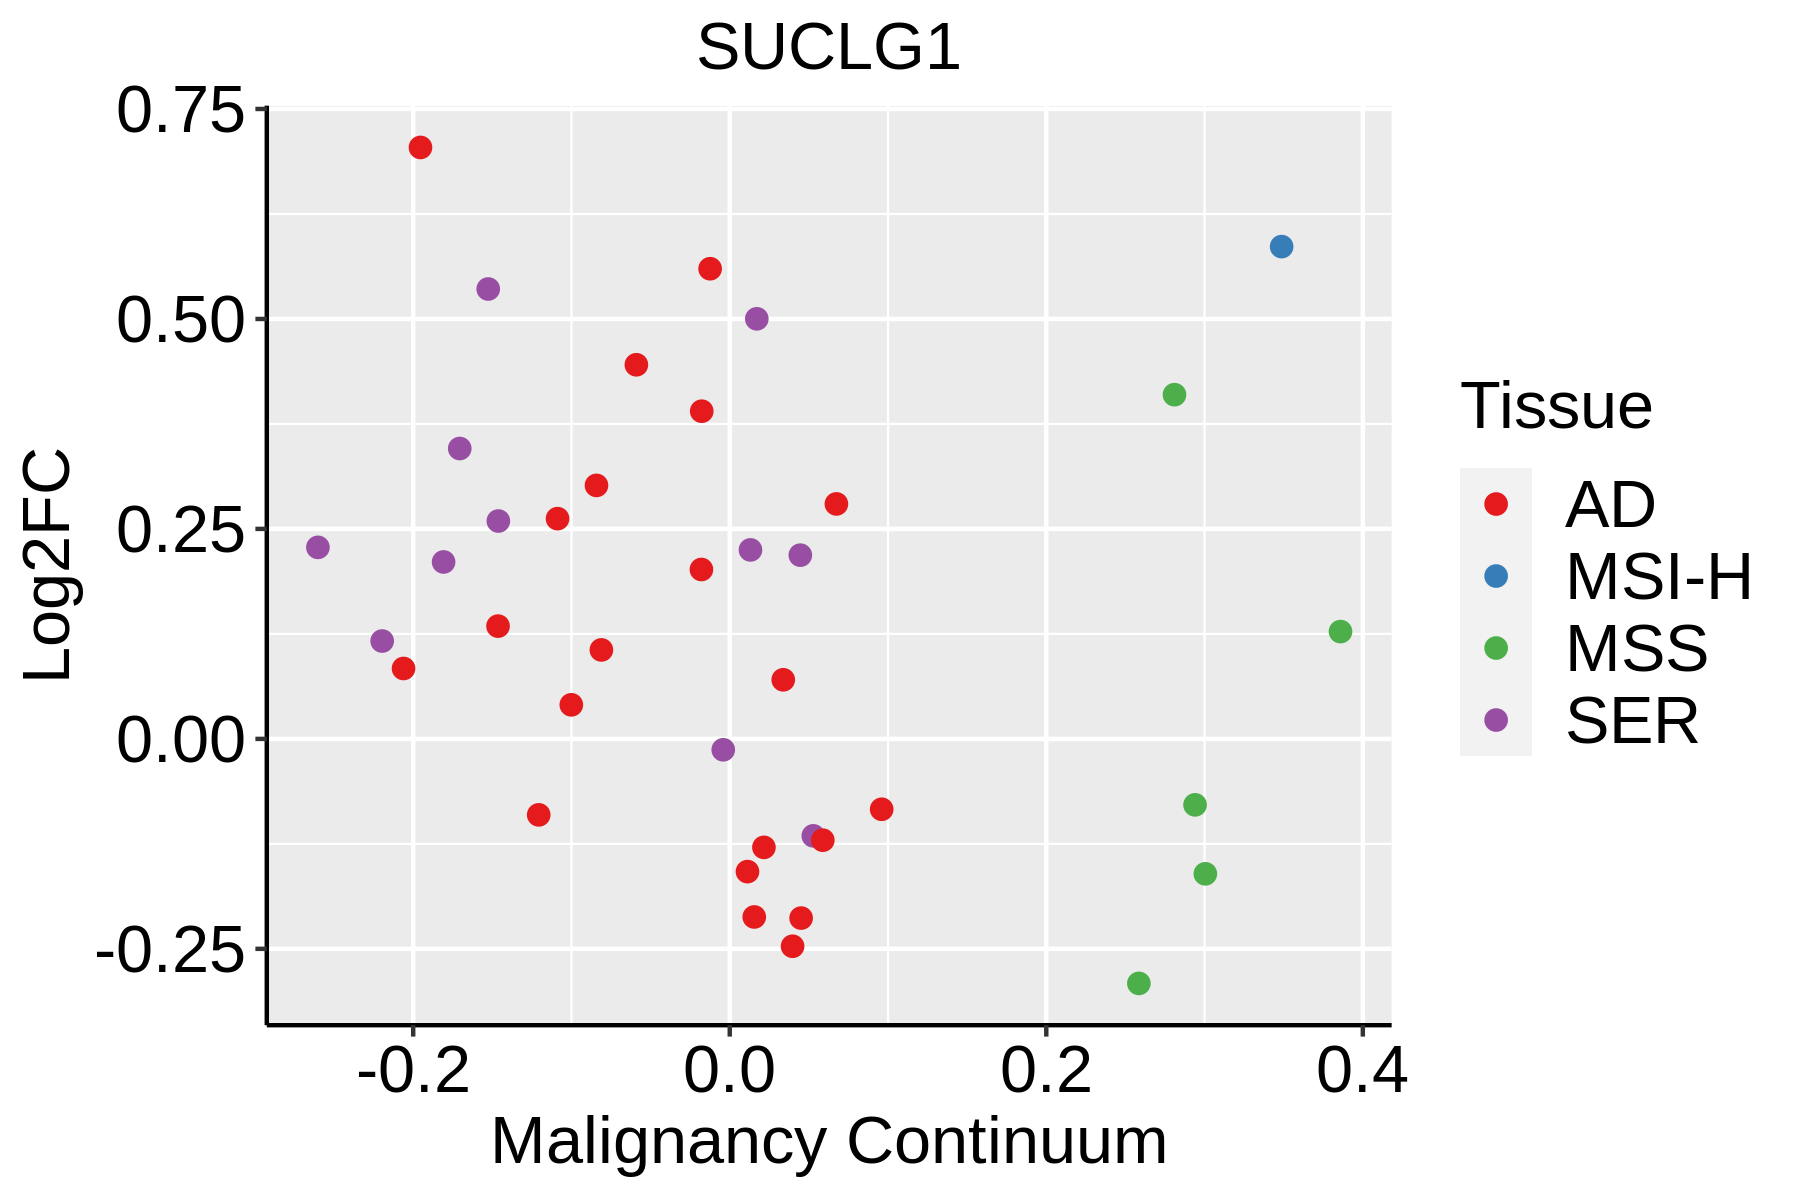 | AD: Adenomas |
| SER: Sessile serrated lesions | ||
| MSI-H: Microsatellite-high colorectal cancer | ||
| MSS: Microsatellite stable colorectal cancer | ||
| Esophagus | 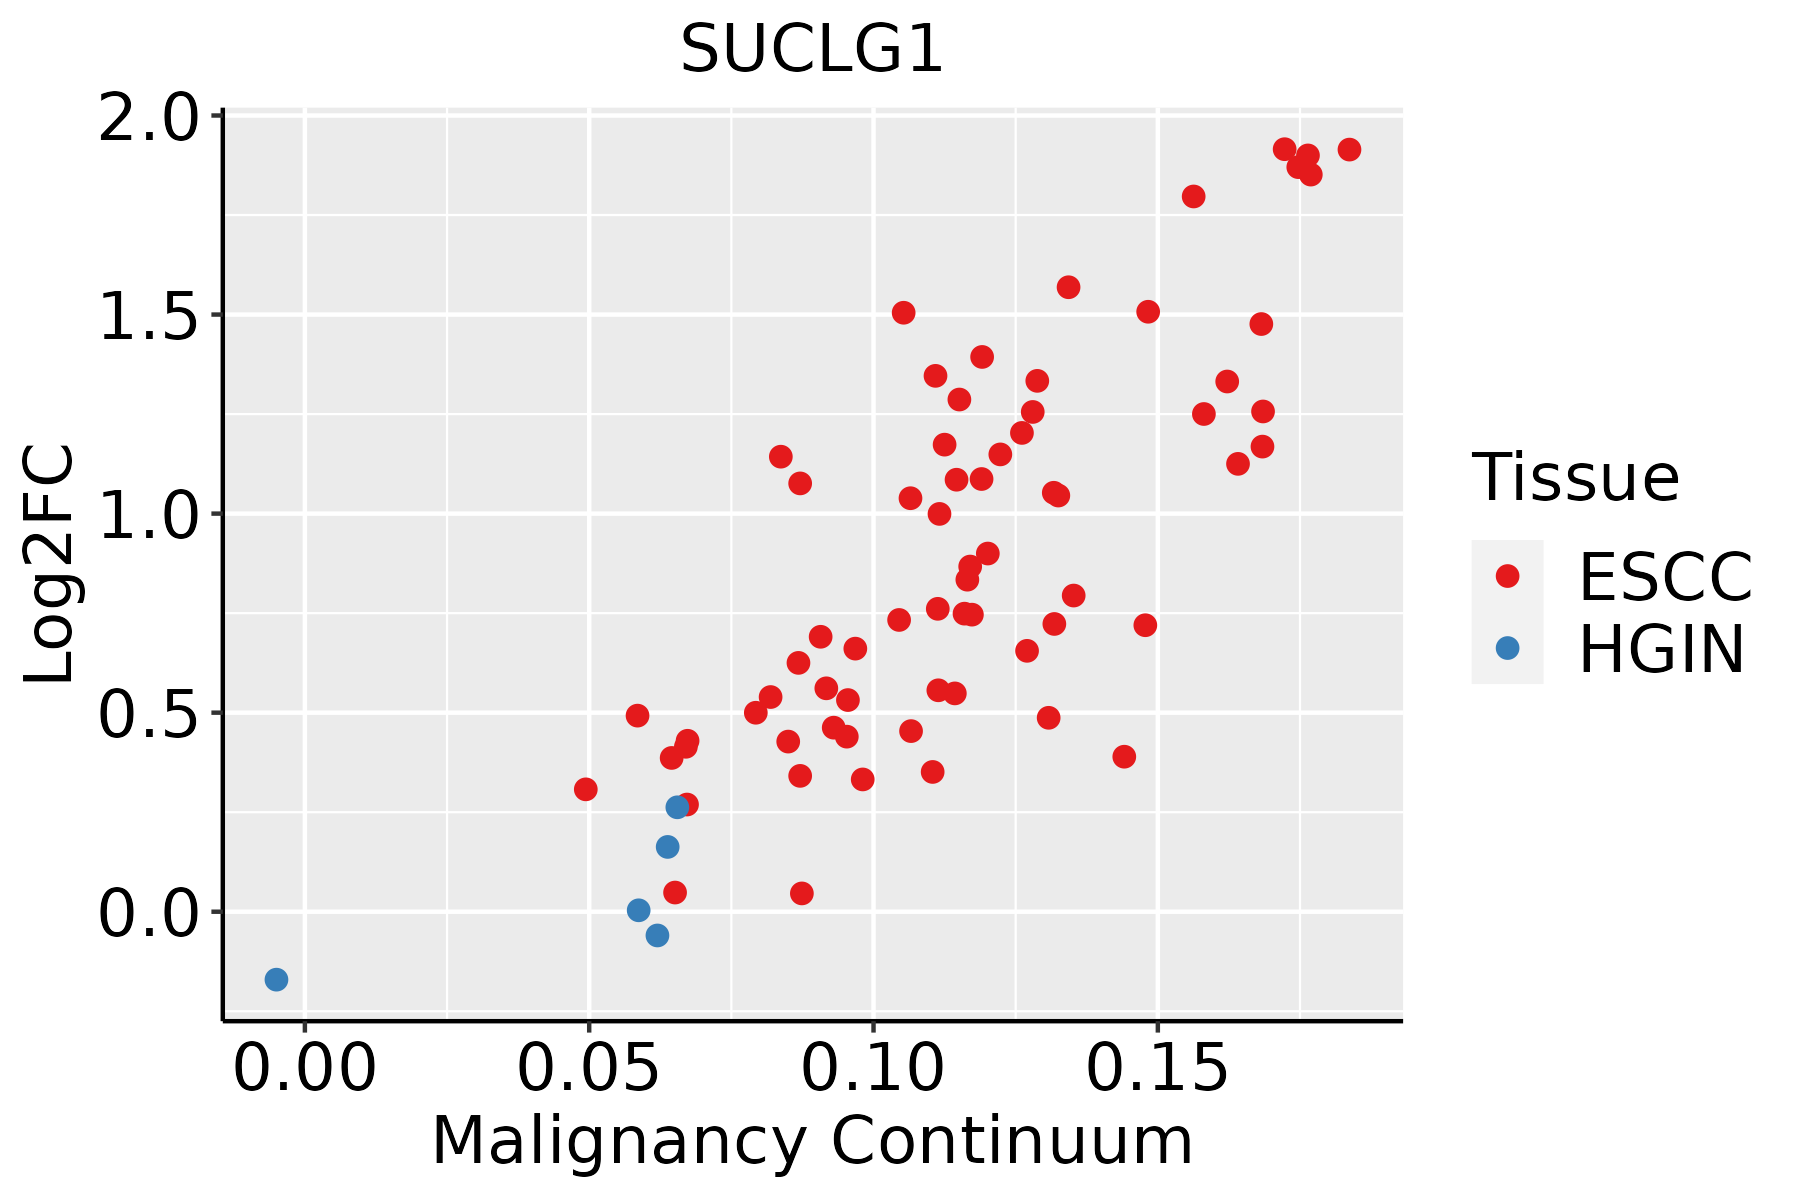 | ESCC: Esophageal squamous cell carcinoma |
| HGIN: High-grade intraepithelial neoplasias | ||
| LGIN: Low-grade intraepithelial neoplasias | ||
| Liver | 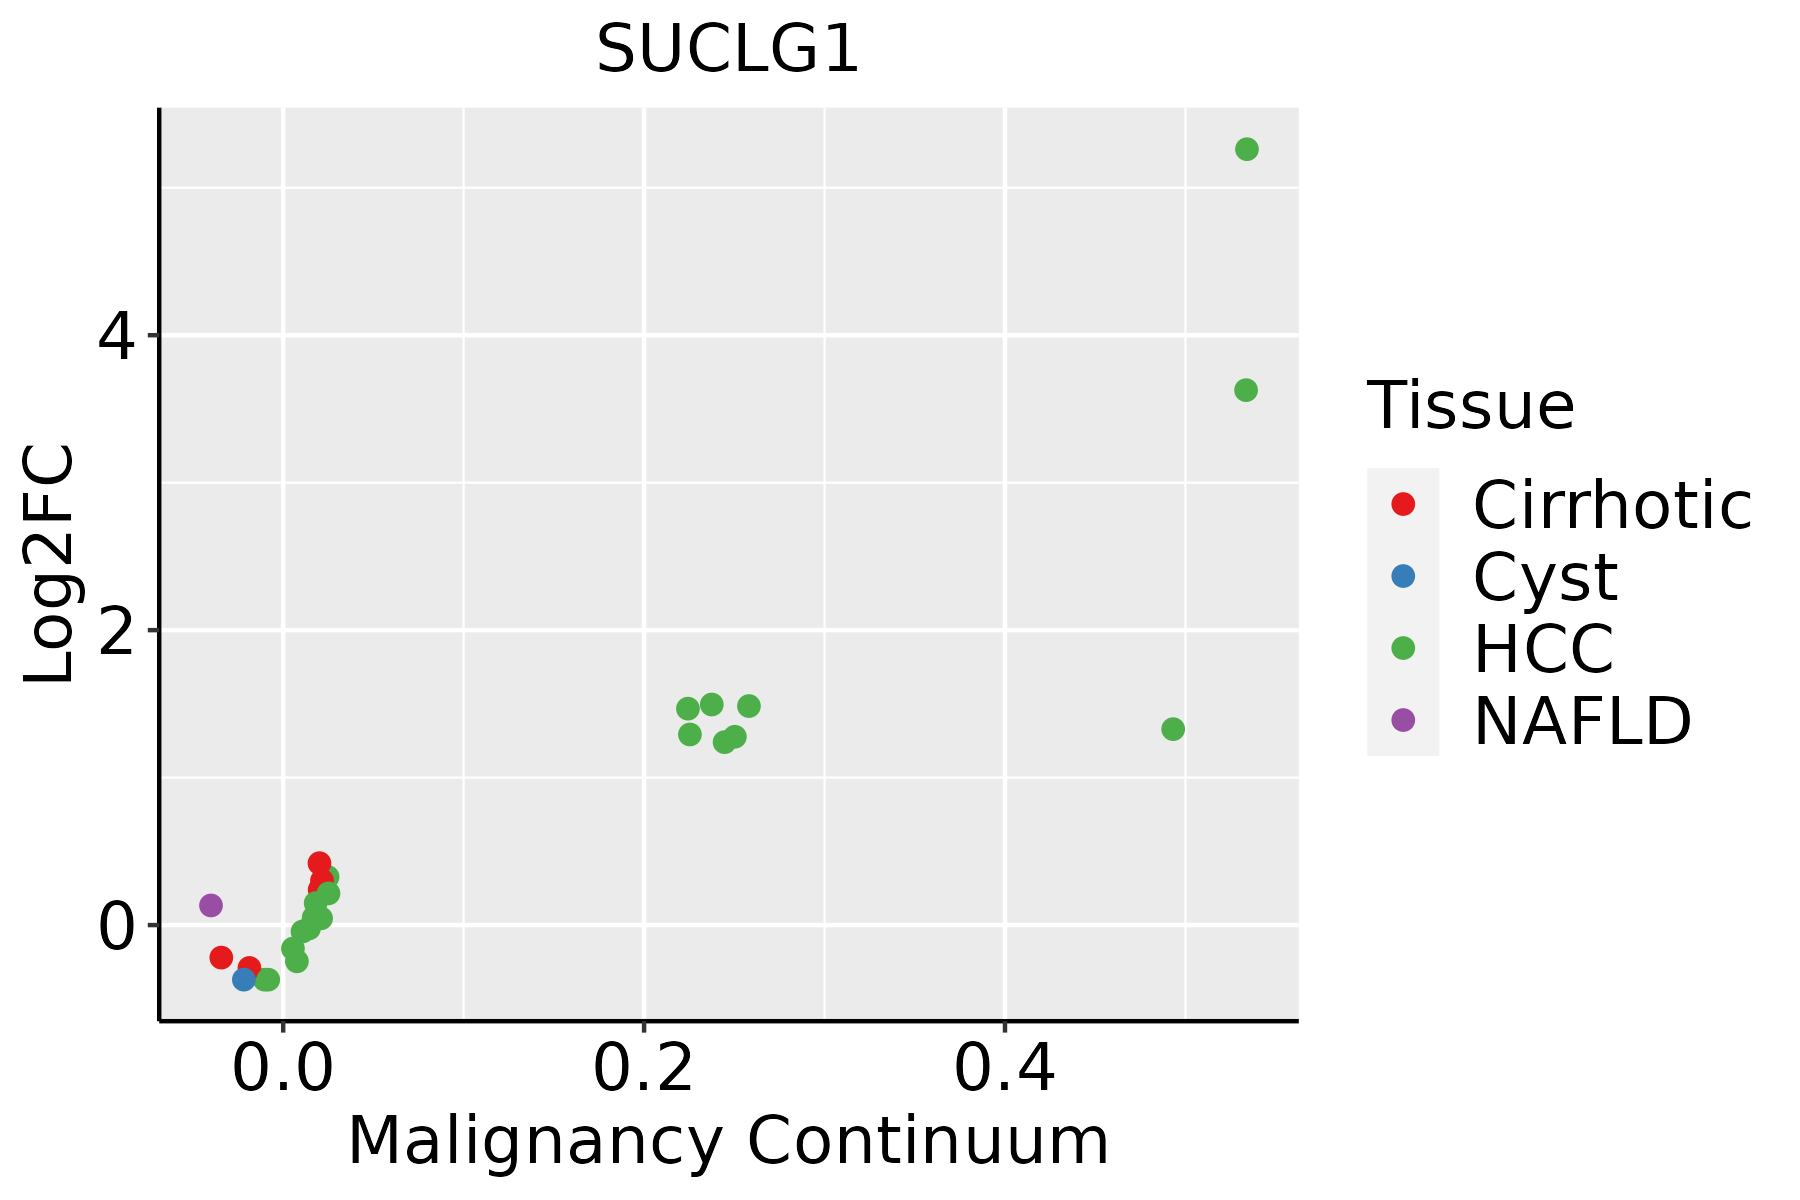 | HCC: Hepatocellular carcinoma |
| NAFLD: Non-alcoholic fatty liver disease | ||
| Oral Cavity | 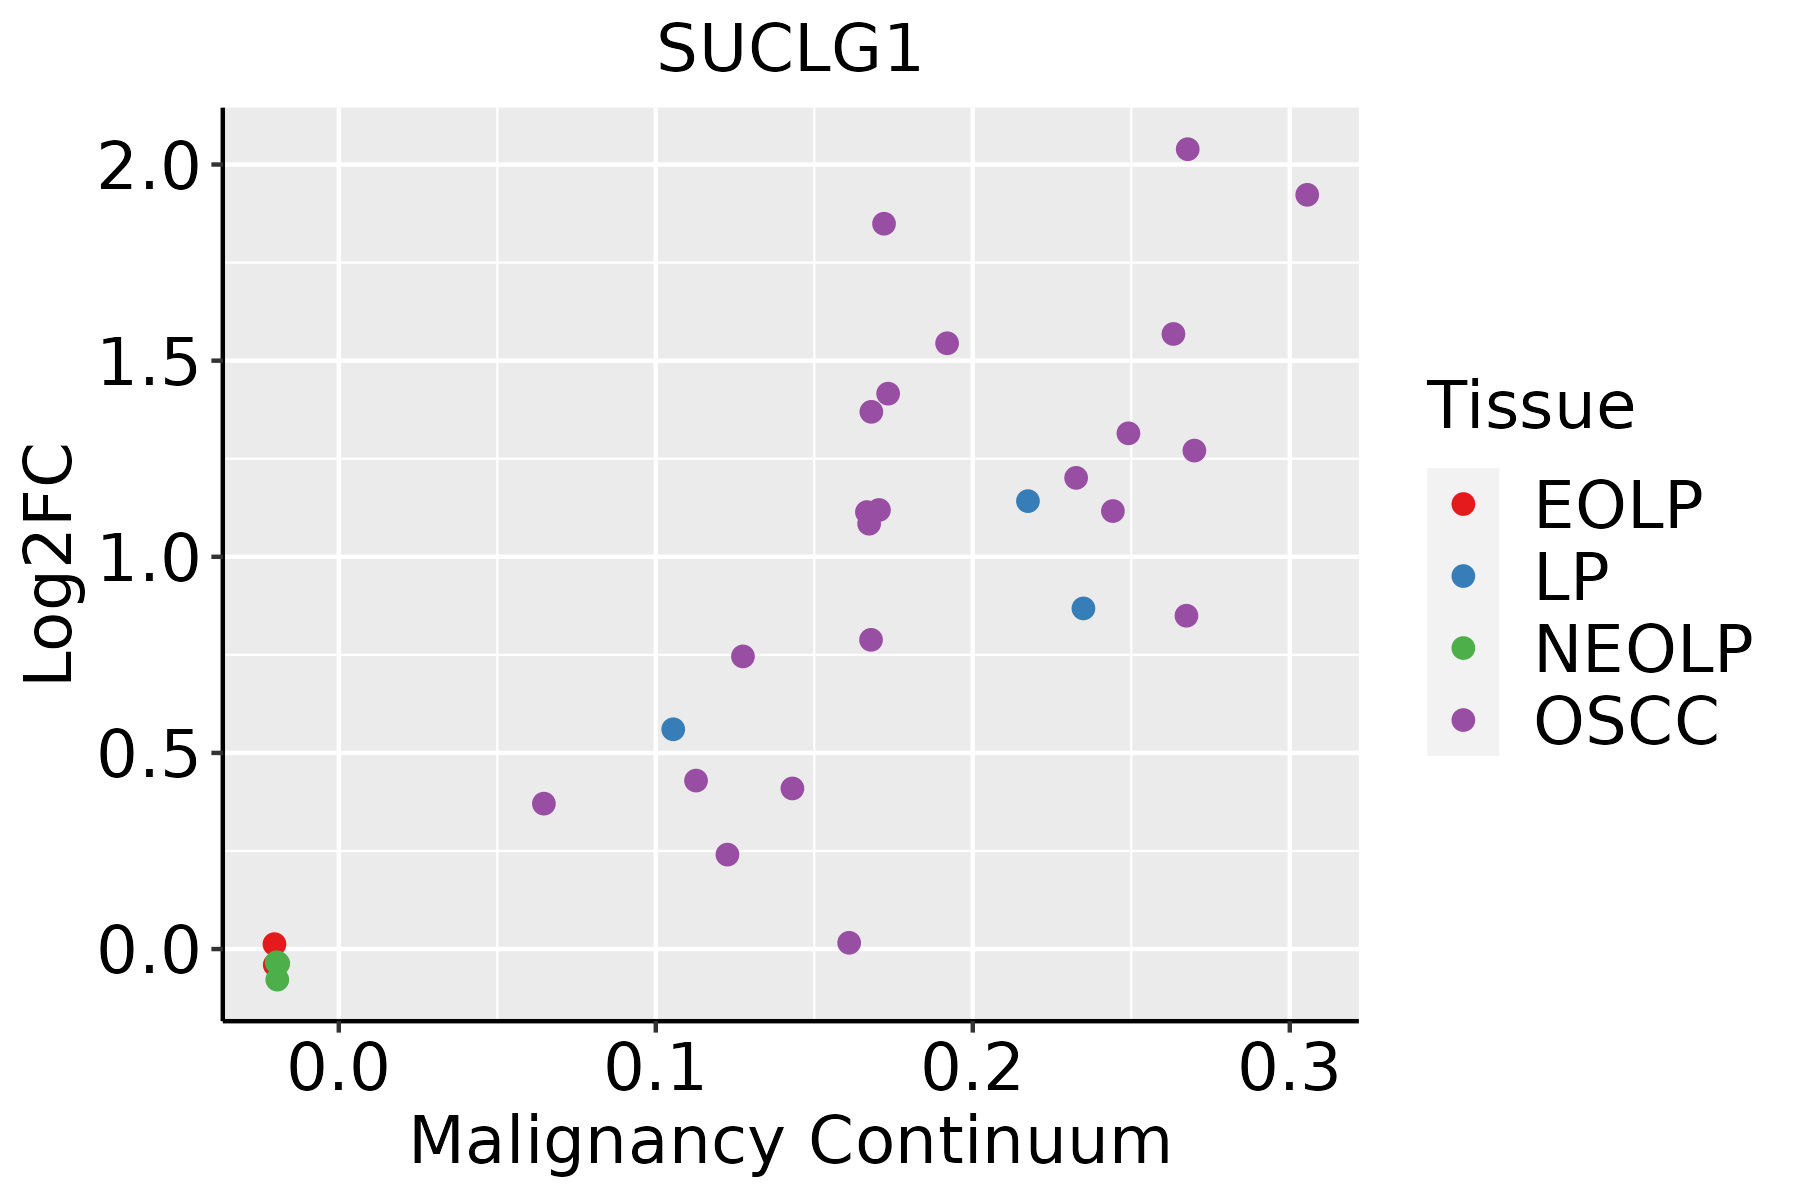 | EOLP: Erosive Oral lichen planus |
| LP: leukoplakia | ||
| NEOLP: Non-erosive oral lichen planus | ||
| OSCC: Oral squamous cell carcinoma | ||
| Skin |  | AK: Actinic keratosis |
| cSCC: Cutaneous squamous cell carcinoma | ||
| SCCIS:squamous cell carcinoma in situ | ||
| Thyroid |  | ATC: Anaplastic thyroid cancer |
| HT: Hashimoto's thyroiditis | ||
| PTC: Papillary thyroid cancer |
| ∗log2FC in expression of this searched gene in stem-like cells from each diseased tissue sample relative to stem-like cells in normal samples in each tissue plotted against the malignancy continuum. Samples are colored based on if they are from different disease stage. |
Top |
Malignant transformation related pathway analysis |
| Find out the enriched GO biological processes and KEGG pathways involved in transition from healthy to precancer to cancer |
| Tissue | Disease Stage | Enriched GO biological Processes |
| Colorectum | AD |  |
| Colorectum | SER |  |
| Colorectum | MSS |  |
| Colorectum | MSI-H |  |
| Colorectum | FAP |  |
| ∗Top 15 enriched GO BP terms are showed in the bar plot of each disease state in each tissue. Each row represents a significant GO biological process which is colored according to the -log10(p.adjust). |
| Page: 1 2 3 4 5 6 7 8 9 |
| GO ID | Tissue | Disease Stage | Description | Gene Ratio | Bg Ratio | pvalue | p.adjust | Count |
| GO:0006091 | Colorectum | AD | generation of precursor metabolites and energy | 209/3918 | 490/18723 | 3.17e-28 | 6.61e-25 | 209 |
| GO:0009060 | Colorectum | AD | aerobic respiration | 108/3918 | 189/18723 | 9.14e-28 | 1.43e-24 | 108 |
| GO:0045333 | Colorectum | AD | cellular respiration | 119/3918 | 230/18723 | 3.21e-25 | 4.02e-22 | 119 |
| GO:0015980 | Colorectum | AD | energy derivation by oxidation of organic compounds | 143/3918 | 318/18723 | 2.78e-22 | 2.49e-19 | 143 |
| GO:0006099 | Colorectum | AD | tricarboxylic acid cycle | 19/3918 | 30/18723 | 5.82e-07 | 2.09e-05 | 19 |
| GO:00090601 | Colorectum | SER | aerobic respiration | 96/2897 | 189/18723 | 5.53e-30 | 1.70e-26 | 96 |
| GO:00453331 | Colorectum | SER | cellular respiration | 103/2897 | 230/18723 | 2.35e-26 | 3.61e-23 | 103 |
| GO:00060911 | Colorectum | SER | generation of precursor metabolites and energy | 168/2897 | 490/18723 | 1.39e-25 | 1.70e-22 | 168 |
| GO:00159801 | Colorectum | SER | energy derivation by oxidation of organic compounds | 119/2897 | 318/18723 | 5.28e-22 | 4.62e-19 | 119 |
| GO:00060991 | Colorectum | SER | tricarboxylic acid cycle | 15/2897 | 30/18723 | 1.02e-05 | 3.34e-04 | 15 |
| GO:00090602 | Colorectum | MSS | aerobic respiration | 98/3467 | 189/18723 | 3.35e-25 | 1.05e-21 | 98 |
| GO:00060912 | Colorectum | MSS | generation of precursor metabolites and energy | 186/3467 | 490/18723 | 1.14e-24 | 2.15e-21 | 186 |
| GO:00453332 | Colorectum | MSS | cellular respiration | 107/3467 | 230/18723 | 1.64e-22 | 2.05e-19 | 107 |
| GO:00159802 | Colorectum | MSS | energy derivation by oxidation of organic compounds | 131/3467 | 318/18723 | 2.60e-21 | 2.70e-18 | 131 |
| GO:00060992 | Colorectum | MSS | tricarboxylic acid cycle | 16/3467 | 30/18723 | 1.90e-05 | 4.12e-04 | 16 |
| GO:00060914 | Colorectum | FAP | generation of precursor metabolites and energy | 128/2622 | 490/18723 | 5.58e-13 | 4.28e-10 | 128 |
| GO:00159804 | Colorectum | FAP | energy derivation by oxidation of organic compounds | 85/2622 | 318/18723 | 1.36e-09 | 2.77e-07 | 85 |
| GO:00090604 | Colorectum | FAP | aerobic respiration | 57/2622 | 189/18723 | 7.02e-09 | 1.02e-06 | 57 |
| GO:00453334 | Colorectum | FAP | cellular respiration | 65/2622 | 230/18723 | 1.13e-08 | 1.33e-06 | 65 |
| GO:00060993 | Colorectum | FAP | tricarboxylic acid cycle | 13/2622 | 30/18723 | 8.95e-05 | 1.58e-03 | 13 |
| Page: 1 2 3 4 |
| Pathway ID | Tissue | Disease Stage | Description | Gene Ratio | Bg Ratio | pvalue | p.adjust | qvalue | Count |
| hsa01200 | Colorectum | AD | Carbon metabolism | 55/2092 | 115/8465 | 5.53e-08 | 8.42e-07 | 5.37e-07 | 55 |
| hsa012001 | Colorectum | AD | Carbon metabolism | 55/2092 | 115/8465 | 5.53e-08 | 8.42e-07 | 5.37e-07 | 55 |
| hsa000202 | Colorectum | SER | Citrate cycle (TCA cycle) | 16/1580 | 30/8465 | 2.06e-05 | 2.74e-04 | 1.99e-04 | 16 |
| hsa012002 | Colorectum | SER | Carbon metabolism | 40/1580 | 115/8465 | 2.77e-05 | 3.41e-04 | 2.47e-04 | 40 |
| hsa006402 | Colorectum | SER | Propanoate metabolism | 13/1580 | 32/8465 | 3.20e-03 | 2.12e-02 | 1.54e-02 | 13 |
| hsa000203 | Colorectum | SER | Citrate cycle (TCA cycle) | 16/1580 | 30/8465 | 2.06e-05 | 2.74e-04 | 1.99e-04 | 16 |
| hsa012003 | Colorectum | SER | Carbon metabolism | 40/1580 | 115/8465 | 2.77e-05 | 3.41e-04 | 2.47e-04 | 40 |
| hsa006403 | Colorectum | SER | Propanoate metabolism | 13/1580 | 32/8465 | 3.20e-03 | 2.12e-02 | 1.54e-02 | 13 |
| hsa012004 | Colorectum | MSS | Carbon metabolism | 43/1875 | 115/8465 | 1.37e-04 | 1.17e-03 | 7.19e-04 | 43 |
| hsa000204 | Colorectum | MSS | Citrate cycle (TCA cycle) | 16/1875 | 30/8465 | 1.84e-04 | 1.47e-03 | 9.00e-04 | 16 |
| hsa006404 | Colorectum | MSS | Propanoate metabolism | 15/1875 | 32/8465 | 1.68e-03 | 9.05e-03 | 5.55e-03 | 15 |
| hsa012005 | Colorectum | MSS | Carbon metabolism | 43/1875 | 115/8465 | 1.37e-04 | 1.17e-03 | 7.19e-04 | 43 |
| hsa000205 | Colorectum | MSS | Citrate cycle (TCA cycle) | 16/1875 | 30/8465 | 1.84e-04 | 1.47e-03 | 9.00e-04 | 16 |
| hsa006405 | Colorectum | MSS | Propanoate metabolism | 15/1875 | 32/8465 | 1.68e-03 | 9.05e-03 | 5.55e-03 | 15 |
| hsa012006 | Colorectum | FAP | Carbon metabolism | 38/1404 | 115/8465 | 1.04e-05 | 1.44e-04 | 8.76e-05 | 38 |
| hsa006406 | Colorectum | FAP | Propanoate metabolism | 15/1404 | 32/8465 | 6.21e-05 | 6.10e-04 | 3.71e-04 | 15 |
| hsa000206 | Colorectum | FAP | Citrate cycle (TCA cycle) | 14/1404 | 30/8465 | 1.16e-04 | 1.02e-03 | 6.21e-04 | 14 |
| hsa012007 | Colorectum | FAP | Carbon metabolism | 38/1404 | 115/8465 | 1.04e-05 | 1.44e-04 | 8.76e-05 | 38 |
| hsa006407 | Colorectum | FAP | Propanoate metabolism | 15/1404 | 32/8465 | 6.21e-05 | 6.10e-04 | 3.71e-04 | 15 |
| hsa000207 | Colorectum | FAP | Citrate cycle (TCA cycle) | 14/1404 | 30/8465 | 1.16e-04 | 1.02e-03 | 6.21e-04 | 14 |
| Page: 1 2 3 |
Top |
Cell-cell communication analysis |
| Identification of potential cell-cell interactions between two cell types and their ligand-receptor pairs for different disease states |
| Ligand | Receptor | LRpair | Pathway | Tissue | Disease Stage |
| Page: 1 |
Top |
Single-cell gene regulatory network inference analysis |
| Find out the significant the regulons (TFs) and the target genes of each regulon across cell types for different disease states |
| TF | Cell Type | Tissue | Disease Stage | Target Gene | RSS | Regulon Activity |
| SUCLG1 | BAS | Cervix | Healthy | GIPC1,DNAAF5,COX5A, etc. | 2.36e-01 |  |
| ∗The dot plots of a searched regulon are shown for all cell subpopulations in each disease state of each tissue based on the regulon specific score inferred using pySCENIC and by calculating the average expression. |
| Page: 1 |
Top |
Somatic mutation of malignant transformation related genes |
| Annotation of somatic variants for genes involved in malignant transformation |
| Hugo Symbol | Variant Class | Variant Classification | dbSNP RS | HGVSc | HGVSp | HGVSp Short | SWISSPROT | BIOTYPE | SIFT | PolyPhen | Tumor Sample Barcode | Tissue | Histology | Sex | Age | Stage | Therapy Types | Drugs | Outcome |
| SUCLG1 | SNV | Missense_Mutation | novel | c.968T>G | p.Val323Gly | p.V323G | P53597 | protein_coding | deleterious(0) | probably_damaging(0.988) | TCGA-2W-A8YY-01 | Cervix | cervical & endocervical cancer | Female | <65 | I/II | Chemotherapy | cisplatin | CR |
| SUCLG1 | SNV | Missense_Mutation | novel | c.793A>G | p.Asn265Asp | p.N265D | P53597 | protein_coding | tolerated(0.84) | benign(0.001) | TCGA-2W-A8YY-01 | Cervix | cervical & endocervical cancer | Female | <65 | I/II | Chemotherapy | cisplatin | CR |
| SUCLG1 | SNV | Missense_Mutation | novel | c.487G>A | p.Glu163Lys | p.E163K | P53597 | protein_coding | tolerated(0.09) | benign(0.001) | TCGA-DS-A1OB-01 | Cervix | cervical & endocervical cancer | Female | <65 | I/II | Chemotherapy | carboplatin | PD |
| SUCLG1 | SNV | Missense_Mutation | rs145106503 | c.721G>A | p.Glu241Lys | p.E241K | P53597 | protein_coding | tolerated(0.39) | benign(0.081) | TCGA-AA-3977-01 | Colorectum | colon adenocarcinoma | Male | >=65 | I/II | Unknown | Unknown | SD |
| SUCLG1 | SNV | Missense_Mutation | c.13C>A | p.Leu5Ile | p.L5I | P53597 | protein_coding | deleterious_low_confidence(0.05) | benign(0.001) | TCGA-AD-A5EJ-01 | Colorectum | colon adenocarcinoma | Female | >=65 | I/II | Unknown | Unknown | SD | |
| SUCLG1 | SNV | Missense_Mutation | novel | c.904N>A | p.Ala302Thr | p.A302T | P53597 | protein_coding | deleterious(0.01) | probably_damaging(0.999) | TCGA-CA-6717-01 | Colorectum | colon adenocarcinoma | Male | <65 | I/II | Chemotherapy | oxaliplatin | CR |
| SUCLG1 | SNV | Missense_Mutation | rs145106503 | c.721G>A | p.Glu241Lys | p.E241K | P53597 | protein_coding | tolerated(0.39) | benign(0.081) | TCGA-EI-6917-01 | Colorectum | rectum adenocarcinoma | Male | <65 | III/IV | Chemotherapy | 5fluorouracil+oxaciplatina+l-folinian | SD |
| SUCLG1 | SNV | Missense_Mutation | novel | c.319G>A | p.Ala107Thr | p.A107T | P53597 | protein_coding | deleterious(0) | probably_damaging(0.999) | TCGA-A5-A1OF-01 | Endometrium | uterine corpus endometrioid carcinoma | Female | <65 | I/II | Unknown | Unknown | SD |
| SUCLG1 | SNV | Missense_Mutation | novel | c.216N>A | p.Ser72Arg | p.S72R | P53597 | protein_coding | deleterious_low_confidence(0) | probably_damaging(0.997) | TCGA-AP-A1DK-01 | Endometrium | uterine corpus endometrioid carcinoma | Female | <65 | I/II | Unknown | Unknown | SD |
| SUCLG1 | SNV | Missense_Mutation | novel | c.393N>C | p.Glu131Asp | p.E131D | P53597 | protein_coding | tolerated(0.06) | benign(0.131) | TCGA-AP-A1E0-01 | Endometrium | uterine corpus endometrioid carcinoma | Female | <65 | III/IV | Chemotherapy | paclitaxel | SD |
| Page: 1 2 3 4 |
Top |
Related drugs of malignant transformation related genes |
| Identification of chemicals and drugs interact with genes involved in malignant transfromation |
| (DGIdb 4.0) |
| Entrez ID | Symbol | Category | Interaction Types | Drug Claim Name | Drug Name | PMIDs |
| Page: 1 |

Copyright 2023-Present -The University of Texas Health Science Center at Houston |