
|
|||||
|
 | |
| |
| |
| |
| |
| |
|
Gene: SUCLA2 |
Gene summary for SUCLA2 |
| Gene information | Species | Human | Gene symbol | SUCLA2 | Gene ID | 8803 |
| Gene name | succinate-CoA ligase ADP-forming subunit beta | |
| Gene Alias | A-BETA | |
| Cytomap | 13q14.2 | |
| Gene Type | protein-coding | GO ID | GO:0006082 | UniProtAcc | E5KS60 |
Top |
Malignant transformation analysis |
| Identification of the aberrant gene expression in precancerous and cancerous lesions by comparing the gene expression of stem-like cells in diseased tissues with normal stem cells |
| Entrez ID | Symbol | Replicates | Species | Organ | Tissue | Adj P-value | Log2FC | Malignancy |
| 8803 | SUCLA2 | LZE2T | Human | Esophagus | ESCC | 2.56e-02 | 6.13e-01 | 0.082 |
| 8803 | SUCLA2 | LZE4T | Human | Esophagus | ESCC | 1.08e-05 | 2.03e-01 | 0.0811 |
| 8803 | SUCLA2 | LZE8T | Human | Esophagus | ESCC | 7.82e-07 | 3.19e-01 | 0.067 |
| 8803 | SUCLA2 | LZE20T | Human | Esophagus | ESCC | 2.59e-02 | 1.37e-01 | 0.0662 |
| 8803 | SUCLA2 | LZE24T | Human | Esophagus | ESCC | 1.12e-16 | 2.91e-01 | 0.0596 |
| 8803 | SUCLA2 | LZE6T | Human | Esophagus | ESCC | 9.73e-03 | 1.12e-01 | 0.0845 |
| 8803 | SUCLA2 | P1T-E | Human | Esophagus | ESCC | 6.01e-03 | 1.72e-01 | 0.0875 |
| 8803 | SUCLA2 | P2T-E | Human | Esophagus | ESCC | 1.37e-23 | 2.99e-01 | 0.1177 |
| 8803 | SUCLA2 | P4T-E | Human | Esophagus | ESCC | 1.50e-05 | 1.30e-01 | 0.1323 |
| 8803 | SUCLA2 | P5T-E | Human | Esophagus | ESCC | 1.68e-13 | 1.70e-01 | 0.1327 |
| 8803 | SUCLA2 | P8T-E | Human | Esophagus | ESCC | 1.61e-29 | 4.64e-01 | 0.0889 |
| 8803 | SUCLA2 | P9T-E | Human | Esophagus | ESCC | 3.10e-16 | 2.15e-01 | 0.1131 |
| 8803 | SUCLA2 | P10T-E | Human | Esophagus | ESCC | 4.35e-19 | 3.62e-01 | 0.116 |
| 8803 | SUCLA2 | P11T-E | Human | Esophagus | ESCC | 6.40e-05 | 1.70e-01 | 0.1426 |
| 8803 | SUCLA2 | P12T-E | Human | Esophagus | ESCC | 5.99e-21 | 4.74e-01 | 0.1122 |
| 8803 | SUCLA2 | P15T-E | Human | Esophagus | ESCC | 8.32e-16 | 4.29e-01 | 0.1149 |
| 8803 | SUCLA2 | P16T-E | Human | Esophagus | ESCC | 7.11e-27 | 4.59e-01 | 0.1153 |
| 8803 | SUCLA2 | P17T-E | Human | Esophagus | ESCC | 2.76e-02 | 2.06e-01 | 0.1278 |
| 8803 | SUCLA2 | P19T-E | Human | Esophagus | ESCC | 1.72e-02 | 4.74e-01 | 0.1662 |
| 8803 | SUCLA2 | P20T-E | Human | Esophagus | ESCC | 4.35e-18 | 3.29e-01 | 0.1124 |
| Page: 1 2 3 4 5 |
| Tissue | Expression Dynamics | Abbreviation |
| Esophagus | 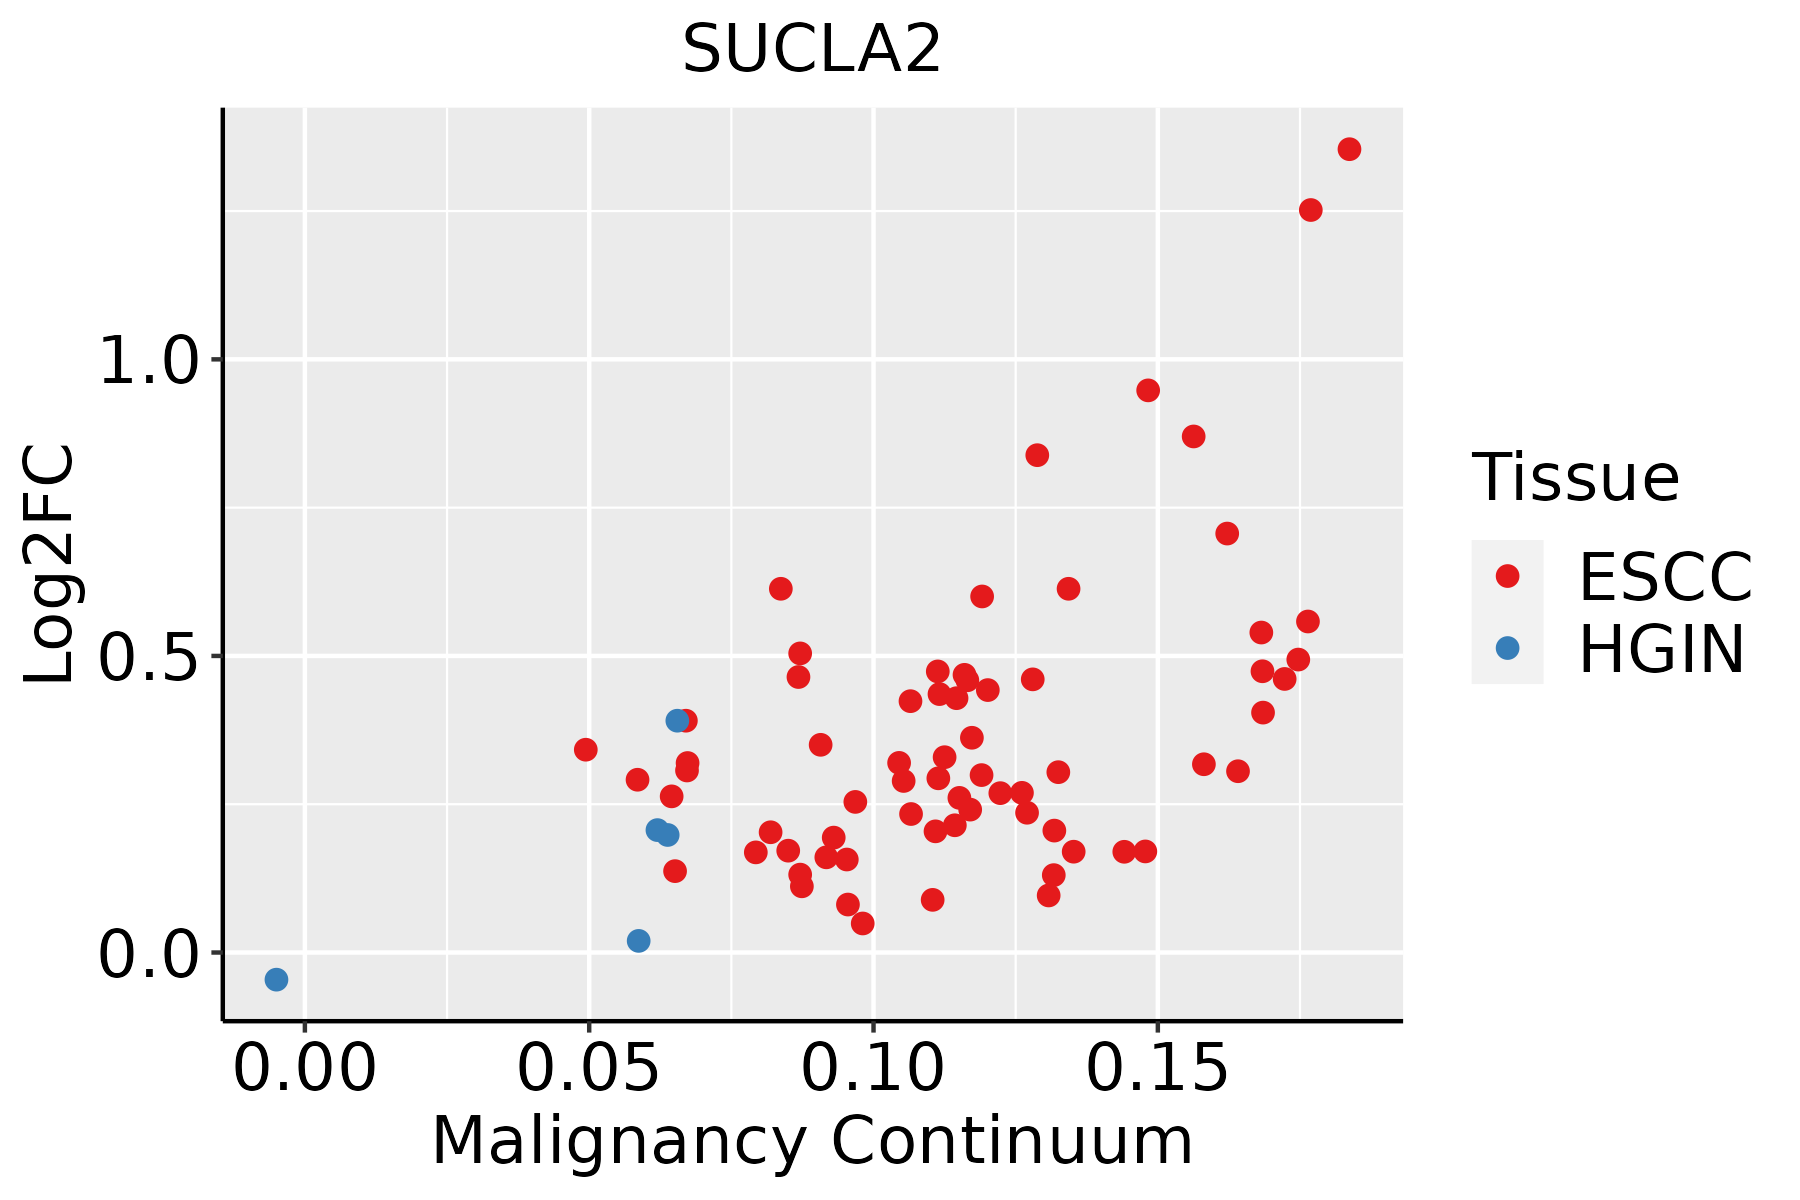 | ESCC: Esophageal squamous cell carcinoma |
| HGIN: High-grade intraepithelial neoplasias | ||
| LGIN: Low-grade intraepithelial neoplasias | ||
| Liver |  | HCC: Hepatocellular carcinoma |
| NAFLD: Non-alcoholic fatty liver disease | ||
| Oral Cavity | 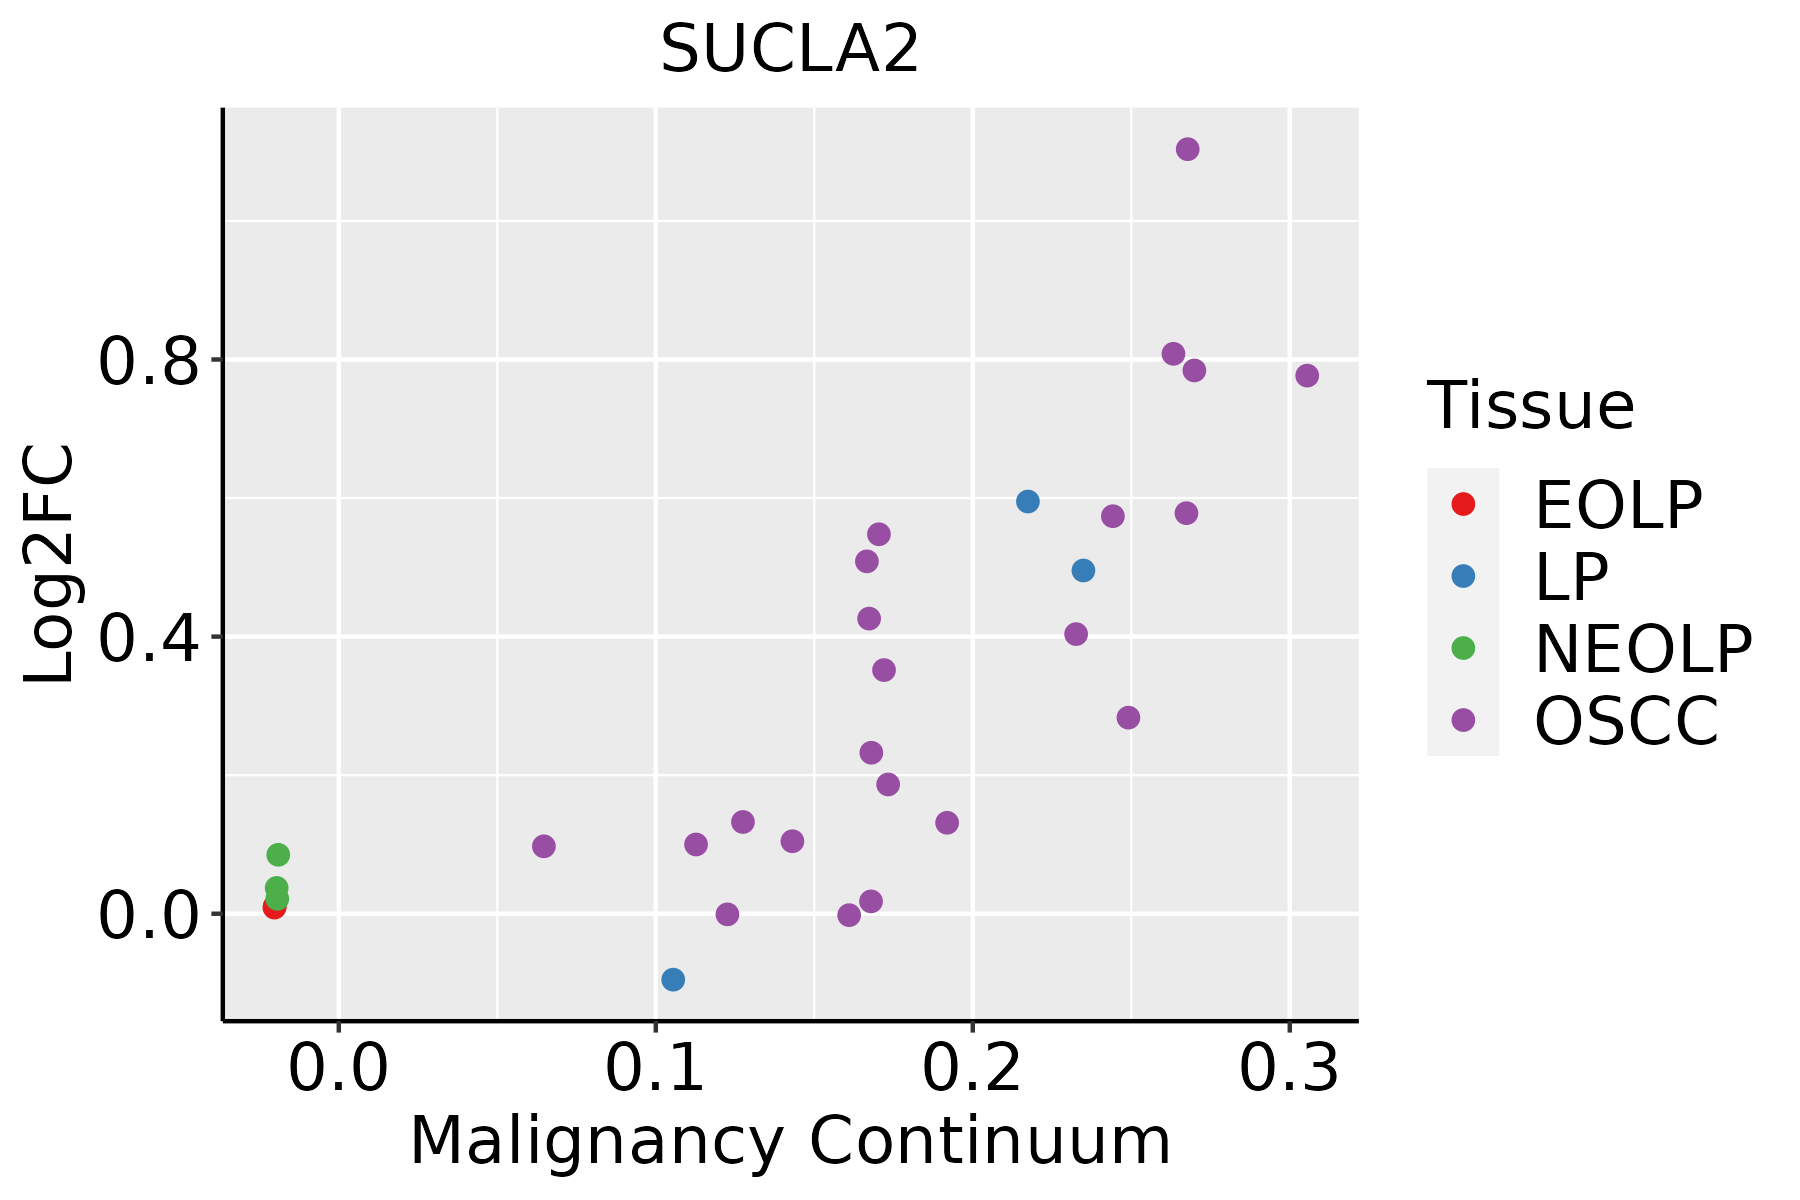 | EOLP: Erosive Oral lichen planus |
| LP: leukoplakia | ||
| NEOLP: Non-erosive oral lichen planus | ||
| OSCC: Oral squamous cell carcinoma | ||
| Skin | 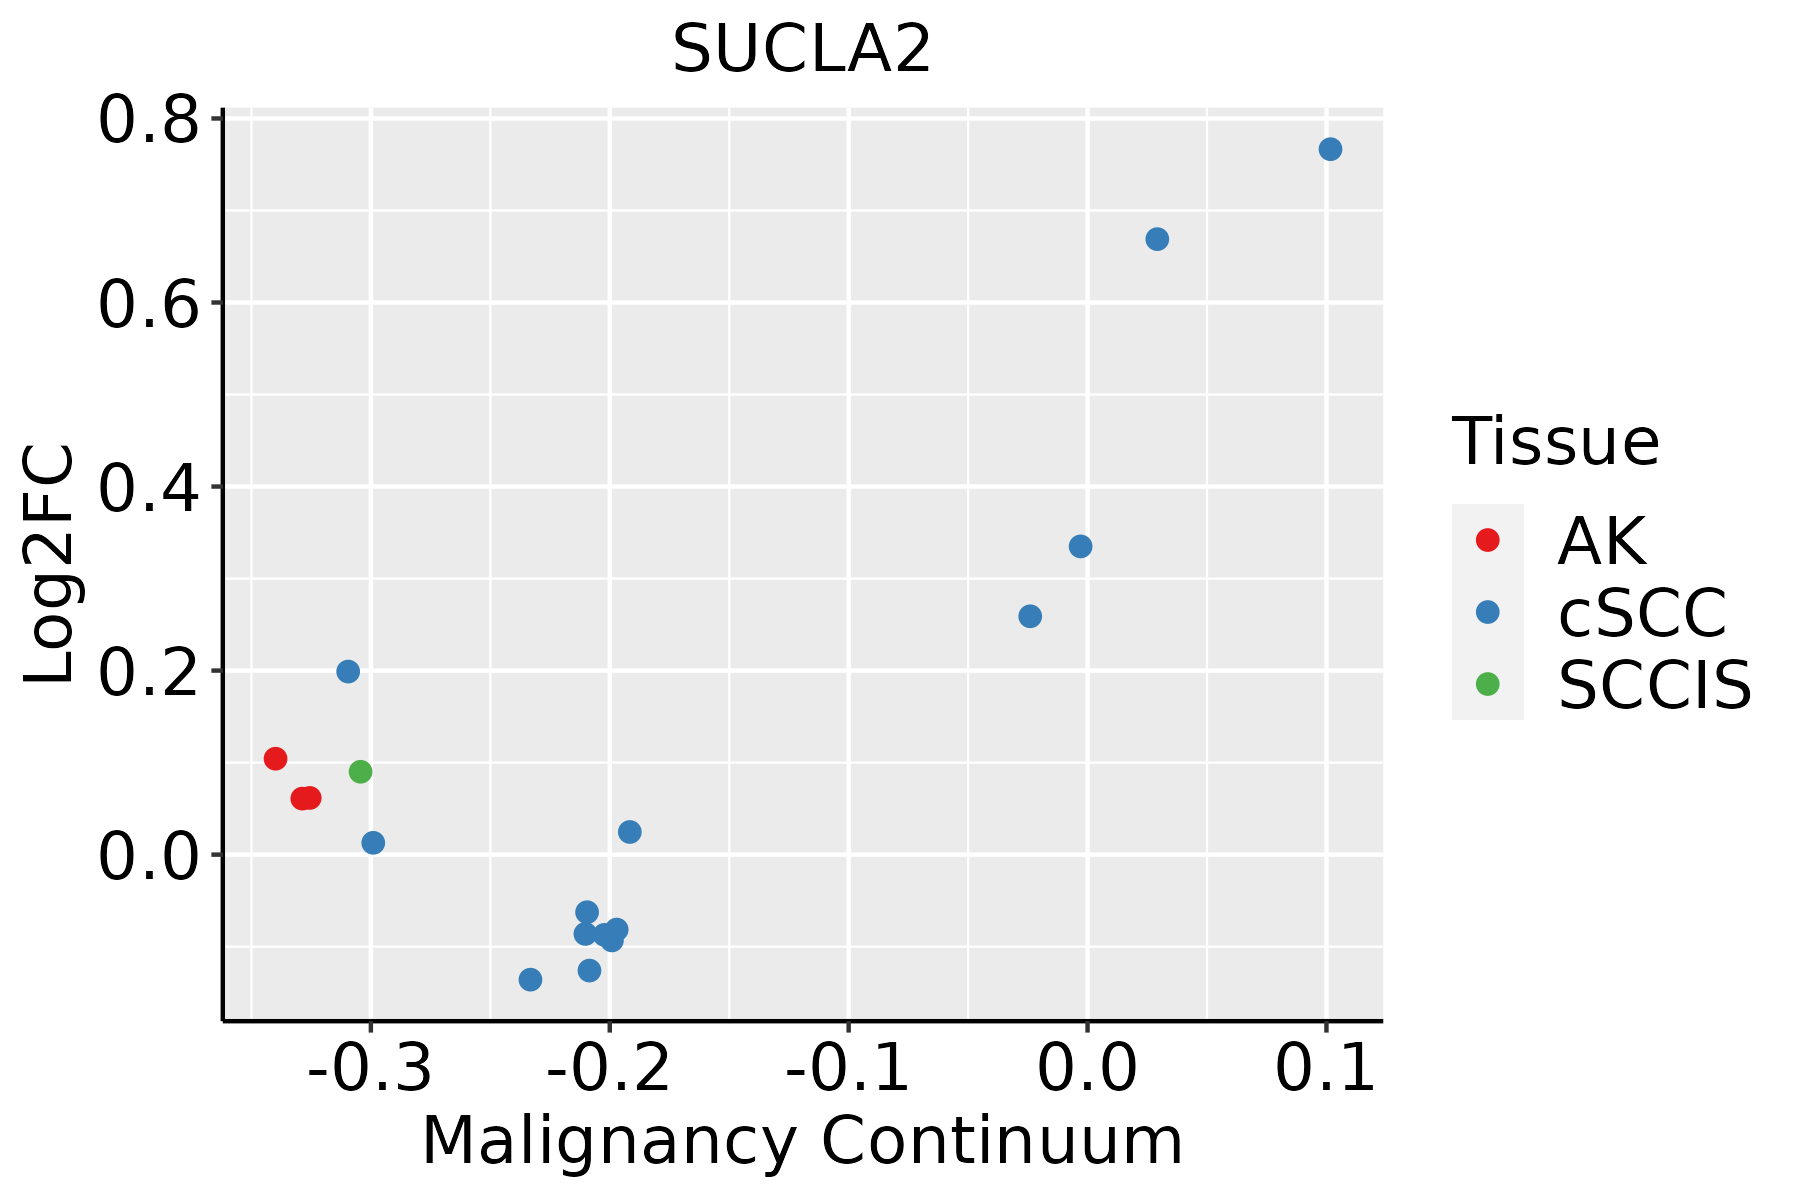 | AK: Actinic keratosis |
| cSCC: Cutaneous squamous cell carcinoma | ||
| SCCIS:squamous cell carcinoma in situ |
| ∗log2FC in expression of this searched gene in stem-like cells from each diseased tissue sample relative to stem-like cells in normal samples in each tissue plotted against the malignancy continuum. Samples are colored based on if they are from different disease stage. |
Top |
Malignant transformation related pathway analysis |
| Find out the enriched GO biological processes and KEGG pathways involved in transition from healthy to precancer to cancer |
| Tissue | Disease Stage | Enriched GO biological Processes |
| Colorectum | AD |  |
| Colorectum | SER |  |
| Colorectum | MSS |  |
| Colorectum | MSI-H |  |
| Colorectum | FAP |  |
| ∗Top 15 enriched GO BP terms are showed in the bar plot of each disease state in each tissue. Each row represents a significant GO biological process which is colored according to the -log10(p.adjust). |
| Page: 1 2 3 4 5 6 7 8 9 |
| GO ID | Tissue | Disease Stage | Description | Gene Ratio | Bg Ratio | pvalue | p.adjust | Count |
| GO:0006091110 | Esophagus | ESCC | generation of precursor metabolites and energy | 331/8552 | 490/18723 | 3.86e-23 | 8.45e-21 | 331 |
| GO:0045333110 | Esophagus | ESCC | cellular respiration | 173/8552 | 230/18723 | 4.53e-20 | 5.99e-18 | 173 |
| GO:0009060110 | Esophagus | ESCC | aerobic respiration | 145/8552 | 189/18723 | 2.16e-18 | 2.21e-16 | 145 |
| GO:0015980110 | Esophagus | ESCC | energy derivation by oxidation of organic compounds | 220/8552 | 318/18723 | 1.20e-17 | 1.09e-15 | 220 |
| GO:0006753110 | Esophagus | ESCC | nucleoside phosphate metabolic process | 288/8552 | 497/18723 | 1.80e-08 | 3.50e-07 | 288 |
| GO:0019693111 | Esophagus | ESCC | ribose phosphate metabolic process | 234/8552 | 396/18723 | 4.24e-08 | 7.76e-07 | 234 |
| GO:0009117111 | Esophagus | ESCC | nucleotide metabolic process | 282/8552 | 489/18723 | 4.70e-08 | 8.50e-07 | 282 |
| GO:00067906 | Esophagus | ESCC | sulfur compound metabolic process | 201/8552 | 339/18723 | 2.64e-07 | 3.94e-06 | 201 |
| GO:0009259111 | Esophagus | ESCC | ribonucleotide metabolic process | 224/8552 | 385/18723 | 4.41e-07 | 6.00e-06 | 224 |
| GO:00060997 | Esophagus | ESCC | tricarboxylic acid cycle | 27/8552 | 30/18723 | 4.54e-07 | 6.15e-06 | 27 |
| GO:0072521111 | Esophagus | ESCC | purine-containing compound metabolic process | 238/8552 | 416/18723 | 1.20e-06 | 1.49e-05 | 238 |
| GO:0009150111 | Esophagus | ESCC | purine ribonucleotide metabolic process | 213/8552 | 368/18723 | 1.40e-06 | 1.69e-05 | 213 |
| GO:0006163111 | Esophagus | ESCC | purine nucleotide metabolic process | 226/8552 | 396/18723 | 2.81e-06 | 3.21e-05 | 226 |
| GO:00463948 | Esophagus | ESCC | carboxylic acid biosynthetic process | 175/8552 | 314/18723 | 1.98e-04 | 1.26e-03 | 175 |
| GO:00160538 | Esophagus | ESCC | organic acid biosynthetic process | 175/8552 | 316/18723 | 3.04e-04 | 1.82e-03 | 175 |
| GO:00338655 | Esophagus | ESCC | nucleoside bisphosphate metabolic process | 77/8552 | 128/18723 | 6.71e-04 | 3.55e-03 | 77 |
| GO:00338755 | Esophagus | ESCC | ribonucleoside bisphosphate metabolic process | 77/8552 | 128/18723 | 6.71e-04 | 3.55e-03 | 77 |
| GO:00340325 | Esophagus | ESCC | purine nucleoside bisphosphate metabolic process | 77/8552 | 128/18723 | 6.71e-04 | 3.55e-03 | 77 |
| GO:00067791 | Esophagus | ESCC | porphyrin-containing compound biosynthetic process | 23/8552 | 31/18723 | 1.20e-03 | 5.88e-03 | 23 |
| GO:00330141 | Esophagus | ESCC | tetrapyrrole biosynthetic process | 23/8552 | 31/18723 | 1.20e-03 | 5.88e-03 | 23 |
| Page: 1 2 3 4 5 6 7 |
| Pathway ID | Tissue | Disease Stage | Description | Gene Ratio | Bg Ratio | pvalue | p.adjust | qvalue | Count |
| hsa0002014 | Esophagus | ESCC | Citrate cycle (TCA cycle) | 27/4205 | 30/8465 | 3.48e-06 | 1.94e-05 | 9.95e-06 | 27 |
| hsa0120023 | Esophagus | ESCC | Carbon metabolism | 79/4205 | 115/8465 | 2.50e-05 | 1.21e-04 | 6.22e-05 | 79 |
| hsa0002015 | Esophagus | ESCC | Citrate cycle (TCA cycle) | 27/4205 | 30/8465 | 3.48e-06 | 1.94e-05 | 9.95e-06 | 27 |
| hsa0120033 | Esophagus | ESCC | Carbon metabolism | 79/4205 | 115/8465 | 2.50e-05 | 1.21e-04 | 6.22e-05 | 79 |
| hsa0064010 | Liver | NAFLD | Propanoate metabolism | 12/1043 | 32/8465 | 2.44e-04 | 4.45e-03 | 3.58e-03 | 12 |
| hsa0120010 | Liver | NAFLD | Carbon metabolism | 26/1043 | 115/8465 | 1.39e-03 | 1.71e-02 | 1.38e-02 | 26 |
| hsa0064011 | Liver | NAFLD | Propanoate metabolism | 12/1043 | 32/8465 | 2.44e-04 | 4.45e-03 | 3.58e-03 | 12 |
| hsa0120011 | Liver | NAFLD | Carbon metabolism | 26/1043 | 115/8465 | 1.39e-03 | 1.71e-02 | 1.38e-02 | 26 |
| hsa0120021 | Liver | Cirrhotic | Carbon metabolism | 64/2530 | 115/8465 | 6.37e-09 | 1.18e-07 | 7.26e-08 | 64 |
| hsa0002010 | Liver | Cirrhotic | Citrate cycle (TCA cycle) | 21/2530 | 30/8465 | 6.56e-06 | 6.24e-05 | 3.84e-05 | 21 |
| hsa0064021 | Liver | Cirrhotic | Propanoate metabolism | 18/2530 | 32/8465 | 1.66e-03 | 8.01e-03 | 4.94e-03 | 18 |
| hsa0120031 | Liver | Cirrhotic | Carbon metabolism | 64/2530 | 115/8465 | 6.37e-09 | 1.18e-07 | 7.26e-08 | 64 |
| hsa0002011 | Liver | Cirrhotic | Citrate cycle (TCA cycle) | 21/2530 | 30/8465 | 6.56e-06 | 6.24e-05 | 3.84e-05 | 21 |
| hsa0064031 | Liver | Cirrhotic | Propanoate metabolism | 18/2530 | 32/8465 | 1.66e-03 | 8.01e-03 | 4.94e-03 | 18 |
| hsa0120041 | Liver | HCC | Carbon metabolism | 89/4020 | 115/8465 | 3.92e-11 | 6.56e-10 | 3.65e-10 | 89 |
| hsa0002021 | Liver | HCC | Citrate cycle (TCA cycle) | 28/4020 | 30/8465 | 1.08e-07 | 1.44e-06 | 8.02e-07 | 28 |
| hsa0064041 | Liver | HCC | Propanoate metabolism | 24/4020 | 32/8465 | 1.42e-03 | 5.07e-03 | 2.82e-03 | 24 |
| hsa0120051 | Liver | HCC | Carbon metabolism | 89/4020 | 115/8465 | 3.92e-11 | 6.56e-10 | 3.65e-10 | 89 |
| hsa0002031 | Liver | HCC | Citrate cycle (TCA cycle) | 28/4020 | 30/8465 | 1.08e-07 | 1.44e-06 | 8.02e-07 | 28 |
| hsa0064051 | Liver | HCC | Propanoate metabolism | 24/4020 | 32/8465 | 1.42e-03 | 5.07e-03 | 2.82e-03 | 24 |
| Page: 1 2 |
Top |
Cell-cell communication analysis |
| Identification of potential cell-cell interactions between two cell types and their ligand-receptor pairs for different disease states |
| Ligand | Receptor | LRpair | Pathway | Tissue | Disease Stage |
| Page: 1 |
Top |
Single-cell gene regulatory network inference analysis |
| Find out the significant the regulons (TFs) and the target genes of each regulon across cell types for different disease states |
| TF | Cell Type | Tissue | Disease Stage | Target Gene | RSS | Regulon Activity |
| ∗The dot plots of a searched regulon are shown for all cell subpopulations in each disease state of each tissue based on the regulon specific score inferred using pySCENIC and by calculating the average expression. |
| Page: 1 |
Top |
Somatic mutation of malignant transformation related genes |
| Annotation of somatic variants for genes involved in malignant transformation |
| Hugo Symbol | Variant Class | Variant Classification | dbSNP RS | HGVSc | HGVSp | HGVSp Short | SWISSPROT | BIOTYPE | SIFT | PolyPhen | Tumor Sample Barcode | Tissue | Histology | Sex | Age | Stage | Therapy Types | Drugs | Outcome |
| SUCLA2 | SNV | Missense_Mutation | c.1043T>G | p.Val348Gly | p.V348G | Q9P2R7 | protein_coding | deleterious(0.03) | possibly_damaging(0.521) | TCGA-A2-A0SW-01 | Breast | breast invasive carcinoma | Female | >=65 | III/IV | Hormone Therapy | arimidex | PD | |
| SUCLA2 | SNV | Missense_Mutation | novel | c.1195N>A | p.Glu399Lys | p.E399K | Q9P2R7 | protein_coding | tolerated(0.21) | benign(0.006) | TCGA-AN-A046-01 | Breast | breast invasive carcinoma | Female | >=65 | I/II | Unknown | Unknown | SD |
| SUCLA2 | SNV | Missense_Mutation | c.388G>A | p.Ala130Thr | p.A130T | Q9P2R7 | protein_coding | tolerated(0.28) | benign(0.015) | TCGA-BH-A0BF-01 | Breast | breast invasive carcinoma | Female | <65 | I/II | Unknown | Unknown | SD | |
| SUCLA2 | insertion | Frame_Shift_Ins | novel | c.1182_1183insAGAAAACACT | p.Val395ArgfsTer10 | p.V395Rfs*10 | Q9P2R7 | protein_coding | TCGA-AR-A0U2-01 | Breast | breast invasive carcinoma | Female | <65 | III/IV | Hormone Therapy | tamoxiphen | PD | ||
| SUCLA2 | SNV | Missense_Mutation | novel | c.259G>A | p.Ala87Thr | p.A87T | Q9P2R7 | protein_coding | deleterious(0.01) | probably_damaging(0.969) | TCGA-2W-A8YY-01 | Cervix | cervical & endocervical cancer | Female | <65 | I/II | Chemotherapy | cisplatin | CR |
| SUCLA2 | SNV | Missense_Mutation | c.196G>A | p.Glu66Lys | p.E66K | Q9P2R7 | protein_coding | tolerated(0.56) | benign(0.034) | TCGA-A6-2684-01 | Colorectum | colon adenocarcinoma | Female | >=65 | I/II | Unknown | Unknown | PD | |
| SUCLA2 | SNV | Missense_Mutation | c.988N>A | p.Ala330Thr | p.A330T | Q9P2R7 | protein_coding | deleterious(0) | probably_damaging(0.956) | TCGA-A6-5665-01 | Colorectum | colon adenocarcinoma | Female | >=65 | I/II | Unknown | Unknown | PD | |
| SUCLA2 | SNV | Missense_Mutation | c.1035N>G | p.Phe345Leu | p.F345L | Q9P2R7 | protein_coding | deleterious(0) | probably_damaging(0.966) | TCGA-AA-3506-01 | Colorectum | colon adenocarcinoma | Male | >=65 | I/II | Unknown | Unknown | SD | |
| SUCLA2 | SNV | Missense_Mutation | novel | c.1219N>T | p.Arg407Trp | p.R407W | Q9P2R7 | protein_coding | deleterious(0) | probably_damaging(1) | TCGA-AA-3845-01 | Colorectum | colon adenocarcinoma | Female | >=65 | I/II | Unknown | Unknown | PD |
| SUCLA2 | SNV | Missense_Mutation | rs370898100 | c.479G>A | p.Arg160Gln | p.R160Q | Q9P2R7 | protein_coding | deleterious(0) | probably_damaging(0.954) | TCGA-AA-3848-01 | Colorectum | colon adenocarcinoma | Female | >=65 | III/IV | Unknown | Unknown | PD |
| Page: 1 2 3 4 5 |
Top |
Related drugs of malignant transformation related genes |
| Identification of chemicals and drugs interact with genes involved in malignant transfromation |
| (DGIdb 4.0) |
| Entrez ID | Symbol | Category | Interaction Types | Drug Claim Name | Drug Name | PMIDs |
| Page: 1 |

Copyright 2023-Present -The University of Texas Health Science Center at Houston |