
|
|||||
|
 | |
| |
| |
| |
| |
| |
|
Gene: SUB1 |
Gene summary for SUB1 |
| Gene information | Species | Human | Gene symbol | SUB1 | Gene ID | 10923 |
| Gene name | SUB1 regulator of transcription | |
| Gene Alias | P15 | |
| Cytomap | 5p13.3 | |
| Gene Type | protein-coding | GO ID | GO:0006139 | UniProtAcc | P53999 |
Top |
Malignant transformation analysis |
| Identification of the aberrant gene expression in precancerous and cancerous lesions by comparing the gene expression of stem-like cells in diseased tissues with normal stem cells |
| Entrez ID | Symbol | Replicates | Species | Organ | Tissue | Adj P-value | Log2FC | Malignancy |
| 10923 | SUB1 | GSM4909281 | Human | Breast | IDC | 1.12e-51 | 6.90e-01 | 0.21 |
| 10923 | SUB1 | GSM4909282 | Human | Breast | IDC | 1.68e-59 | 7.24e-01 | -0.0288 |
| 10923 | SUB1 | GSM4909285 | Human | Breast | IDC | 6.19e-05 | 3.54e-01 | 0.21 |
| 10923 | SUB1 | GSM4909286 | Human | Breast | IDC | 5.83e-07 | 1.53e-02 | 0.1081 |
| 10923 | SUB1 | GSM4909287 | Human | Breast | IDC | 7.80e-32 | 5.36e-01 | 0.2057 |
| 10923 | SUB1 | GSM4909288 | Human | Breast | IDC | 4.02e-09 | 4.22e-01 | 0.0988 |
| 10923 | SUB1 | GSM4909290 | Human | Breast | IDC | 4.75e-14 | 4.36e-01 | 0.2096 |
| 10923 | SUB1 | GSM4909294 | Human | Breast | IDC | 3.64e-38 | 4.52e-01 | 0.2022 |
| 10923 | SUB1 | GSM4909296 | Human | Breast | IDC | 3.01e-14 | -1.45e-01 | 0.1524 |
| 10923 | SUB1 | GSM4909297 | Human | Breast | IDC | 7.04e-27 | -1.26e-01 | 0.1517 |
| 10923 | SUB1 | GSM4909298 | Human | Breast | IDC | 1.63e-05 | 2.83e-01 | 0.1551 |
| 10923 | SUB1 | GSM4909301 | Human | Breast | IDC | 5.31e-116 | 9.94e-01 | 0.1577 |
| 10923 | SUB1 | GSM4909303 | Human | Breast | IDC | 1.88e-09 | 4.43e-01 | 0.0438 |
| 10923 | SUB1 | GSM4909308 | Human | Breast | IDC | 1.36e-14 | 3.97e-01 | 0.158 |
| 10923 | SUB1 | GSM4909311 | Human | Breast | IDC | 5.34e-57 | -6.51e-01 | 0.1534 |
| 10923 | SUB1 | GSM4909312 | Human | Breast | IDC | 2.70e-16 | -2.05e-01 | 0.1552 |
| 10923 | SUB1 | GSM4909313 | Human | Breast | IDC | 5.28e-04 | 1.15e-02 | 0.0391 |
| 10923 | SUB1 | GSM4909315 | Human | Breast | IDC | 2.47e-30 | 5.15e-01 | 0.21 |
| 10923 | SUB1 | GSM4909316 | Human | Breast | IDC | 4.79e-26 | 6.11e-01 | 0.21 |
| 10923 | SUB1 | GSM4909318 | Human | Breast | IDC | 7.11e-12 | 4.74e-01 | 0.2031 |
| Page: 1 2 3 4 5 6 7 8 9 10 11 12 13 14 15 |
| Tissue | Expression Dynamics | Abbreviation |
| Breast | 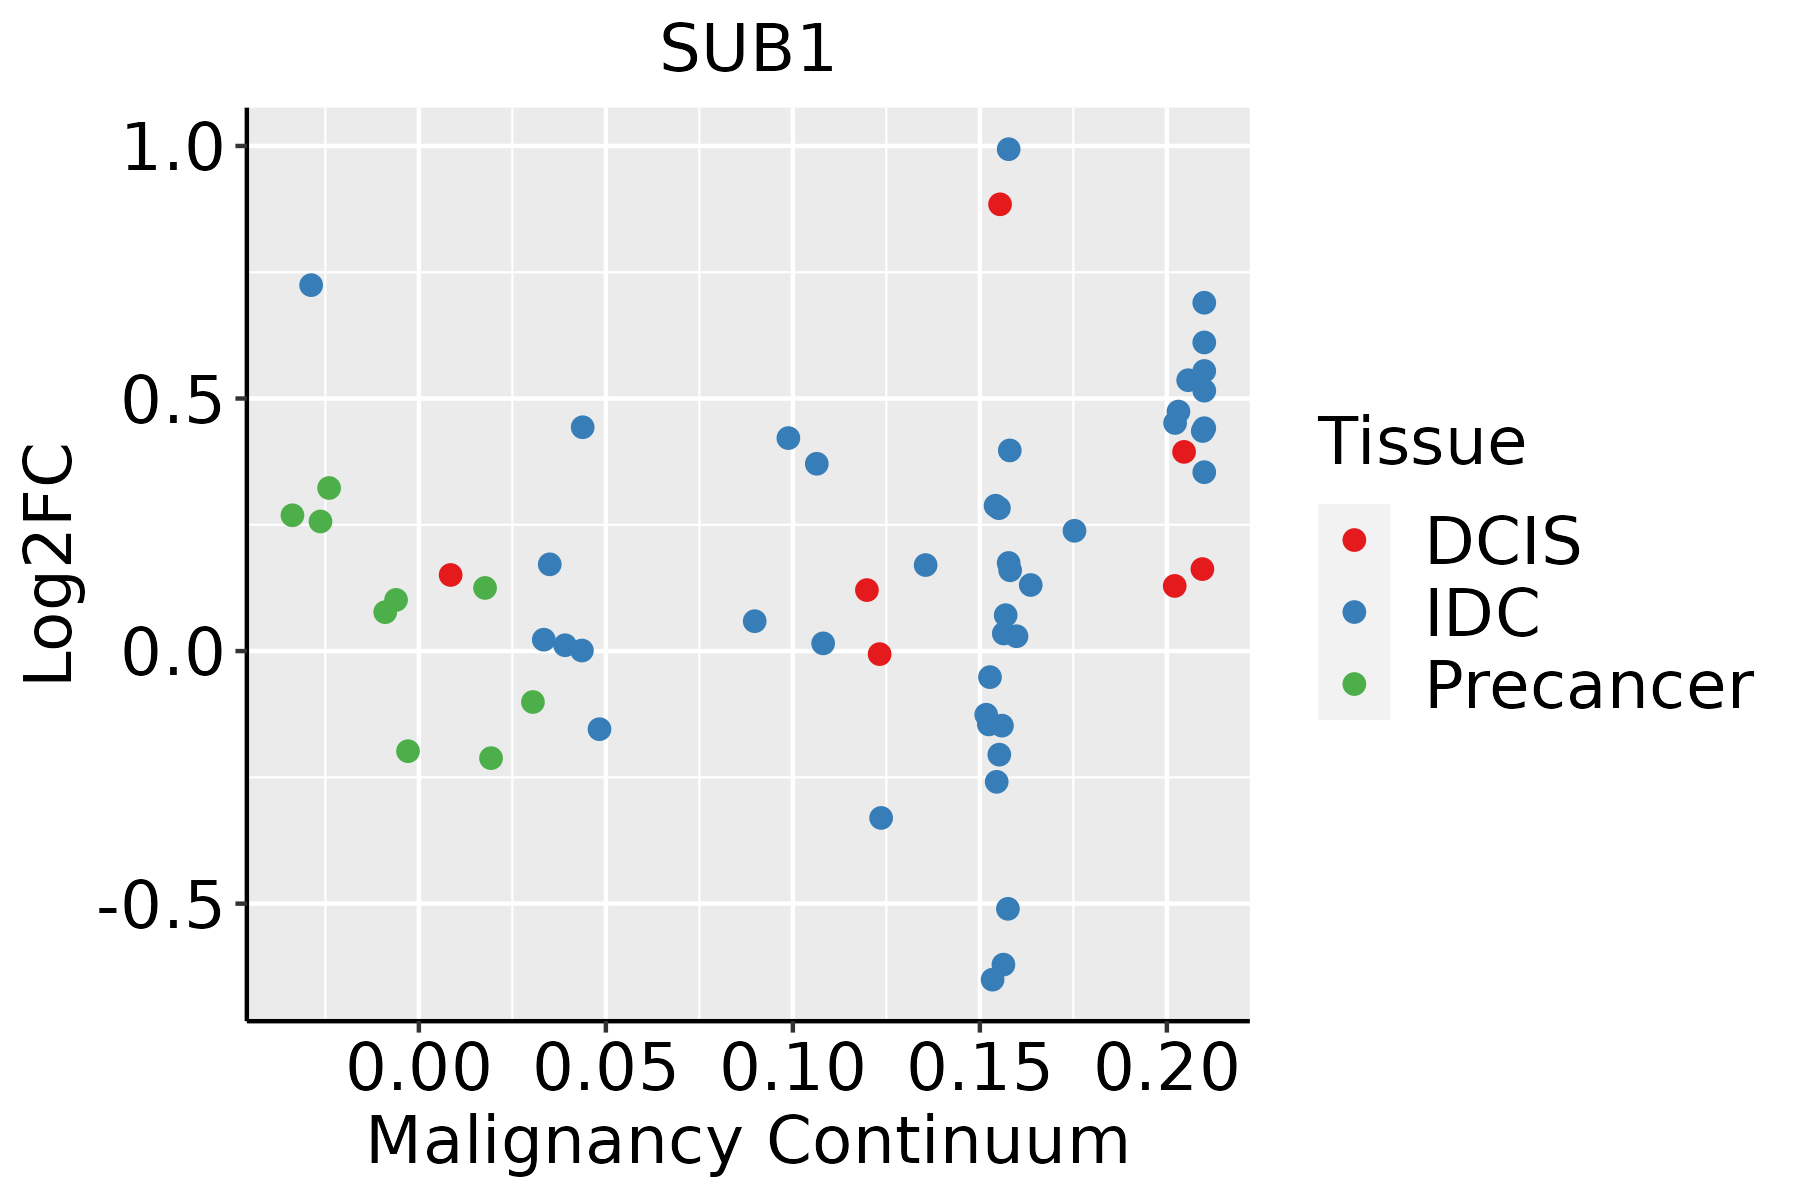 | IDC: Invasive ductal carcinoma |
| DCIS: Ductal carcinoma in situ | ||
| Precancer(BRCA1-mut): Precancerous lesion from BRCA1 mutation carriers | ||
| Cervix | 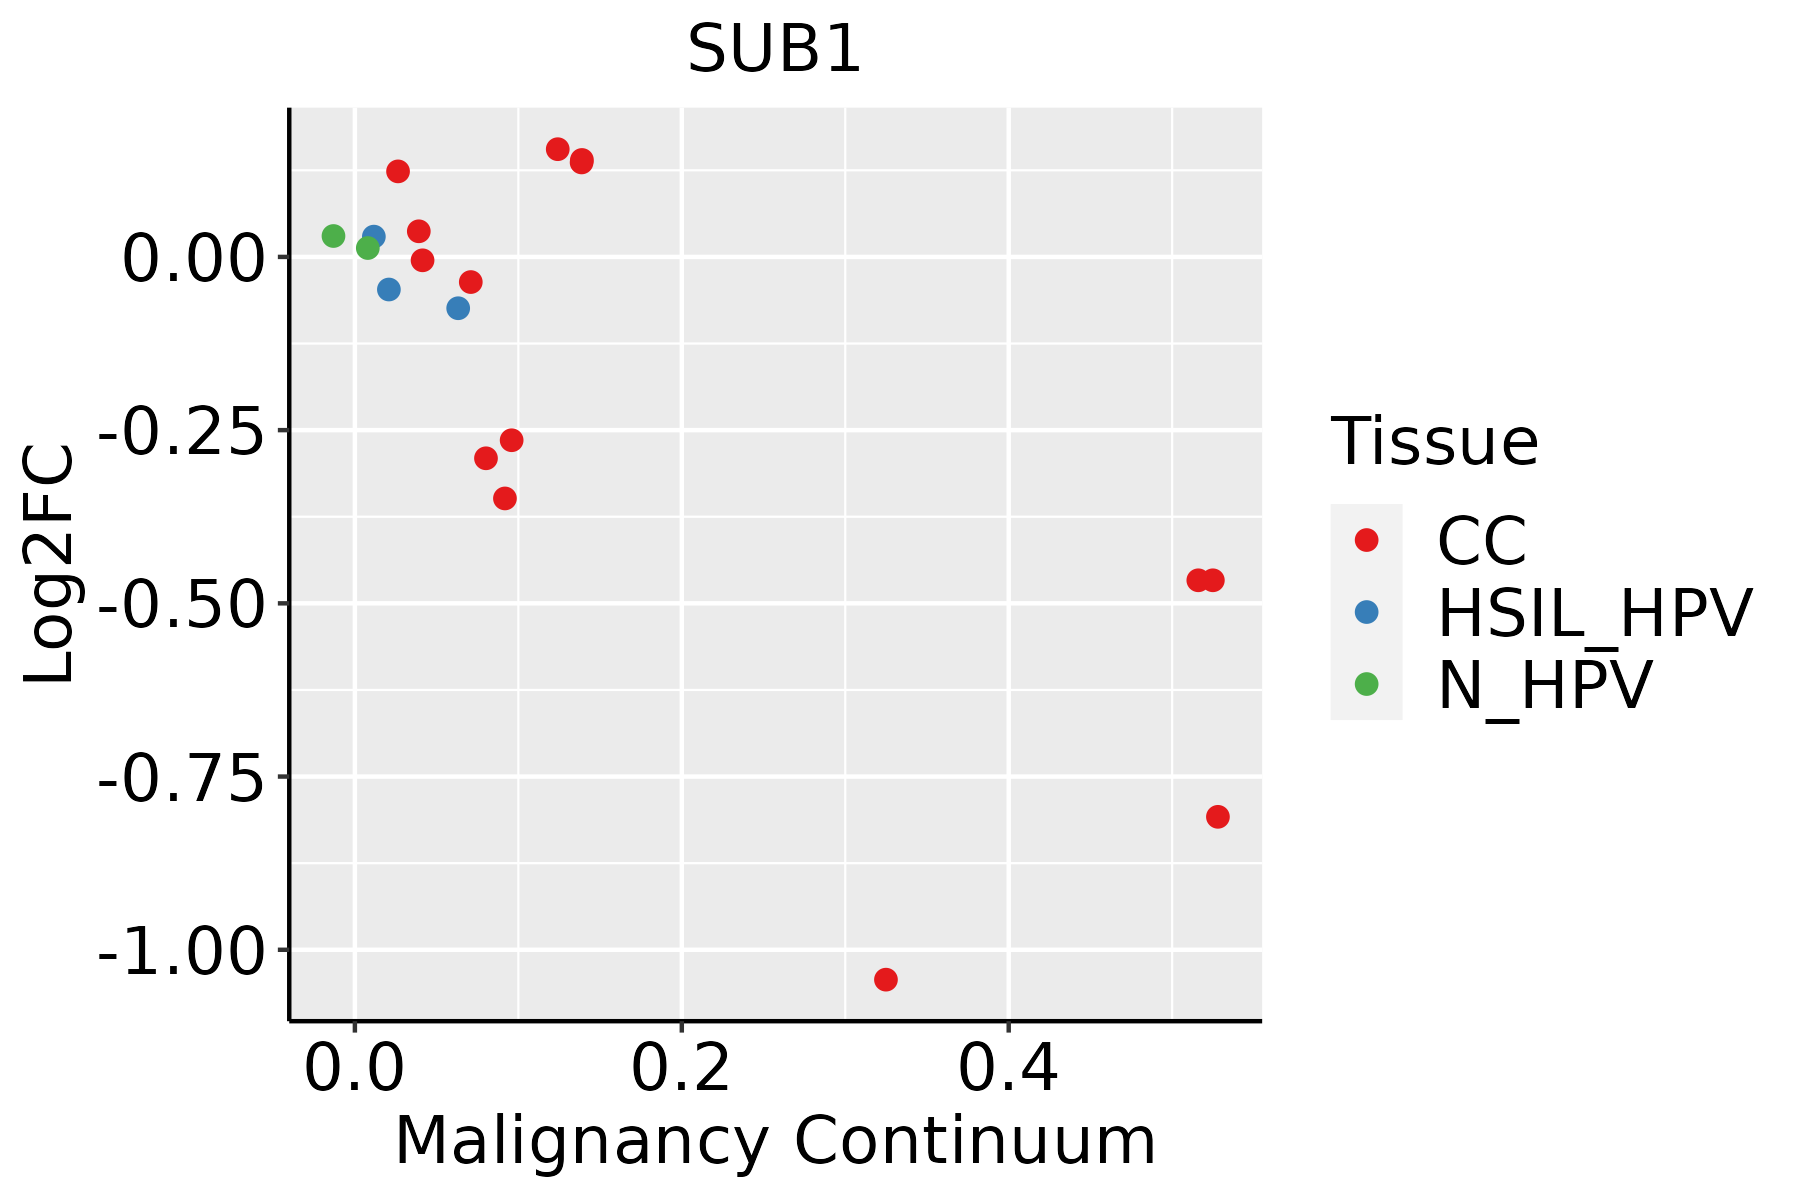 | CC: Cervix cancer |
| HSIL_HPV: HPV-infected high-grade squamous intraepithelial lesions | ||
| N_HPV: HPV-infected normal cervix | ||
| Colorectum (GSE201348) |  | FAP: Familial adenomatous polyposis |
| CRC: Colorectal cancer | ||
| Colorectum (HTA11) |  | AD: Adenomas |
| SER: Sessile serrated lesions | ||
| MSI-H: Microsatellite-high colorectal cancer | ||
| MSS: Microsatellite stable colorectal cancer | ||
| Endometrium | 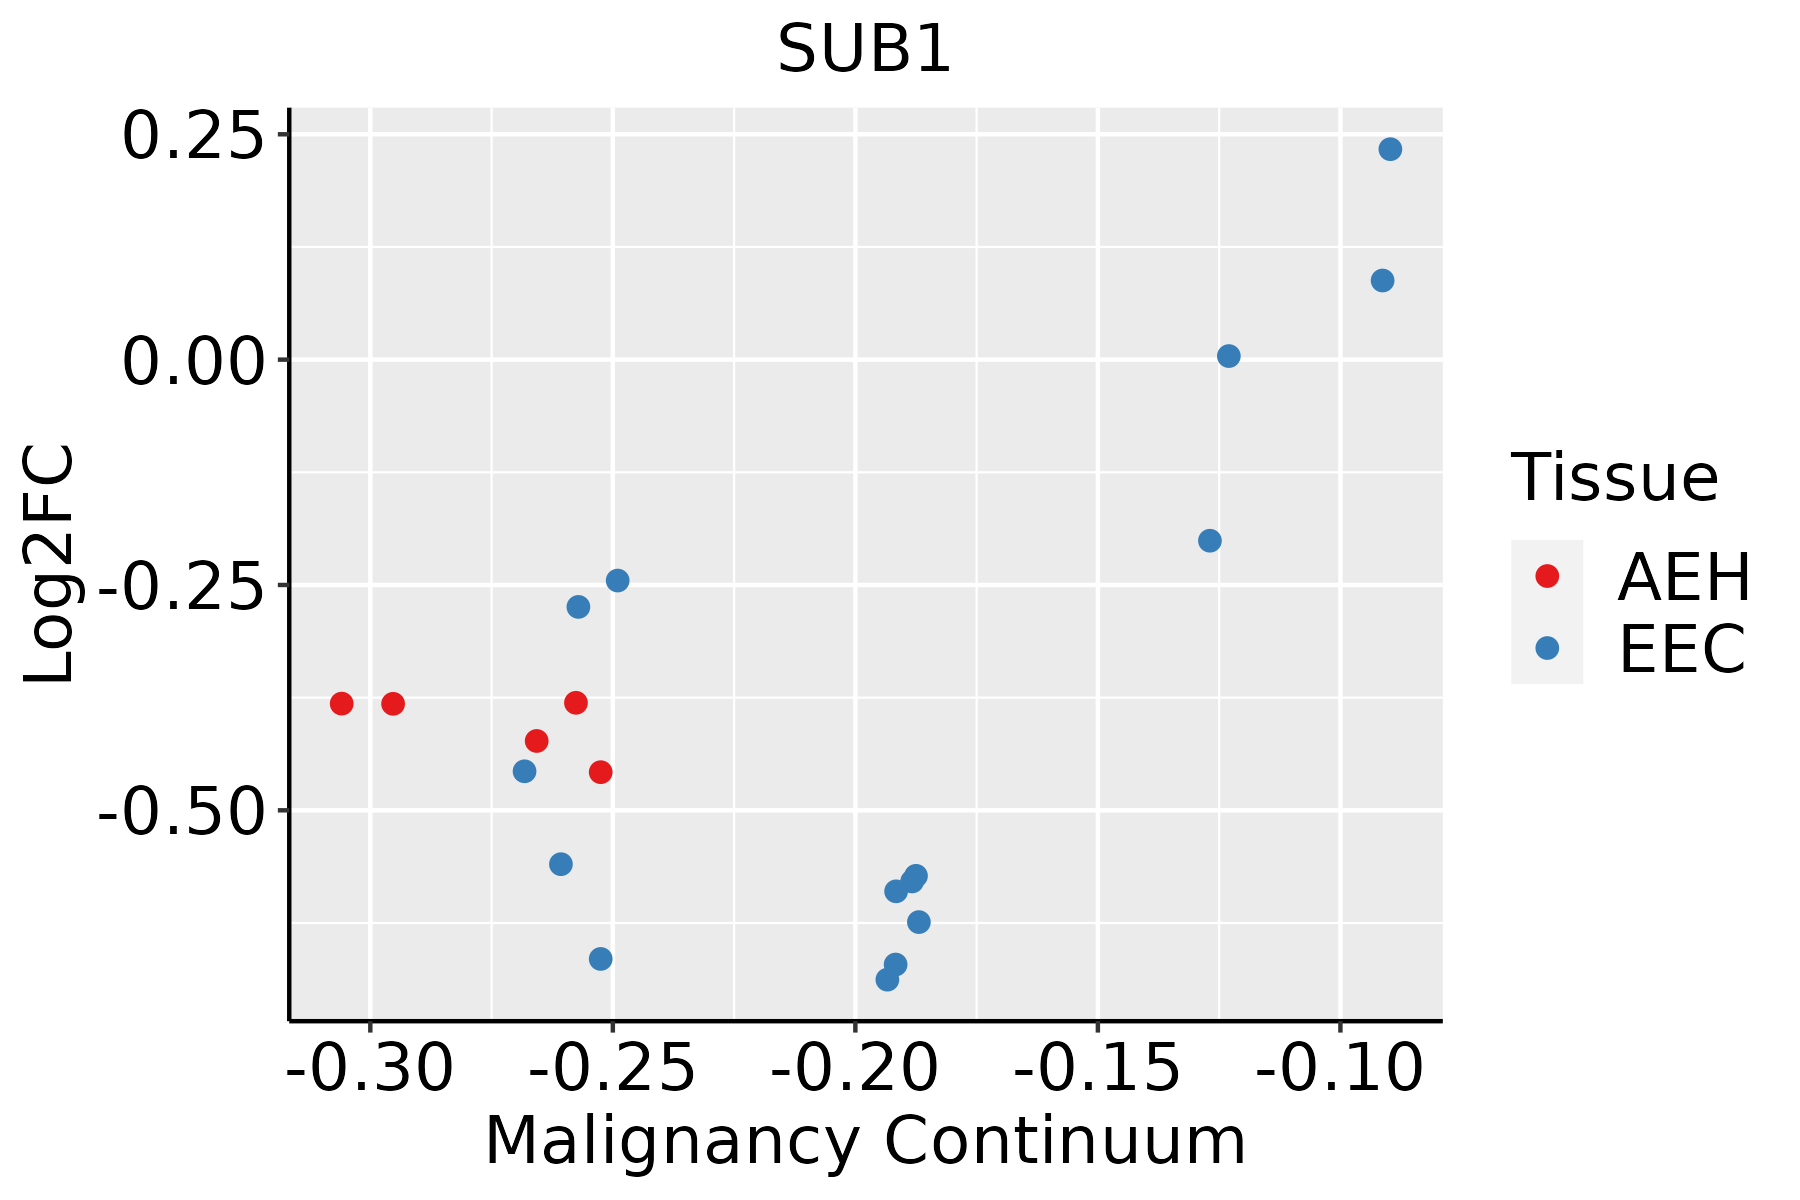 | AEH: Atypical endometrial hyperplasia |
| EEC: Endometrioid Cancer | ||
| Esophagus | 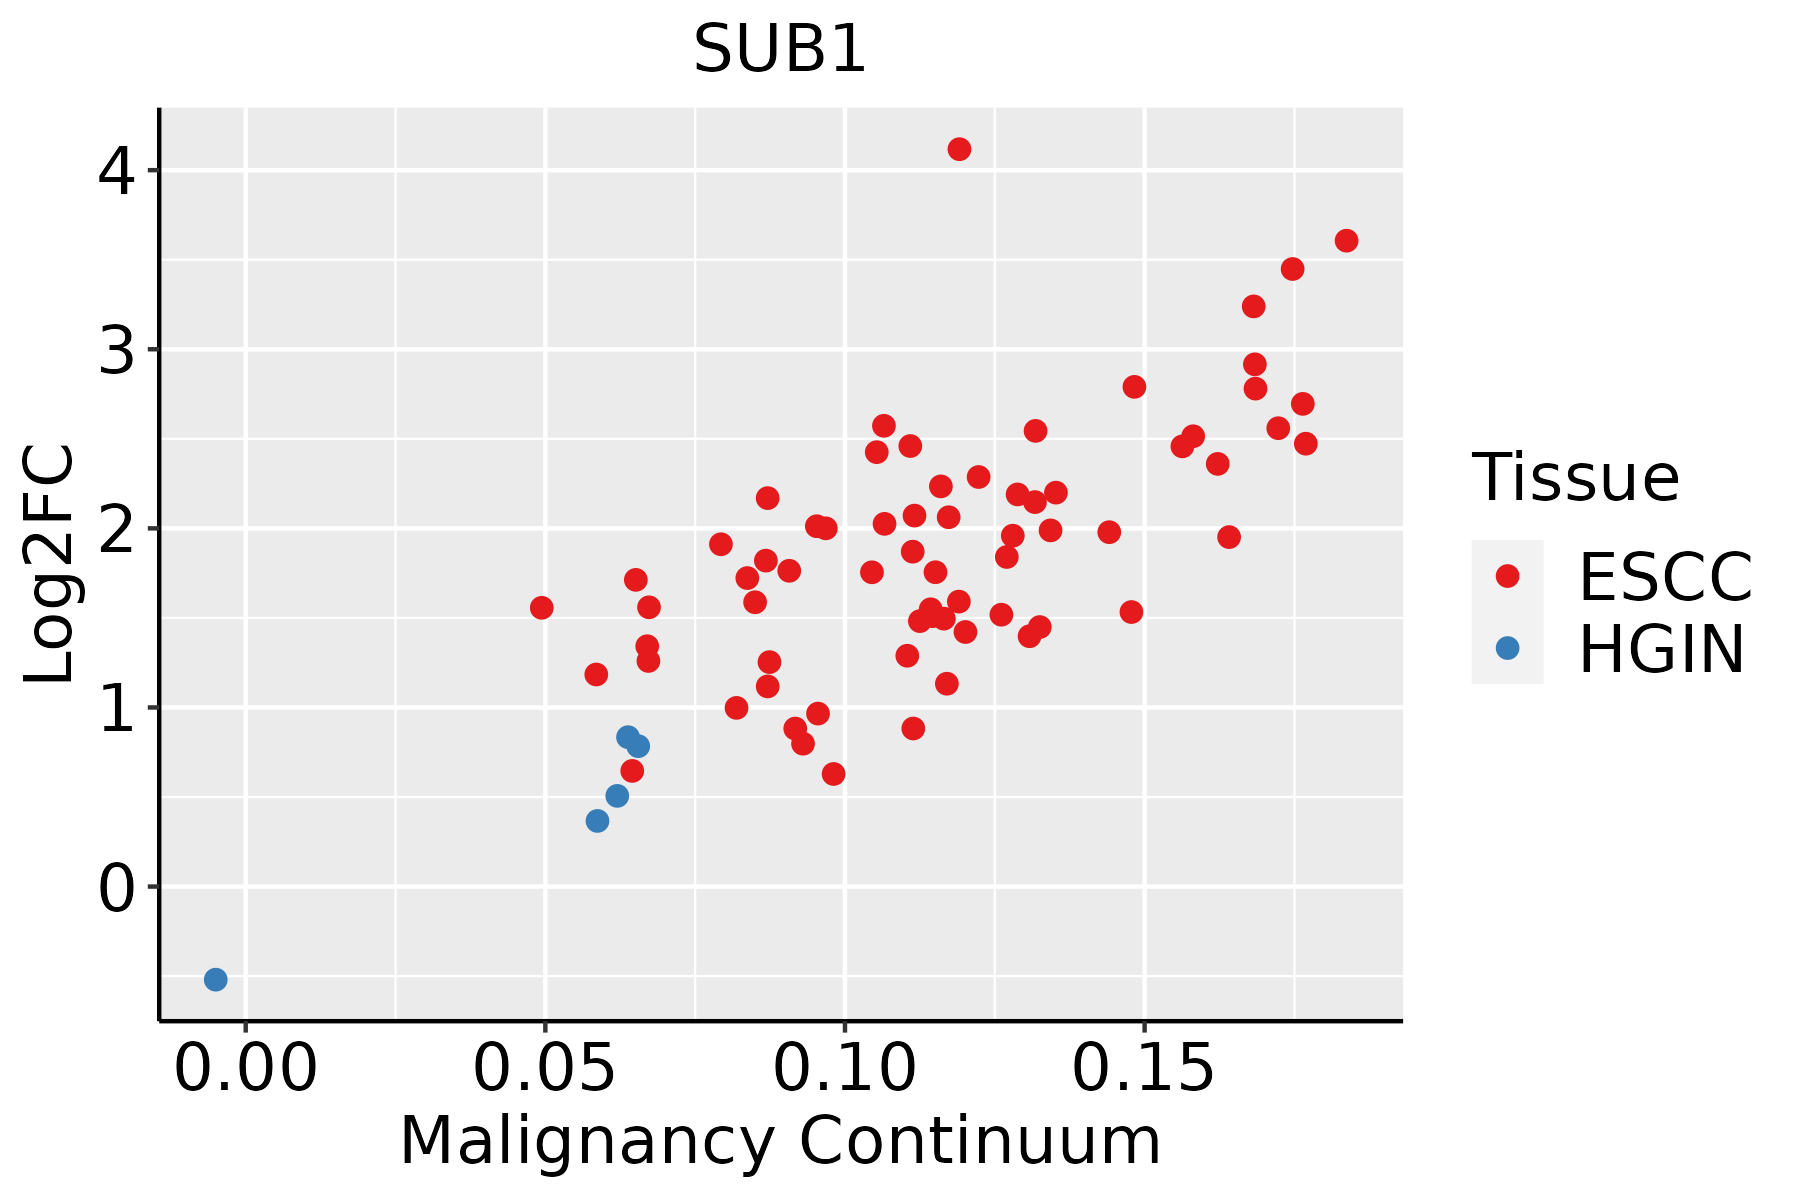 | ESCC: Esophageal squamous cell carcinoma |
| HGIN: High-grade intraepithelial neoplasias | ||
| LGIN: Low-grade intraepithelial neoplasias | ||
| GC | 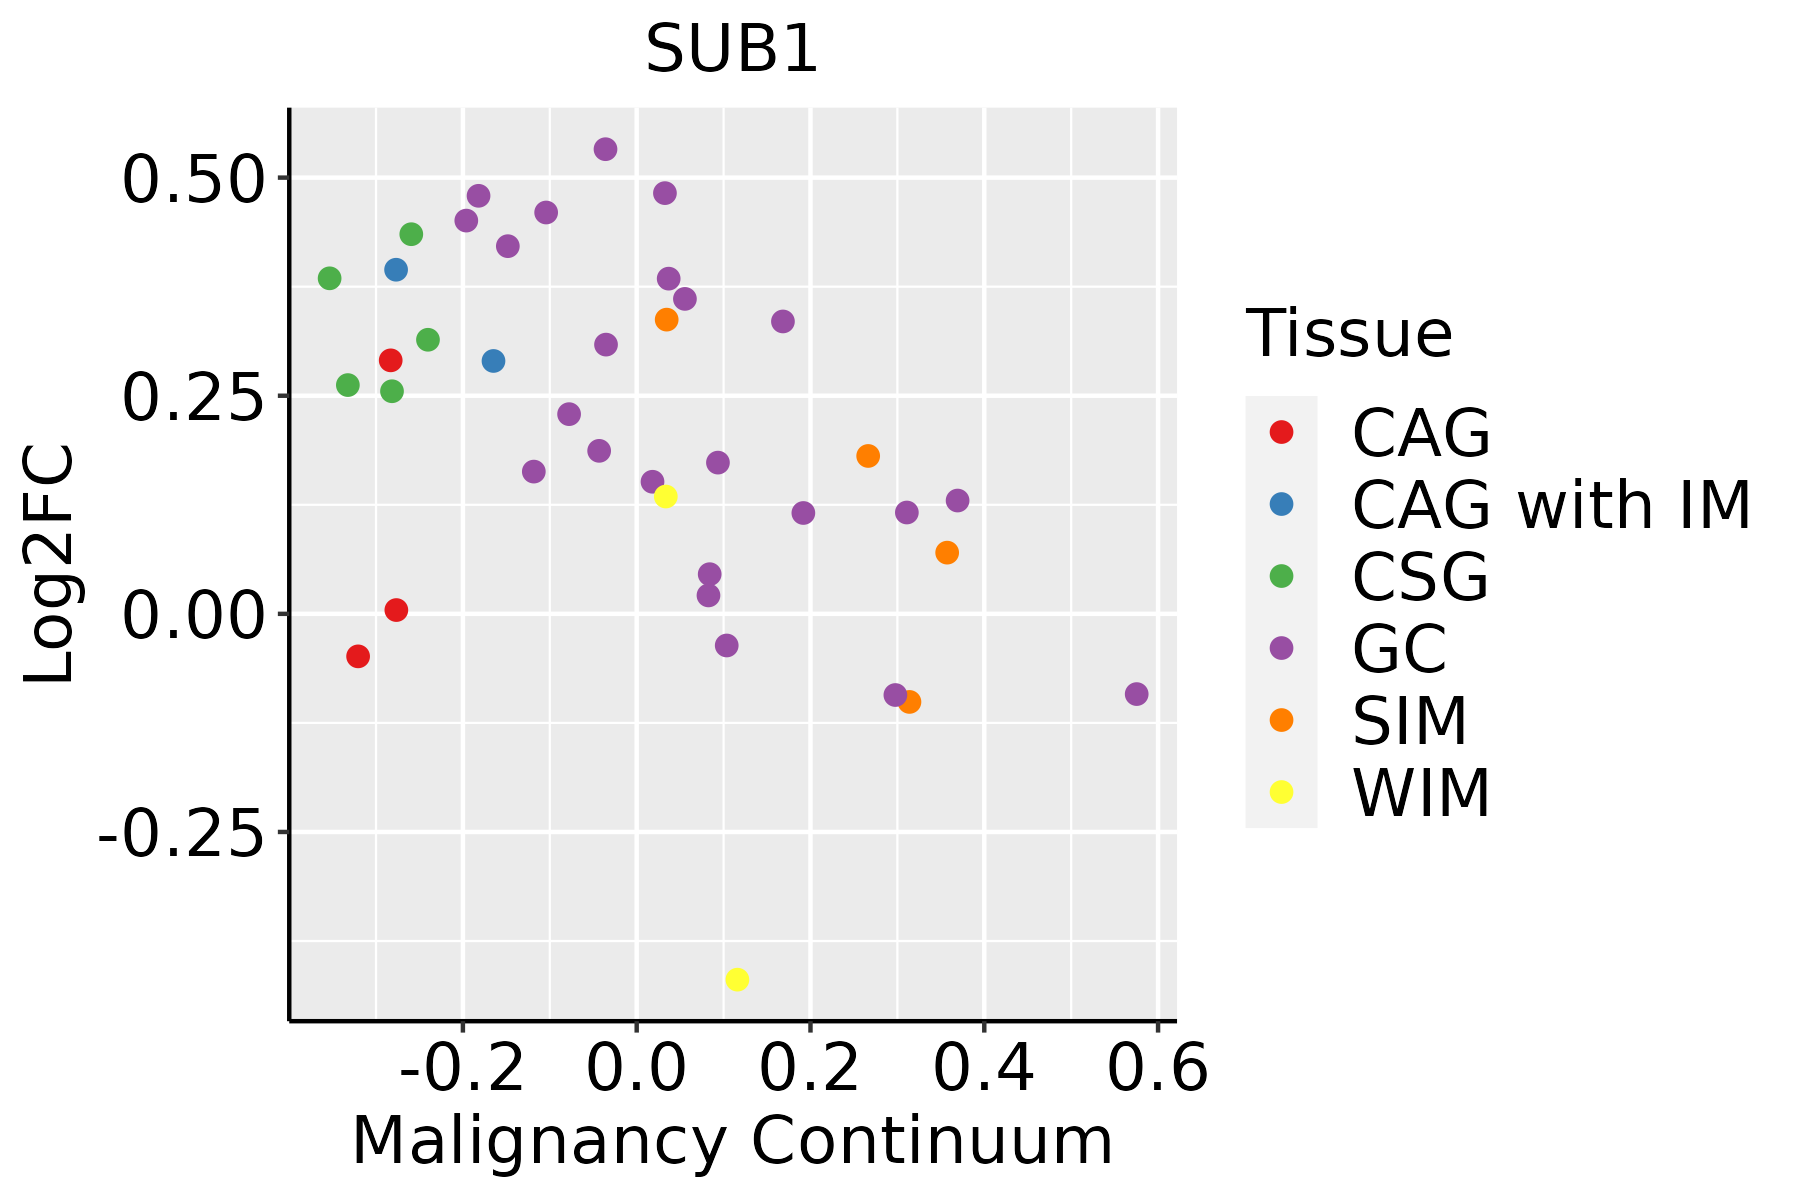 | CAG: Chronic atrophic gastritis |
| CAG with IM: Chronic atrophic gastritis with intestinal metaplasia | ||
| CSG: Chronic superficial gastritis | ||
| GC: Gastric cancer | ||
| SIM: Severe intestinal metaplasia | ||
| WIM: Wild intestinal metaplasia | ||
| Liver |  | HCC: Hepatocellular carcinoma |
| NAFLD: Non-alcoholic fatty liver disease | ||
| Oral Cavity |  | EOLP: Erosive Oral lichen planus |
| LP: leukoplakia | ||
| NEOLP: Non-erosive oral lichen planus | ||
| OSCC: Oral squamous cell carcinoma | ||
| Prostate | 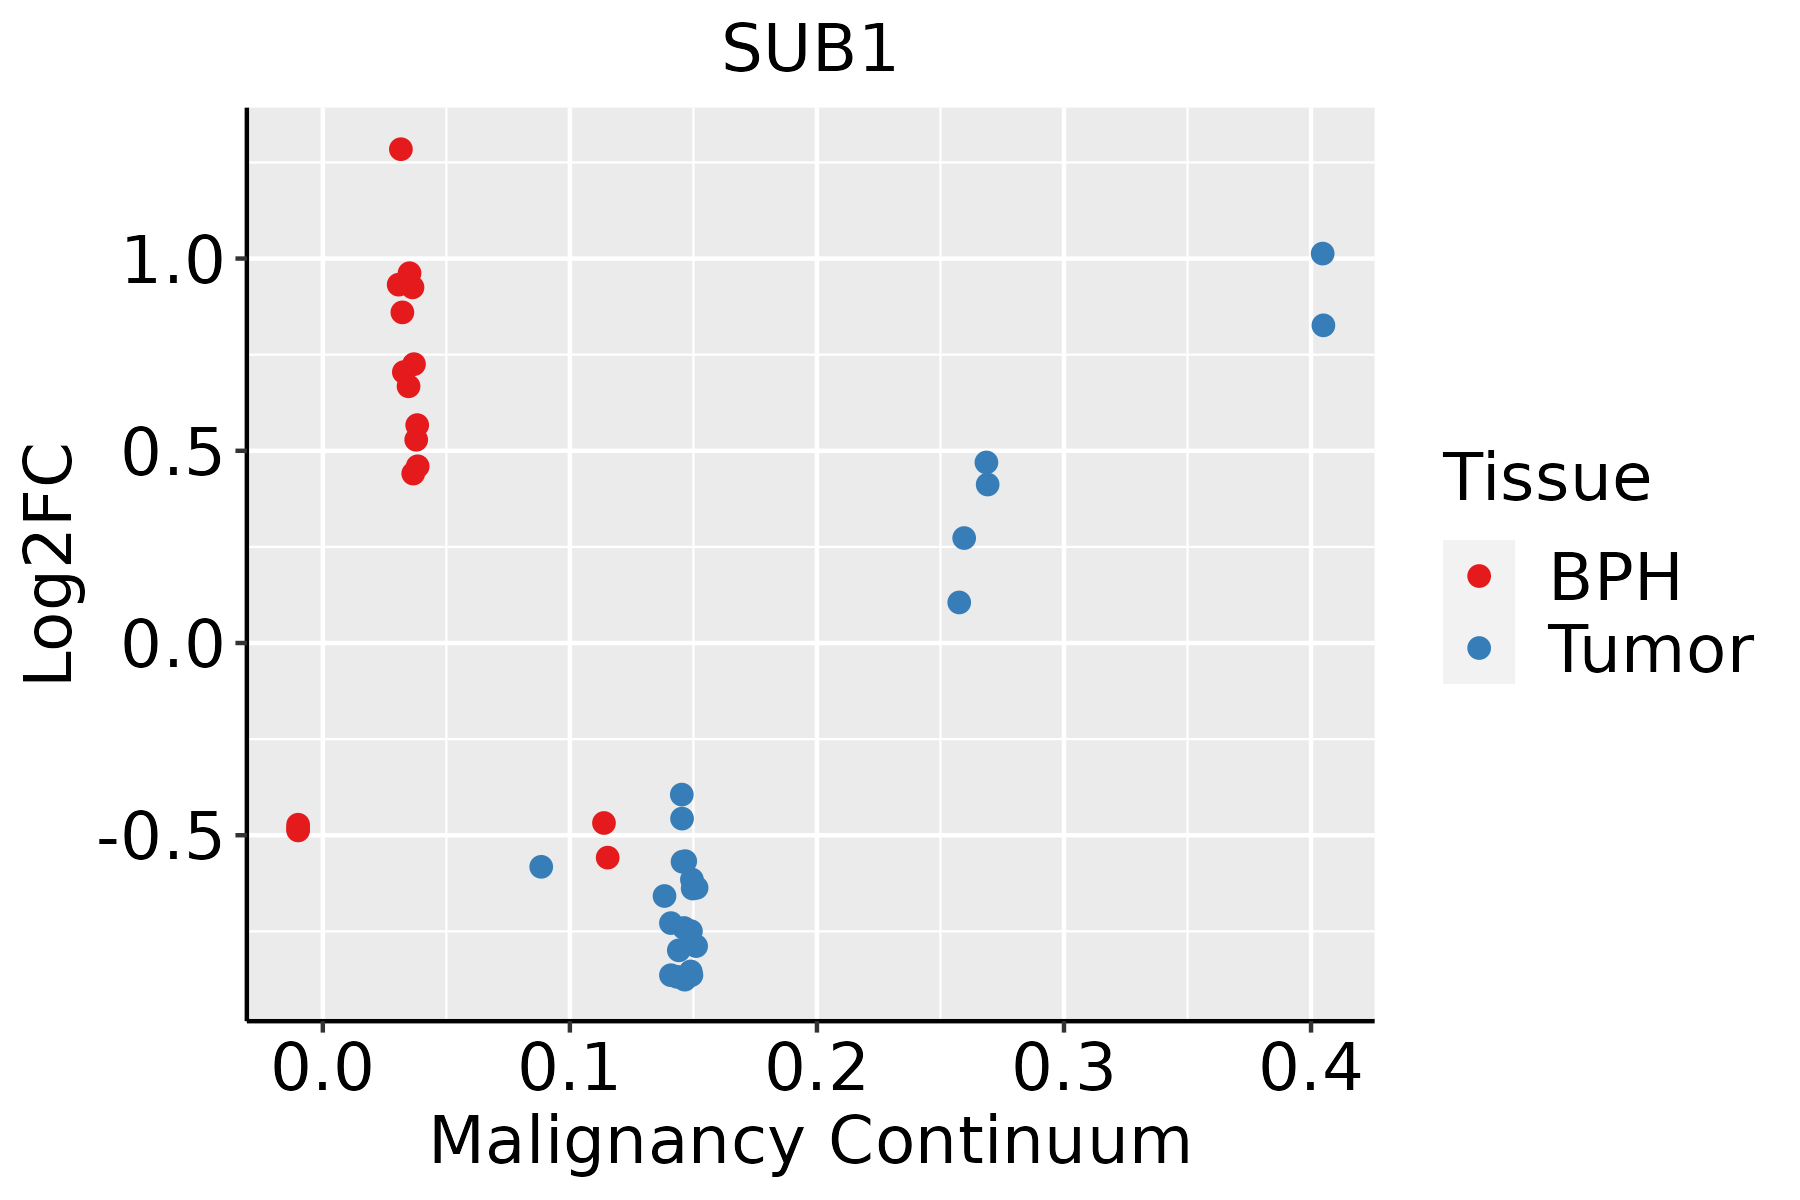 | BPH: Benign Prostatic Hyperplasia |
| Skin |  | AK: Actinic keratosis |
| cSCC: Cutaneous squamous cell carcinoma | ||
| SCCIS:squamous cell carcinoma in situ | ||
| Thyroid | 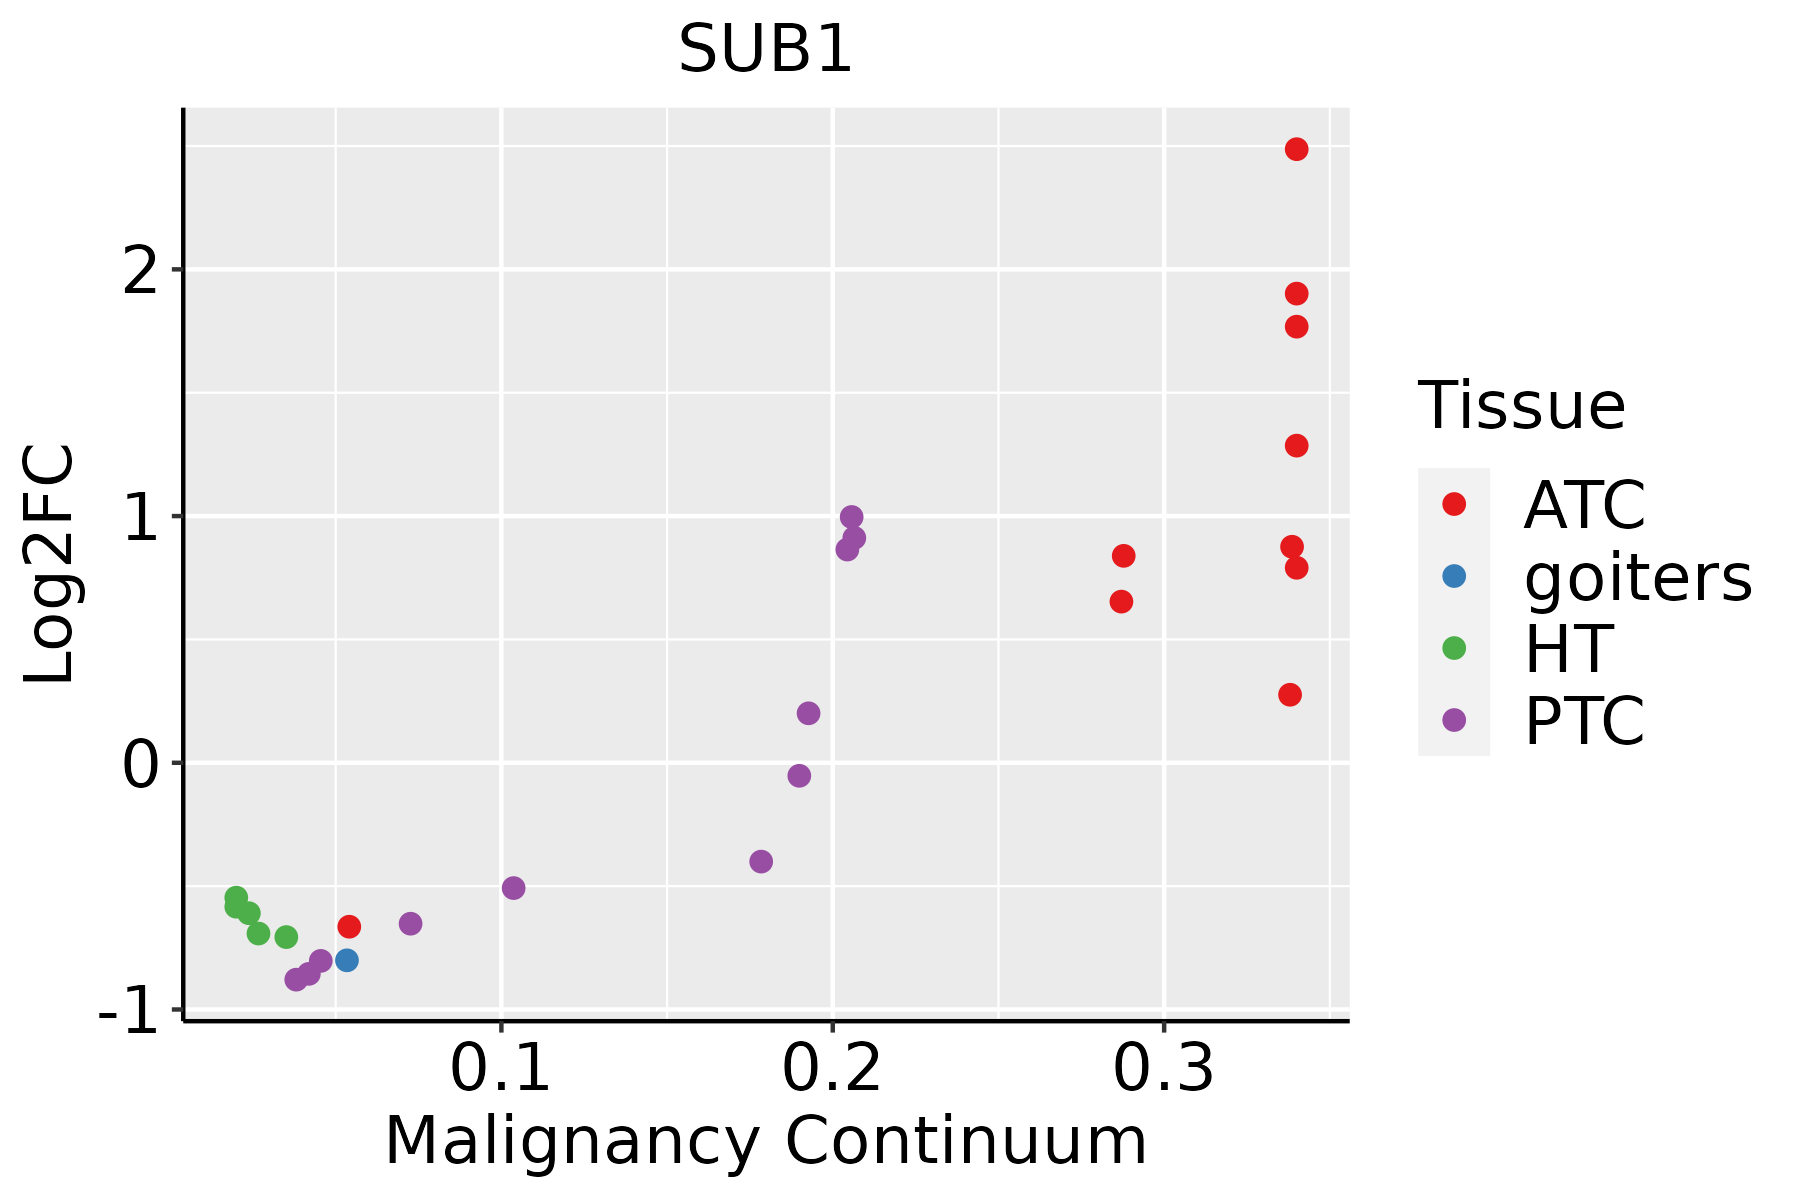 | ATC: Anaplastic thyroid cancer |
| HT: Hashimoto's thyroiditis | ||
| PTC: Papillary thyroid cancer |
| ∗log2FC in expression of this searched gene in stem-like cells from each diseased tissue sample relative to stem-like cells in normal samples in each tissue plotted against the malignancy continuum. Samples are colored based on if they are from different disease stage. |
Top |
Malignant transformation related pathway analysis |
| Find out the enriched GO biological processes and KEGG pathways involved in transition from healthy to precancer to cancer |
| Tissue | Disease Stage | Enriched GO biological Processes |
| Colorectum | AD |  |
| Colorectum | SER |  |
| Colorectum | MSS |  |
| Colorectum | MSI-H |  |
| Colorectum | FAP |  |
| ∗Top 15 enriched GO BP terms are showed in the bar plot of each disease state in each tissue. Each row represents a significant GO biological process which is colored according to the -log10(p.adjust). |
| Page: 1 2 3 4 5 6 7 8 9 |
| GO ID | Tissue | Disease Stage | Description | Gene Ratio | Bg Ratio | pvalue | p.adjust | Count |
| GO:00071786 | Cervix | CC | transmembrane receptor protein serine/threonine kinase signaling pathway | 67/2311 | 355/18723 | 2.39e-04 | 2.67e-03 | 67 |
| GO:00510528 | Cervix | CC | regulation of DNA metabolic process | 65/2311 | 359/18723 | 9.25e-04 | 7.84e-03 | 65 |
| GO:0051052 | Colorectum | AD | regulation of DNA metabolic process | 116/3918 | 359/18723 | 2.47e-07 | 1.00e-05 | 116 |
| GO:0007178 | Colorectum | AD | transmembrane receptor protein serine/threonine kinase signaling pathway | 99/3918 | 355/18723 | 9.92e-04 | 9.28e-03 | 99 |
| GO:0060395 | Colorectum | AD | SMAD protein signal transduction | 28/3918 | 82/18723 | 3.73e-03 | 2.63e-02 | 28 |
| GO:00510522 | Colorectum | MSS | regulation of DNA metabolic process | 108/3467 | 359/18723 | 5.86e-08 | 3.10e-06 | 108 |
| GO:00071781 | Colorectum | MSS | transmembrane receptor protein serine/threonine kinase signaling pathway | 86/3467 | 355/18723 | 4.04e-03 | 2.95e-02 | 86 |
| GO:00510524 | Colorectum | FAP | regulation of DNA metabolic process | 84/2622 | 359/18723 | 9.80e-07 | 4.38e-05 | 84 |
| GO:00071782 | Colorectum | FAP | transmembrane receptor protein serine/threonine kinase signaling pathway | 81/2622 | 355/18723 | 4.28e-06 | 1.46e-04 | 81 |
| GO:00603951 | Colorectum | FAP | SMAD protein signal transduction | 24/2622 | 82/18723 | 2.55e-04 | 3.51e-03 | 24 |
| GO:00071787 | Endometrium | AEH | transmembrane receptor protein serine/threonine kinase signaling pathway | 67/2100 | 355/18723 | 1.28e-05 | 2.80e-04 | 67 |
| GO:000717814 | Endometrium | EEC | transmembrane receptor protein serine/threonine kinase signaling pathway | 68/2168 | 355/18723 | 1.90e-05 | 3.50e-04 | 68 |
| GO:005105215 | Esophagus | ESCC | regulation of DNA metabolic process | 232/8552 | 359/18723 | 2.40e-13 | 1.13e-11 | 232 |
| GO:00063673 | Esophagus | ESCC | transcription initiation from RNA polymerase II promoter | 56/8552 | 77/18723 | 1.30e-06 | 1.59e-05 | 56 |
| GO:000635211 | Esophagus | ESCC | DNA-templated transcription, initiation | 86/8552 | 130/18723 | 1.88e-06 | 2.19e-05 | 86 |
| GO:000717810 | Esophagus | ESCC | transmembrane receptor protein serine/threonine kinase signaling pathway | 195/8552 | 355/18723 | 2.58e-04 | 1.58e-03 | 195 |
| GO:00602603 | Esophagus | ESCC | regulation of transcription initiation from RNA polymerase II promoter | 25/8552 | 33/18723 | 4.30e-04 | 2.43e-03 | 25 |
| GO:200014212 | Esophagus | ESCC | regulation of DNA-templated transcription, initiation | 29/8552 | 40/18723 | 5.32e-04 | 2.93e-03 | 29 |
| GO:20001443 | Esophagus | ESCC | positive regulation of DNA-templated transcription, initiation | 21/8552 | 31/18723 | 1.10e-02 | 3.70e-02 | 21 |
| GO:0051053 | Liver | NAFLD | negative regulation of DNA metabolic process | 26/1882 | 125/18723 | 2.52e-04 | 4.12e-03 | 26 |
| Page: 1 2 3 4 |
| Pathway ID | Tissue | Disease Stage | Description | Gene Ratio | Bg Ratio | pvalue | p.adjust | qvalue | Count |
| Page: 1 |
Top |
Cell-cell communication analysis |
| Identification of potential cell-cell interactions between two cell types and their ligand-receptor pairs for different disease states |
| Ligand | Receptor | LRpair | Pathway | Tissue | Disease Stage |
| Page: 1 |
Top |
Single-cell gene regulatory network inference analysis |
| Find out the significant the regulons (TFs) and the target genes of each regulon across cell types for different disease states |
| TF | Cell Type | Tissue | Disease Stage | Target Gene | RSS | Regulon Activity |
| ∗The dot plots of a searched regulon are shown for all cell subpopulations in each disease state of each tissue based on the regulon specific score inferred using pySCENIC and by calculating the average expression. |
| Page: 1 |
Top |
Somatic mutation of malignant transformation related genes |
| Annotation of somatic variants for genes involved in malignant transformation |
| Hugo Symbol | Variant Class | Variant Classification | dbSNP RS | HGVSc | HGVSp | HGVSp Short | SWISSPROT | BIOTYPE | SIFT | PolyPhen | Tumor Sample Barcode | Tissue | Histology | Sex | Age | Stage | Therapy Types | Drugs | Outcome |
| SUB1 | SNV | Missense_Mutation | rs766762636 | c.170N>A | p.Ser57Asn | p.S57N | P53999 | protein_coding | tolerated(0.42) | benign(0.018) | TCGA-A8-A09Z-01 | Breast | breast invasive carcinoma | Female | >=65 | I/II | Unknown | Unknown | SD |
| SUB1 | SNV | Missense_Mutation | c.120A>T | p.Gln40His | p.Q40H | P53999 | protein_coding | tolerated(0.05) | probably_damaging(0.921) | TCGA-AA-3977-01 | Colorectum | colon adenocarcinoma | Male | >=65 | I/II | Unknown | Unknown | SD | |
| SUB1 | SNV | Missense_Mutation | novel | c.257N>A | p.Arg86Lys | p.R86K | P53999 | protein_coding | deleterious(0.02) | probably_damaging(0.988) | TCGA-CA-6717-01 | Colorectum | colon adenocarcinoma | Male | <65 | I/II | Chemotherapy | oxaliplatin | CR |
| SUB1 | SNV | Missense_Mutation | c.8A>C | p.Lys3Thr | p.K3T | P53999 | protein_coding | deleterious(0.01) | probably_damaging(0.932) | TCGA-AP-A0LM-01 | Endometrium | uterine corpus endometrioid carcinoma | Female | <65 | III/IV | Chemotherapy | cisplatin | SD | |
| SUB1 | SNV | Missense_Mutation | c.226G>A | p.Asp76Asn | p.D76N | P53999 | protein_coding | tolerated(0.27) | possibly_damaging(0.515) | TCGA-AP-A0LM-01 | Endometrium | uterine corpus endometrioid carcinoma | Female | <65 | III/IV | Chemotherapy | cisplatin | SD | |
| SUB1 | SNV | Missense_Mutation | rs772309920 | c.224G>A | p.Arg75His | p.R75H | P53999 | protein_coding | tolerated(0.07) | probably_damaging(0.997) | TCGA-AP-A1DP-01 | Endometrium | uterine corpus endometrioid carcinoma | Female | >=65 | I/II | Chemotherapy | paclitaxel | PD |
| SUB1 | SNV | Missense_Mutation | c.226N>A | p.Asp76Asn | p.D76N | P53999 | protein_coding | tolerated(0.27) | possibly_damaging(0.515) | TCGA-E6-A1LX-01 | Endometrium | uterine corpus endometrioid carcinoma | Female | <65 | I/II | Unknown | Unknown | SD | |
| SUB1 | SNV | Missense_Mutation | rs772309920 | c.224N>A | p.Arg75His | p.R75H | P53999 | protein_coding | tolerated(0.07) | probably_damaging(0.997) | TCGA-FI-A2D0-01 | Endometrium | uterine corpus endometrioid carcinoma | Female | <65 | I/II | Unknown | Unknown | SD |
| SUB1 | SNV | Missense_Mutation | rs772309920 | c.224G>A | p.Arg75His | p.R75H | P53999 | protein_coding | tolerated(0.07) | probably_damaging(0.997) | TCGA-39-5022-01 | Lung | lung squamous cell carcinoma | Male | >=65 | I/II | Unknown | Unknown | PD |
| SUB1 | SNV | Missense_Mutation | c.211N>C | p.Tyr71His | p.Y71H | P53999 | protein_coding | deleterious(0.02) | possibly_damaging(0.497) | TCGA-BR-4257-01 | Stomach | stomach adenocarcinoma | Female | >=65 | I/II | Unknown | Unknown | SD |
| Page: 1 2 |
Top |
Related drugs of malignant transformation related genes |
| Identification of chemicals and drugs interact with genes involved in malignant transfromation |
| (DGIdb 4.0) |
| Entrez ID | Symbol | Category | Interaction Types | Drug Claim Name | Drug Name | PMIDs |
| Page: 1 |

Copyright 2023-Present -The University of Texas Health Science Center at Houston |