Schematic overview of the cellular and molecular mechanisms involved in the cancer progression, including the proposed cellular and molecular mechanisms in cancer cells trajectory. AT1: alveolar type 1 cells; AT2: alveolar type 2 cells; AAH: atypical adenomatous hyperplasia; AIS: adenocarcinoma in situ; MIA: minimally invasive adenocarcinoma; IA: invasive adenocarcinoma; EMT: epithelial-mesenchymal transition

Home

Download

Statistics

Help

Contact

Center for Computational Systems Medicine
leaf

Gene summary

leaf

Malignant transformation analysis

leaf

Malignant transformation related pathway analysis

leaf

Cell-cell communication analysis

leaf

Single-cell gene regulatory network inference analysis

leaf

Somatic mutation of malignant transformation related genes

leaf

Related drugs of malignant transformation related genes

Gene: STYXL1

Gene summary for STYXL1

check button Gene summary.

Gene informationSpeciesHuman
Gene symbol

STYXL1

Gene ID

51657

Gene nameserine/threonine/tyrosine interacting like 1
Gene AliasDUSP24
Cytomap7q11.23
Gene Typeprotein-coding
GO ID

GO:0006464

UniProtAcc

A0A024R4L1


Top

Malignant transformation analysis

check button Identification of the aberrant gene expression in precancerous and cancerous lesions by comparing the gene expression of stem-like cells in diseased tissues with normal stem cells
check button Malignant transformation involving gene list.
Entrez IDSymbolReplicatesSpeciesOrganTissueAdj P-valueLog2FCMalignancy
51657STYXL1LZE4THumanEsophagusESCC1.55e-038.73e-020.0811
51657STYXL1LZE7THumanEsophagusESCC4.56e-052.47e-010.0667
51657STYXL1LZE20THumanEsophagusESCC2.65e-113.82e-010.0662
51657STYXL1LZE22D1HumanEsophagusHGIN7.88e-032.01e-010.0595
51657STYXL1LZE22THumanEsophagusESCC2.27e-043.35e-010.068
51657STYXL1LZE24THumanEsophagusESCC4.46e-124.07e-010.0596
51657STYXL1LZE21THumanEsophagusESCC1.75e-062.90e-010.0655
51657STYXL1LZE6THumanEsophagusESCC5.71e-113.42e-010.0845
51657STYXL1P1T-EHumanEsophagusESCC1.75e-073.11e-010.0875
51657STYXL1P2T-EHumanEsophagusESCC4.71e-153.15e-010.1177
51657STYXL1P4T-EHumanEsophagusESCC1.53e-367.27e-010.1323
51657STYXL1P5T-EHumanEsophagusESCC1.73e-103.05e-010.1327
51657STYXL1P8T-EHumanEsophagusESCC5.99e-123.22e-010.0889
51657STYXL1P9T-EHumanEsophagusESCC1.07e-103.02e-010.1131
51657STYXL1P10T-EHumanEsophagusESCC1.31e-163.53e-010.116
51657STYXL1P11T-EHumanEsophagusESCC6.45e-092.12e-010.1426
51657STYXL1P12T-EHumanEsophagusESCC1.77e-255.32e-010.1122
51657STYXL1P15T-EHumanEsophagusESCC3.49e-285.79e-010.1149
51657STYXL1P16T-EHumanEsophagusESCC6.58e-841.48e+000.1153
51657STYXL1P17T-EHumanEsophagusESCC1.11e-123.88e-010.1278
Page: 1 2 3 4 5 

check button Transcriptomic changes along malignancy continuum.
TissueExpression DynamicsAbbreviation
EsophagusThe image shows the transcriptomic changes along malignancy continuum.log2FC in expression of this searched gene in stem-like cells from each diseased tissue sample relative to stem-like cells in normal samples in each tissue plotted against the malignancy continuum. Samples are colored based on if they are from different disease stage.
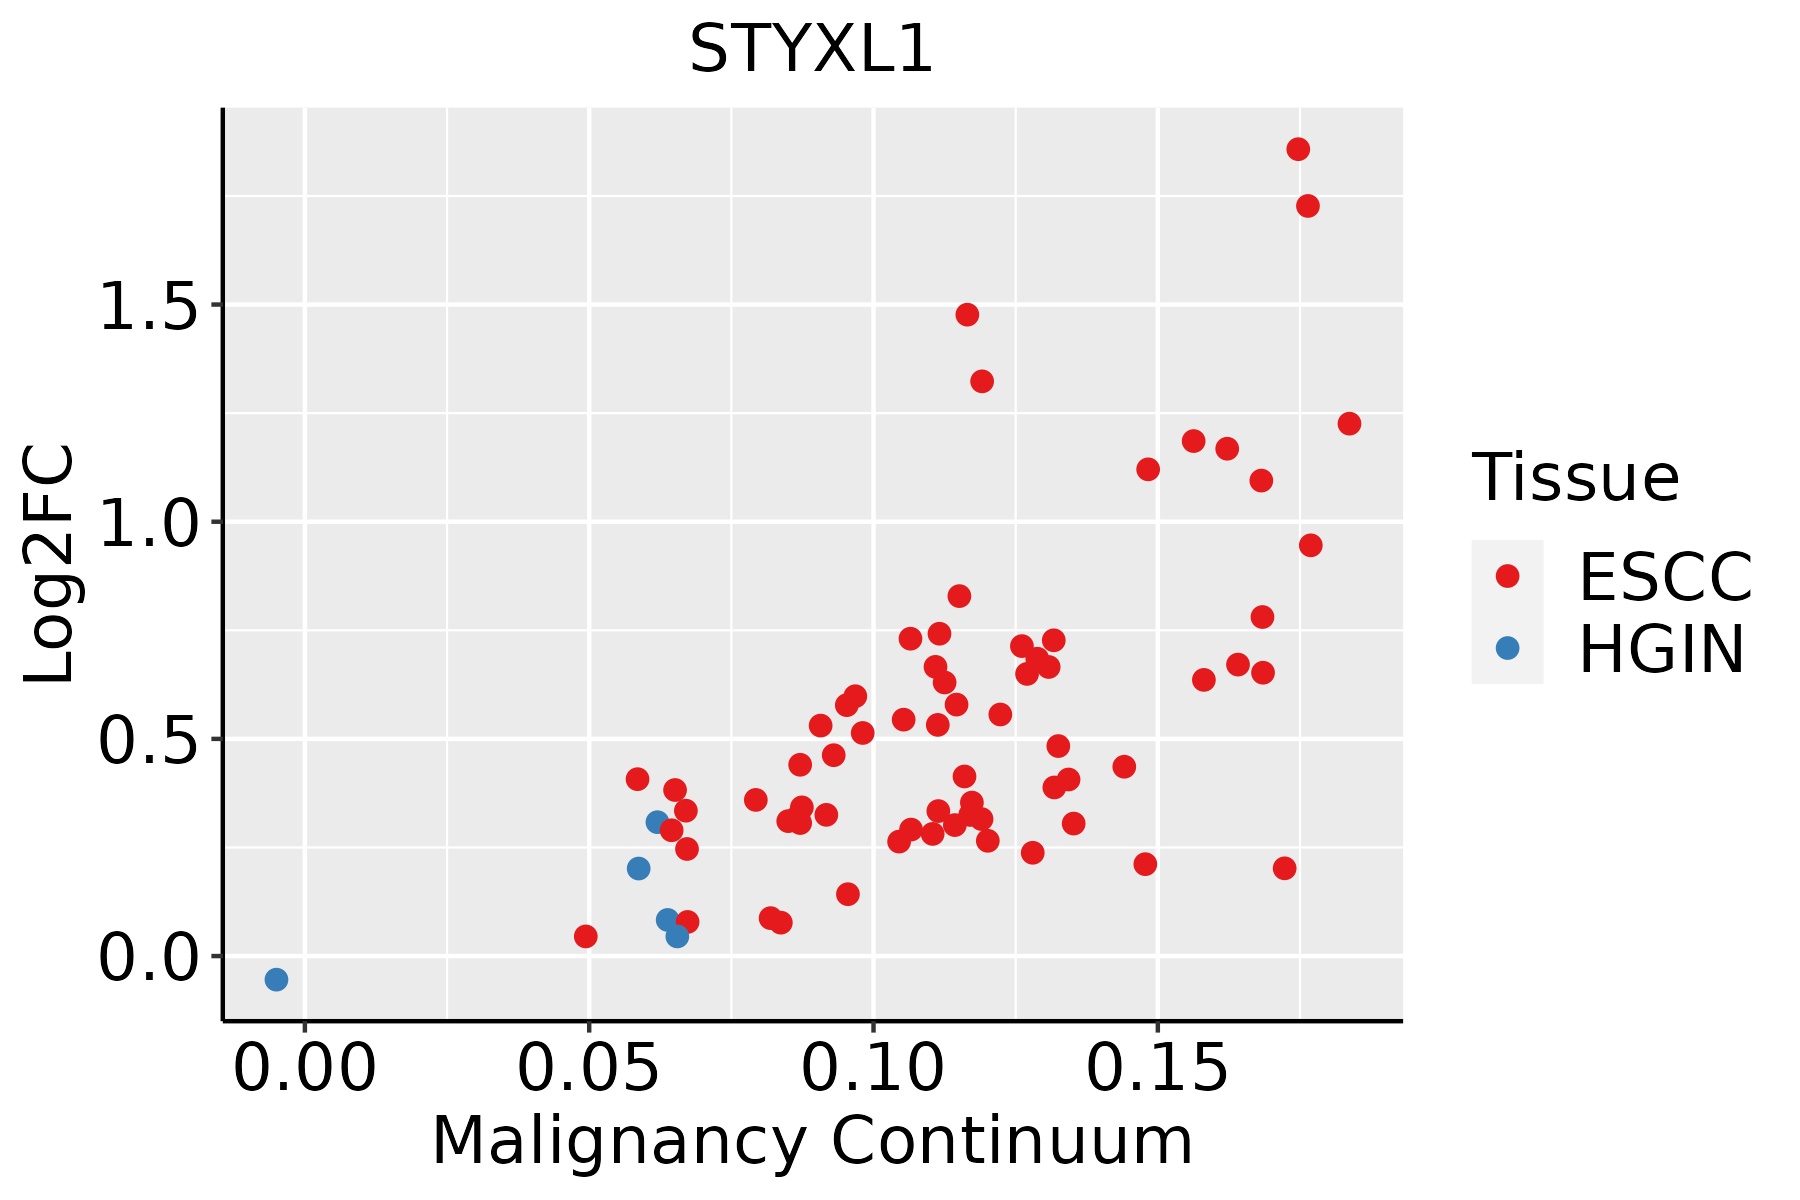
ESCC: Esophageal squamous cell carcinoma
HGIN: High-grade intraepithelial neoplasias
LGIN: Low-grade intraepithelial neoplasias
LiverThe image shows the transcriptomic changes along malignancy continuum.log2FC in expression of this searched gene in stem-like cells from each diseased tissue sample relative to stem-like cells in normal samples in each tissue plotted against the malignancy continuum. Samples are colored based on if they are from different disease stage.HCC: Hepatocellular carcinoma
NAFLD: Non-alcoholic fatty liver disease
Oral CavityThe image shows the transcriptomic changes along malignancy continuum.log2FC in expression of this searched gene in stem-like cells from each diseased tissue sample relative to stem-like cells in normal samples in each tissue plotted against the malignancy continuum. Samples are colored based on if they are from different disease stage.
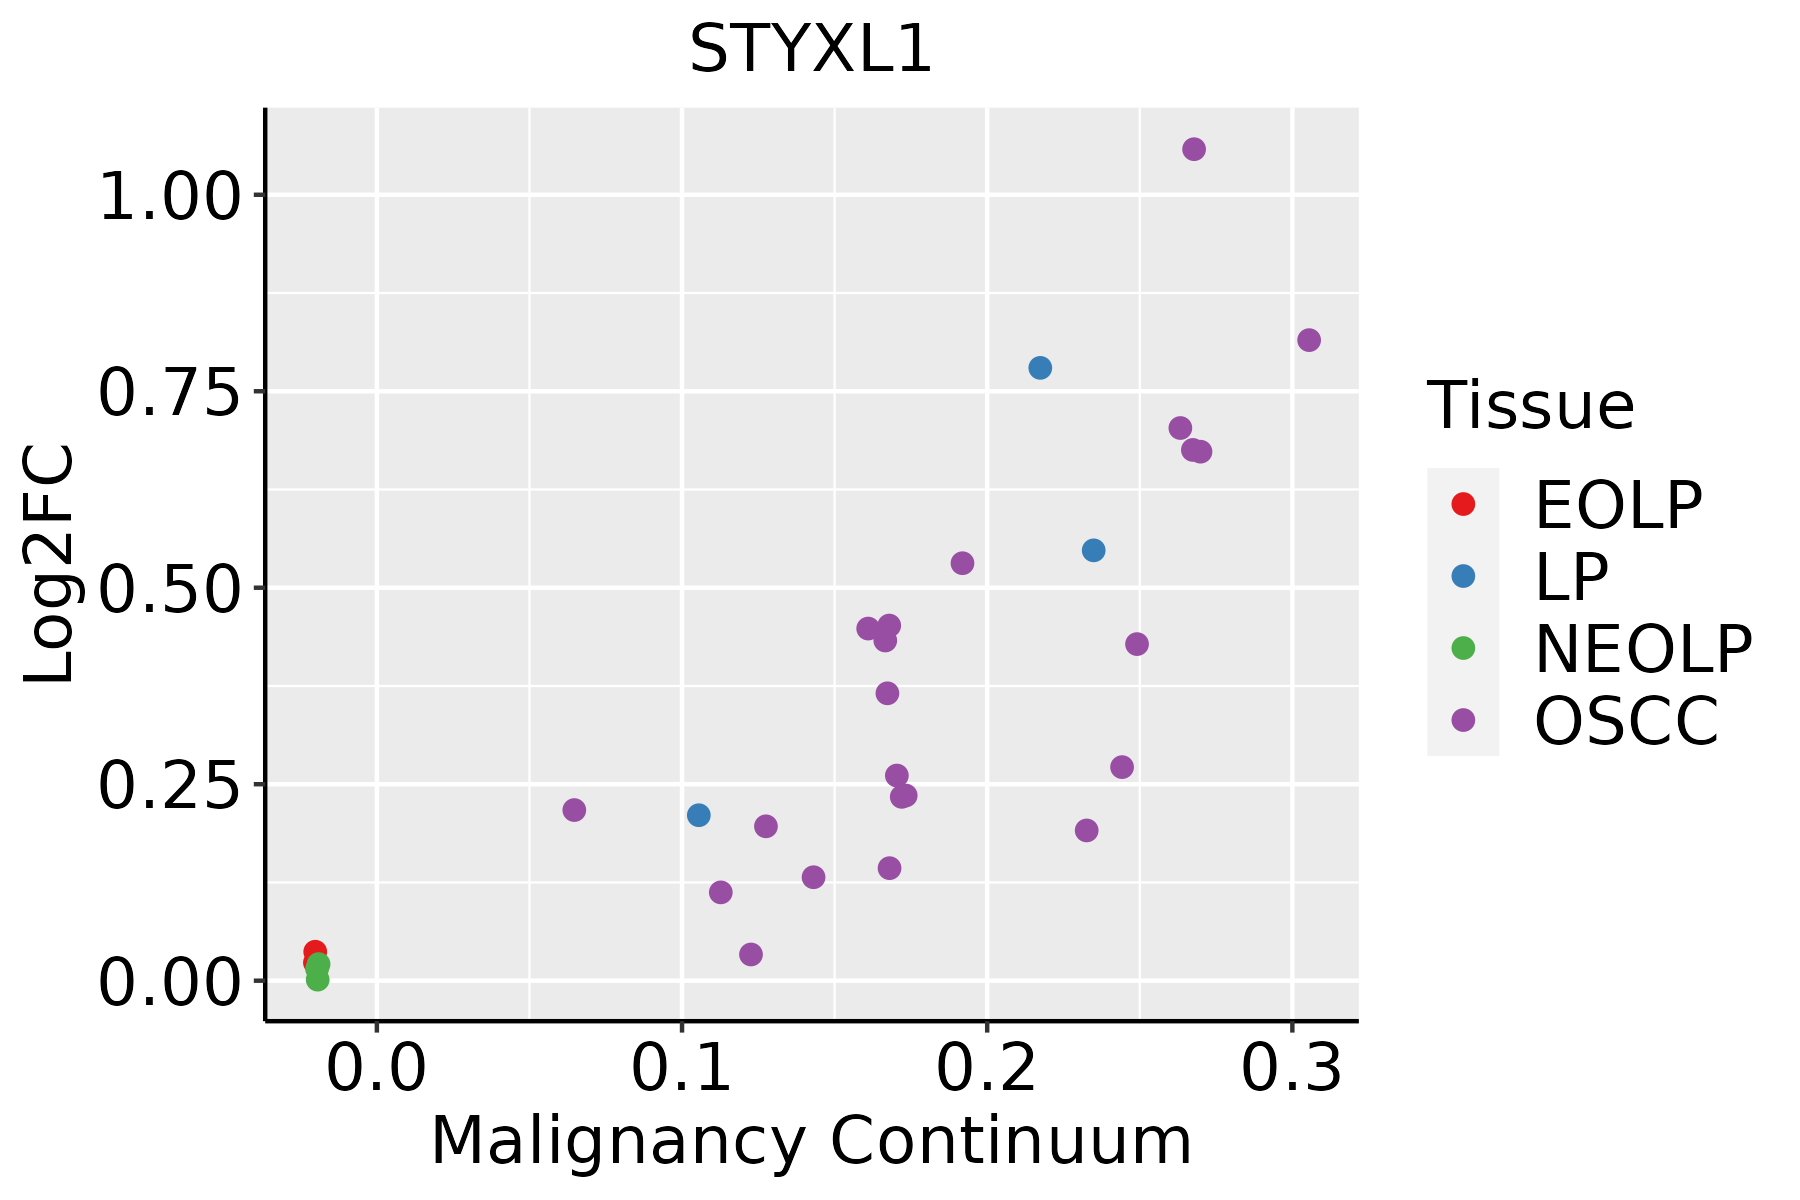
EOLP: Erosive Oral lichen planus
LP: leukoplakia
NEOLP: Non-erosive oral lichen planus
OSCC: Oral squamous cell carcinoma
SkinThe image shows the transcriptomic changes along malignancy continuum.log2FC in expression of this searched gene in stem-like cells from each diseased tissue sample relative to stem-like cells in normal samples in each tissue plotted against the malignancy continuum. Samples are colored based on if they are from different disease stage.AK: Actinic keratosis
cSCC: Cutaneous squamous cell carcinoma
SCCIS:squamous cell carcinoma in situ
∗log2FC in expression of this searched gene in stem-like cells from each diseased tissue sample relative to stem-like cells in normal samples in each tissue plotted against the malignancy continuum. Samples are colored based on if they are from different disease stage.

Top

Malignant transformation related pathway analysis

check buttonFind out the enriched GO biological processes and KEGG pathways involved in transition from healthy to precancer to cancer
check button Figure of enriched GO biological processes.
TissueDisease StageEnriched GO biological Processes
ColorectumADGO analysis - Figure of enriched GO biological processes: Top 15 enriched GO BP terms are showed in the bar plot of each disease state in each tissue. Each row represents a significant GO biological process which is colored according to the -log10(p.adjust).
ColorectumSERGO analysis - Figure of enriched GO biological processes: Top 15 enriched GO BP terms are showed in the bar plot of each disease state in each tissue. Each row represents a significant GO biological process which is colored according to the -log10(p.adjust).
ColorectumMSSGO analysis - Figure of enriched GO biological processes: Top 15 enriched GO BP terms are showed in the bar plot of each disease state in each tissue. Each row represents a significant GO biological process which is colored according to the -log10(p.adjust).
ColorectumMSI-HGO analysis - Figure of enriched GO biological processes: Top 15 enriched GO BP terms are showed in the bar plot of each disease state in each tissue. Each row represents a significant GO biological process which is colored according to the -log10(p.adjust).
ColorectumFAPGO analysis - Figure of enriched GO biological processes: Top 15 enriched GO BP terms are showed in the bar plot of each disease state in each tissue. Each row represents a significant GO biological process which is colored according to the -log10(p.adjust).
∗Top 15 enriched GO BP terms are showed in the bar plot of each disease state in each tissue. Each row represents a significant GO biological process which is colored according to the -log10(p.adjust).
Page: 1 2 3 4 5 6 7 8 9 

check button Enriched GO biological processes.
GO IDTissueDisease StageDescriptionGene RatioBg Ratiopvaluep.adjustCount
GO:009719327EsophagusHGINintrinsic apoptotic signaling pathway90/2587288/187231.50e-142.80e-1290
GO:200124227EsophagusHGINregulation of intrinsic apoptotic signaling pathway58/2587164/187232.57e-123.58e-1058
GO:200123327EsophagusHGINregulation of apoptotic signaling pathway97/2587356/187231.36e-111.57e-0997
GO:200124410EsophagusHGINpositive regulation of intrinsic apoptotic signaling pathway25/258758/187234.91e-082.75e-0625
GO:200123519EsophagusHGINpositive regulation of apoptotic signaling pathway41/2587126/187236.06e-083.22e-0641
GO:001063920EsophagusHGINnegative regulation of organelle organization79/2587348/187234.12e-061.37e-0479
GO:19021156EsophagusHGINregulation of organelle assembly46/2587186/187234.63e-051.12e-0346
GO:004593626EsophagusHGINnegative regulation of phosphate metabolic process89/2587441/187231.24e-042.54e-0389
GO:001056326EsophagusHGINnegative regulation of phosphorus metabolic process89/2587442/187231.34e-042.71e-0389
GO:000647017EsophagusHGINprotein dephosphorylation61/2587281/187231.86e-043.51e-0361
GO:003530425EsophagusHGINregulation of protein dephosphorylation24/258790/187239.27e-041.17e-0224
GO:00340638EsophagusHGINstress granule assembly10/258726/187231.60e-031.79e-0210
GO:19021162EsophagusHGINnegative regulation of organelle assembly13/258741/187232.62e-032.58e-0213
GO:005134620EsophagusHGINnegative regulation of hydrolase activity72/2587379/187232.81e-032.75e-0272
GO:004366619EsophagusHGINregulation of phosphoprotein phosphatase activity16/258758/187234.35e-033.84e-0216
GO:003530320EsophagusHGINregulation of dephosphorylation29/2587128/187234.41e-033.87e-0229
GO:0097193111EsophagusESCCintrinsic apoptotic signaling pathway222/8552288/187235.87e-282.02e-25222
GO:2001233111EsophagusESCCregulation of apoptotic signaling pathway256/8552356/187234.11e-241.04e-21256
GO:2001242111EsophagusESCCregulation of intrinsic apoptotic signaling pathway128/8552164/187231.75e-171.50e-15128
GO:0010563111EsophagusESCCnegative regulation of phosphorus metabolic process274/8552442/187232.32e-129.41e-11274
Page: 1 2 3 4 5 6 7 

check button Enriched KEGG pathways.
Pathway IDTissueDisease StageDescriptionGene RatioBg Ratiopvaluep.adjustqvalueCount
Page: 1 

Top

Cell-cell communication analysis

check buttonIdentification of potential cell-cell interactions between two cell types and their ligand-receptor pairs for different disease states
LigandReceptorLRpairPathwayTissueDisease Stage
Page: 1 

Top

Single-cell gene regulatory network inference analysis

check buttonFind out the significant the regulons (TFs) and the target genes of each regulon across cell types for different disease states
TFCell TypeTissueDisease StageTarget GeneRSSRegulon Activity
∗The dot plots of a searched regulon are shown for all cell subpopulations in each disease state of each tissue based on the regulon specific score inferred using pySCENIC and by calculating the average expression.
Page: 1 

Top

Somatic mutation of malignant transformation related genes

check buttonAnnotation of somatic variants for genes involved in malignant transformation
Hugo SymbolVariant ClassVariant ClassificationdbSNP RSHGVScHGVSpHGVSp ShortSWISSPROTBIOTYPESIFTPolyPhenTumor Sample BarcodeTissueHistologySexAgeStageTherapy TypesDrugsOutcome
STYXL1SNVMissense_Mutationc.555N>Cp.Leu185Phep.L185FQ9Y6J8protein_codingdeleterious(0)probably_damaging(0.993)TCGA-A8-A09G-01Breastbreast invasive carcinomaFemale>=65III/IVUnknownUnknownSD
STYXL1insertionIn_Frame_Insnovelc.607_608insTGGp.Ala202_Gly203insValp.A202_G203insVQ9Y6J8protein_codingTCGA-A8-A0A7-01Breastbreast invasive carcinomaFemale<65I/IIUnknownUnknownSD
STYXL1insertionIn_Frame_Insnovelc.605_606insCCACCAGTTACTTAACTCATCAAGp.Ala202_Gly203insHisGlnLeuLeuAsnSerSerArgp.A202_G203insHQLLNSSRQ9Y6J8protein_codingTCGA-A8-A0A7-01Breastbreast invasive carcinomaFemale<65I/IIUnknownUnknownSD
STYXL1SNVMissense_Mutationc.932C>Tp.Pro311Leup.P311LQ9Y6J8protein_codingtolerated(0.13)benign(0.204)TCGA-EA-A3HS-01Cervixcervical & endocervical cancerFemale<65I/IIUnknownUnknownSD
STYXL1SNVMissense_Mutationc.679N>Ap.His227Asnp.H227NQ9Y6J8protein_codingtolerated(0.35)benign(0.158)TCGA-EA-A43B-01Cervixcervical & endocervical cancerFemale<65I/IIChemotherapycisplatinCR
STYXL1SNVMissense_Mutationrs372639771c.469C>Gp.Gln157Glup.Q157EQ9Y6J8protein_codingtolerated(0.15)benign(0.003)TCGA-IR-A3LA-01Cervixcervical & endocervical cancerFemale<65I/IIChemotherapycisplatinCR
STYXL1SNVMissense_Mutationc.555N>Cp.Leu185Phep.L185FQ9Y6J8protein_codingdeleterious(0)probably_damaging(0.993)TCGA-IR-A3LH-01Cervixcervical & endocervical cancerFemale<65I/IIChemotherapycisplatinCR
STYXL1SNVMissense_Mutationc.191N>Tp.Glu64Valp.E64VQ9Y6J8protein_codingtolerated(0.09)benign(0.245)TCGA-AA-3818-01Colorectumcolon adenocarcinomaFemale>=65I/IIUnknownUnknownPD
STYXL1SNVMissense_Mutationnovelc.739N>Gp.Thr247Alap.T247AQ9Y6J8protein_codingtolerated(0.08)possibly_damaging(0.542)TCGA-AY-6197-01Colorectumcolon adenocarcinomaMale<65I/IIUnknownUnknownSD
STYXL1SNVMissense_Mutationc.514N>Gp.Asn172Aspp.N172DQ9Y6J8protein_codingtolerated(0.35)benign(0.02)TCGA-AZ-6598-01Colorectumcolon adenocarcinomaFemale>=65I/IIUnknownUnknownSD
Page: 1 2 3 4 5 

Top

Related drugs of malignant transformation related genes

check buttonIdentification of chemicals and drugs interact with genes involved in malignant transfromation
(DGIdb 4.0)
Entrez IDSymbolCategoryInteraction TypesDrug Claim NameDrug NamePMIDs
Page: 1