
|
|||||
|
 | |
| |
| |
| |
| |
| |
|
Gene: STXBP6 |
Gene summary for STXBP6 |
| Gene information | Species | Human | Gene symbol | STXBP6 | Gene ID | 29091 |
| Gene name | syntaxin binding protein 6 | |
| Gene Alias | HSPC156 | |
| Cytomap | 14q12 | |
| Gene Type | protein-coding | GO ID | GO:0006810 | UniProtAcc | Q8NFX7 |
Top |
Malignant transformation analysis |
| Identification of the aberrant gene expression in precancerous and cancerous lesions by comparing the gene expression of stem-like cells in diseased tissues with normal stem cells |
| Entrez ID | Symbol | Replicates | Species | Organ | Tissue | Adj P-value | Log2FC | Malignancy |
| 29091 | STXBP6 | HTA11_3410_2000001011 | Human | Colorectum | AD | 1.01e-03 | -3.40e-01 | 0.0155 |
| 29091 | STXBP6 | HTA11_3361_2000001011 | Human | Colorectum | AD | 2.82e-04 | -5.75e-01 | -0.1207 |
| 29091 | STXBP6 | HTA11_5212_2000001011 | Human | Colorectum | AD | 9.81e-04 | -7.40e-01 | -0.2061 |
| 29091 | STXBP6 | HTA11_99999971662_82457 | Human | Colorectum | MSS | 1.57e-08 | -4.26e-01 | 0.3859 |
| 29091 | STXBP6 | HTA11_99999974143_84620 | Human | Colorectum | MSS | 2.07e-14 | -5.20e-01 | 0.3005 |
| 29091 | STXBP6 | A002-C-010 | Human | Colorectum | FAP | 1.74e-03 | 2.69e-01 | 0.242 |
| 29091 | STXBP6 | A001-C-207 | Human | Colorectum | FAP | 2.52e-02 | 2.74e-01 | 0.1278 |
| 29091 | STXBP6 | A015-C-203 | Human | Colorectum | FAP | 1.25e-28 | -5.72e-01 | -0.1294 |
| 29091 | STXBP6 | A015-C-204 | Human | Colorectum | FAP | 2.45e-03 | -2.55e-01 | -0.0228 |
| 29091 | STXBP6 | A014-C-040 | Human | Colorectum | FAP | 3.24e-03 | -3.21e-01 | -0.1184 |
| 29091 | STXBP6 | A002-C-201 | Human | Colorectum | FAP | 2.88e-09 | -3.61e-01 | 0.0324 |
| 29091 | STXBP6 | A002-C-203 | Human | Colorectum | FAP | 1.59e-05 | 3.47e-01 | 0.2786 |
| 29091 | STXBP6 | A001-C-119 | Human | Colorectum | FAP | 1.29e-11 | -5.91e-01 | -0.1557 |
| 29091 | STXBP6 | A001-C-108 | Human | Colorectum | FAP | 5.37e-11 | -3.13e-01 | -0.0272 |
| 29091 | STXBP6 | A002-C-205 | Human | Colorectum | FAP | 2.88e-22 | -5.73e-01 | -0.1236 |
| 29091 | STXBP6 | A015-C-006 | Human | Colorectum | FAP | 1.07e-15 | -5.87e-01 | -0.0994 |
| 29091 | STXBP6 | A015-C-106 | Human | Colorectum | FAP | 2.71e-09 | -1.20e-01 | -0.0511 |
| 29091 | STXBP6 | A002-C-114 | Human | Colorectum | FAP | 1.07e-16 | -4.95e-01 | -0.1561 |
| 29091 | STXBP6 | A015-C-104 | Human | Colorectum | FAP | 3.83e-27 | -5.40e-01 | -0.1899 |
| 29091 | STXBP6 | A001-C-014 | Human | Colorectum | FAP | 1.99e-09 | -2.22e-01 | 0.0135 |
| Page: 1 2 3 4 5 |
| Tissue | Expression Dynamics | Abbreviation |
| Colorectum (GSE201348) |  | FAP: Familial adenomatous polyposis |
| CRC: Colorectal cancer | ||
| Colorectum (HTA11) |  | AD: Adenomas |
| SER: Sessile serrated lesions | ||
| MSI-H: Microsatellite-high colorectal cancer | ||
| MSS: Microsatellite stable colorectal cancer | ||
| Endometrium | 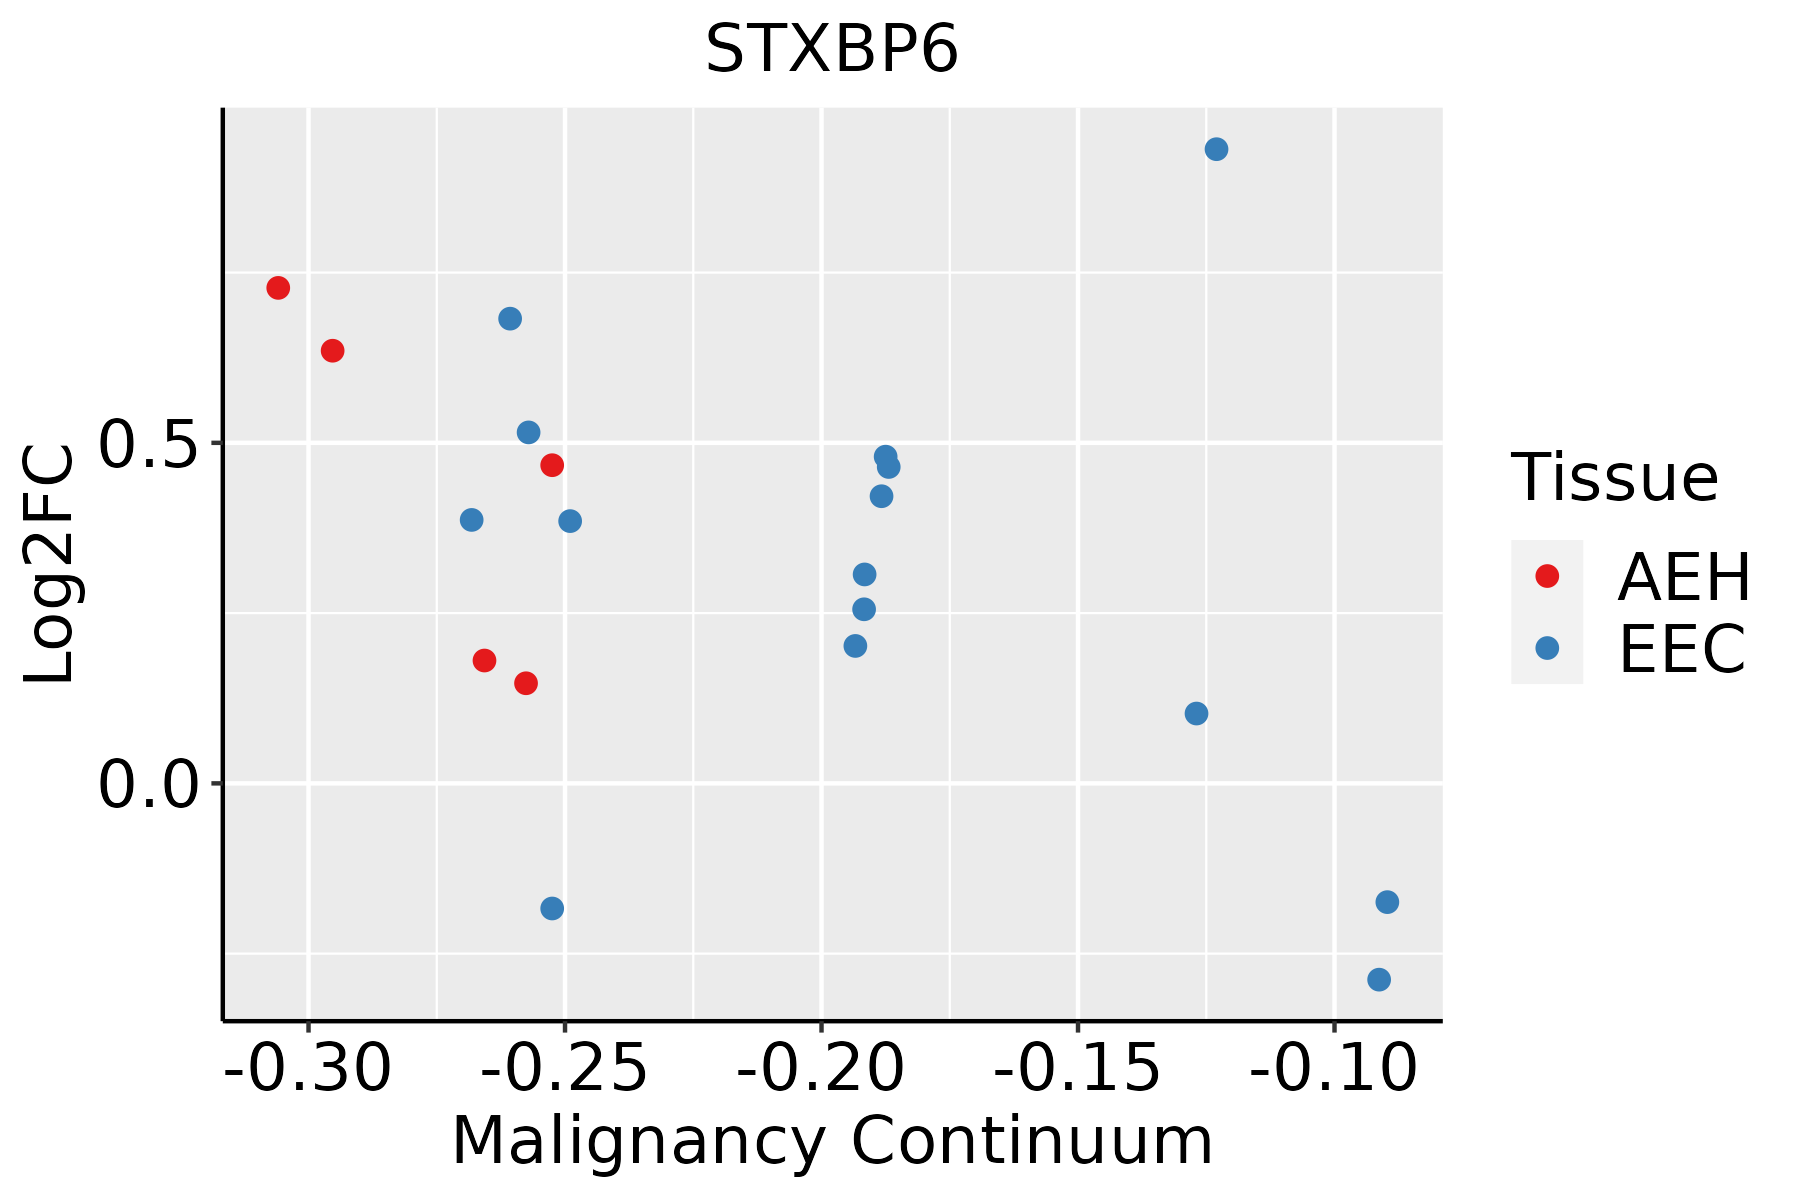 | AEH: Atypical endometrial hyperplasia |
| EEC: Endometrioid Cancer | ||
| Esophagus | 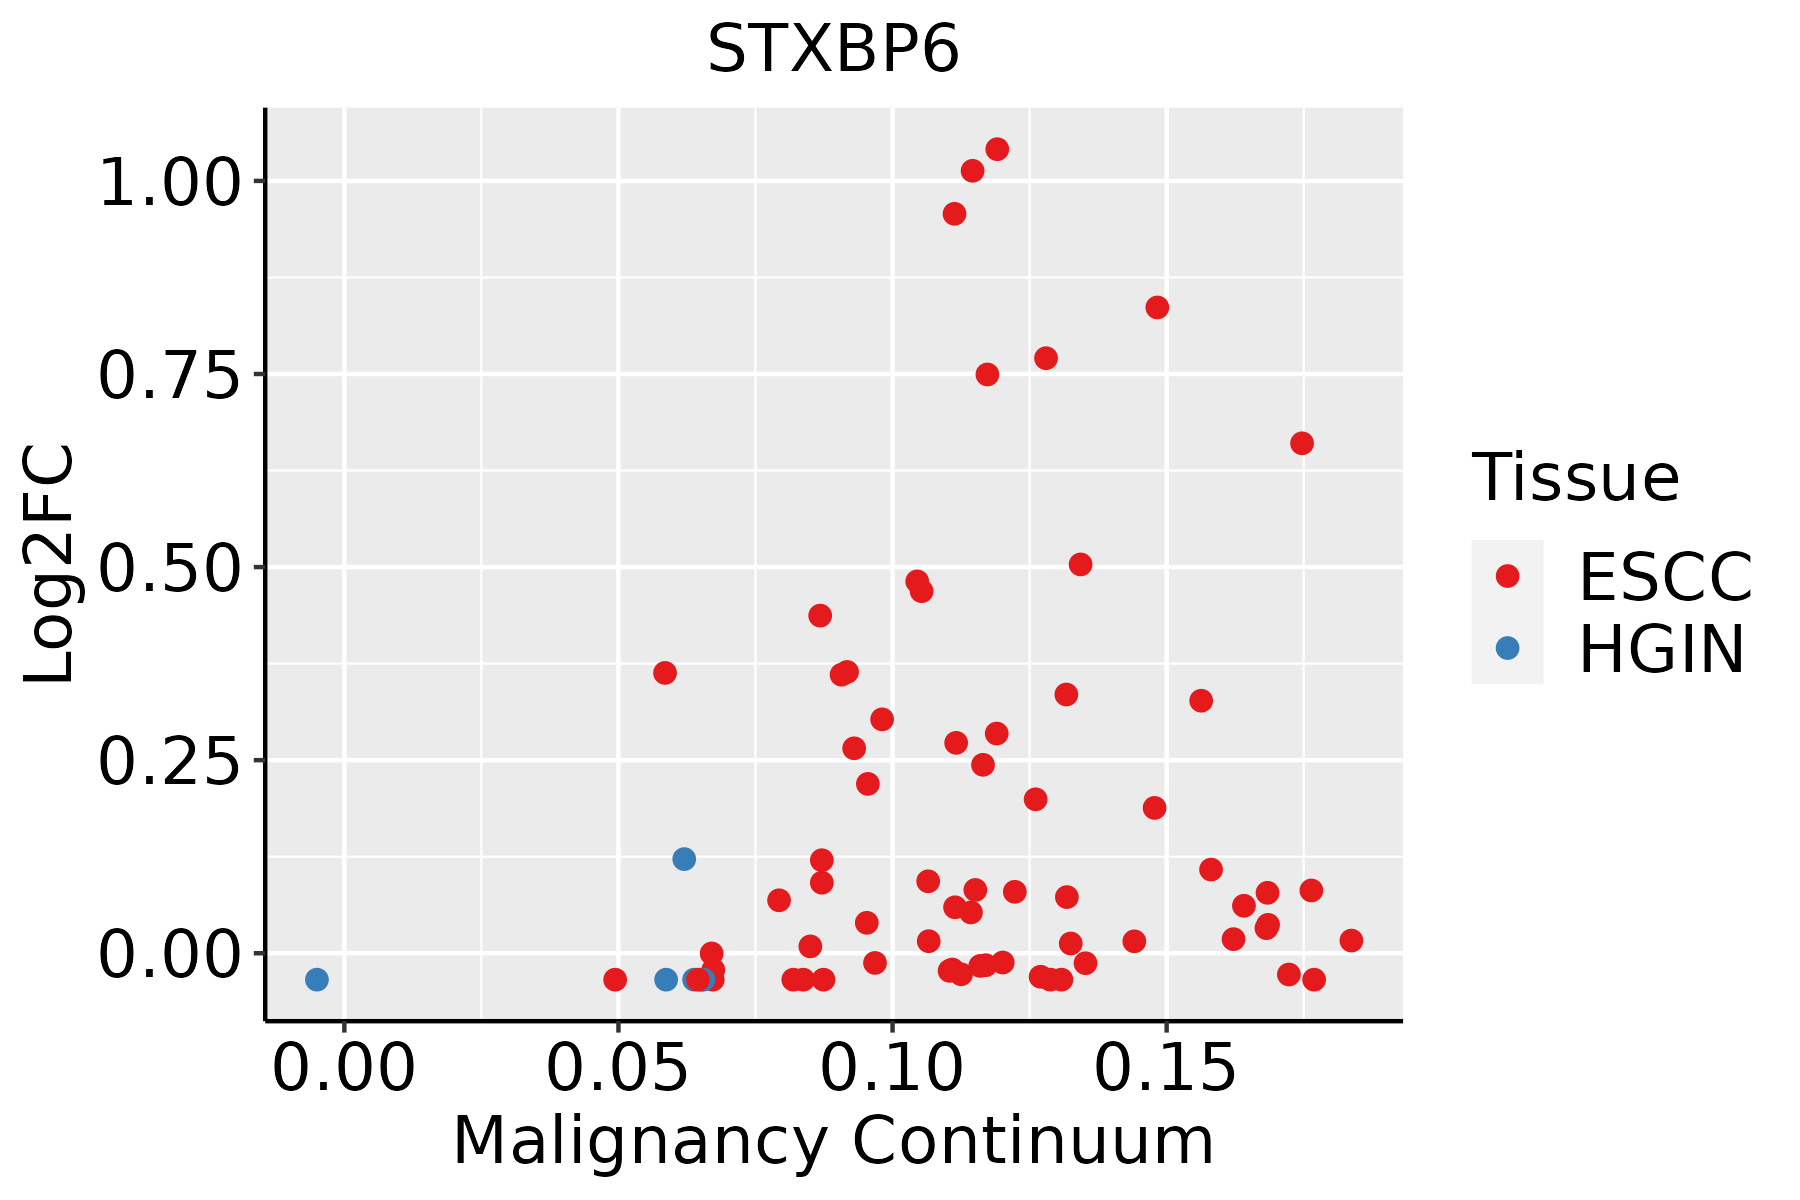 | ESCC: Esophageal squamous cell carcinoma |
| HGIN: High-grade intraepithelial neoplasias | ||
| LGIN: Low-grade intraepithelial neoplasias | ||
| Liver | 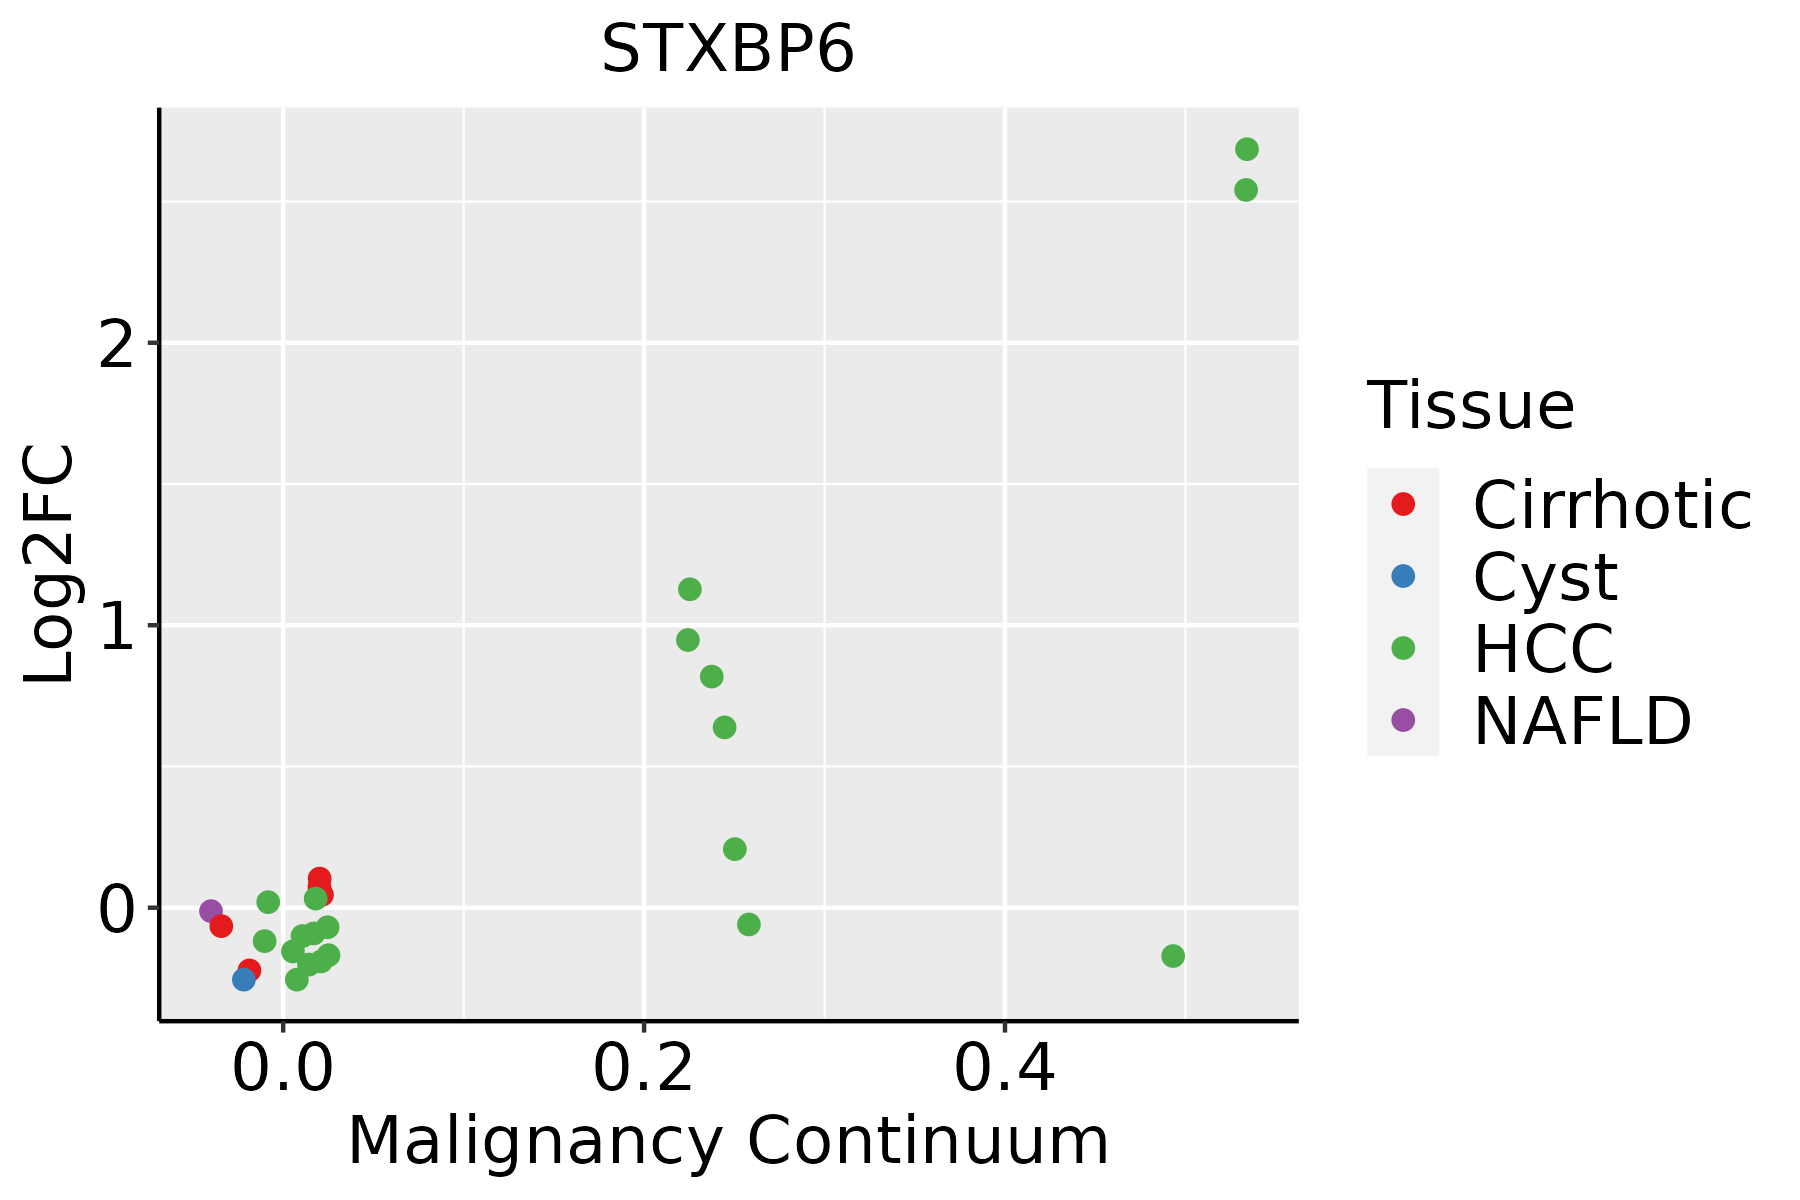 | HCC: Hepatocellular carcinoma |
| NAFLD: Non-alcoholic fatty liver disease | ||
| Oral Cavity |  | EOLP: Erosive Oral lichen planus |
| LP: leukoplakia | ||
| NEOLP: Non-erosive oral lichen planus | ||
| OSCC: Oral squamous cell carcinoma | ||
| Thyroid |  | ATC: Anaplastic thyroid cancer |
| HT: Hashimoto's thyroiditis | ||
| PTC: Papillary thyroid cancer |
| ∗log2FC in expression of this searched gene in stem-like cells from each diseased tissue sample relative to stem-like cells in normal samples in each tissue plotted against the malignancy continuum. Samples are colored based on if they are from different disease stage. |
Top |
Malignant transformation related pathway analysis |
| Find out the enriched GO biological processes and KEGG pathways involved in transition from healthy to precancer to cancer |
| Tissue | Disease Stage | Enriched GO biological Processes |
| Colorectum | AD |  |
| Colorectum | SER |  |
| Colorectum | MSS |  |
| Colorectum | MSI-H |  |
| Colorectum | FAP |  |
| ∗Top 15 enriched GO BP terms are showed in the bar plot of each disease state in each tissue. Each row represents a significant GO biological process which is colored according to the -log10(p.adjust). |
| Page: 1 2 3 4 5 6 7 8 9 |
| GO ID | Tissue | Disease Stage | Description | Gene Ratio | Bg Ratio | pvalue | p.adjust | Count |
| GO:0043254 | Colorectum | AD | regulation of protein-containing complex assembly | 148/3918 | 428/18723 | 2.64e-11 | 3.18e-09 | 148 |
| GO:0048193 | Colorectum | AD | Golgi vesicle transport | 109/3918 | 296/18723 | 1.80e-10 | 1.68e-08 | 109 |
| GO:0098876 | Colorectum | AD | vesicle-mediated transport to the plasma membrane | 57/3918 | 136/18723 | 2.30e-08 | 1.27e-06 | 57 |
| GO:0016050 | Colorectum | AD | vesicle organization | 101/3918 | 300/18723 | 1.65e-07 | 7.17e-06 | 101 |
| GO:0006892 | Colorectum | AD | post-Golgi vesicle-mediated transport | 45/3918 | 104/18723 | 2.22e-07 | 9.26e-06 | 45 |
| GO:0006893 | Colorectum | AD | Golgi to plasma membrane transport | 27/3918 | 60/18723 | 2.41e-05 | 4.66e-04 | 27 |
| GO:0006887 | Colorectum | AD | exocytosis | 96/3918 | 352/18723 | 2.48e-03 | 1.90e-02 | 96 |
| GO:0017157 | Colorectum | AD | regulation of exocytosis | 59/3918 | 202/18723 | 3.20e-03 | 2.36e-02 | 59 |
| GO:0048284 | Colorectum | AD | organelle fusion | 42/3918 | 141/18723 | 8.04e-03 | 4.73e-02 | 42 |
| GO:00481932 | Colorectum | MSS | Golgi vesicle transport | 101/3467 | 296/18723 | 9.09e-11 | 9.77e-09 | 101 |
| GO:00432542 | Colorectum | MSS | regulation of protein-containing complex assembly | 130/3467 | 428/18723 | 1.38e-09 | 1.03e-07 | 130 |
| GO:00988762 | Colorectum | MSS | vesicle-mediated transport to the plasma membrane | 54/3467 | 136/18723 | 6.20e-09 | 3.95e-07 | 54 |
| GO:00160502 | Colorectum | MSS | vesicle organization | 93/3467 | 300/18723 | 1.04e-07 | 4.97e-06 | 93 |
| GO:00068922 | Colorectum | MSS | post-Golgi vesicle-mediated transport | 40/3467 | 104/18723 | 1.45e-06 | 4.82e-05 | 40 |
| GO:00068931 | Colorectum | MSS | Golgi to plasma membrane transport | 26/3467 | 60/18723 | 8.01e-06 | 2.03e-04 | 26 |
| GO:00510511 | Colorectum | MSS | negative regulation of transport | 110/3467 | 470/18723 | 4.20e-03 | 3.04e-02 | 110 |
| GO:00482841 | Colorectum | MSS | organelle fusion | 39/3467 | 141/18723 | 4.91e-03 | 3.42e-02 | 39 |
| GO:00481934 | Colorectum | FAP | Golgi vesicle transport | 77/2622 | 296/18723 | 2.86e-08 | 2.62e-06 | 77 |
| GO:00432544 | Colorectum | FAP | regulation of protein-containing complex assembly | 101/2622 | 428/18723 | 5.18e-08 | 4.07e-06 | 101 |
| GO:00068923 | Colorectum | FAP | post-Golgi vesicle-mediated transport | 36/2622 | 104/18723 | 9.23e-08 | 6.22e-06 | 36 |
| Page: 1 2 3 4 5 6 |
| Pathway ID | Tissue | Disease Stage | Description | Gene Ratio | Bg Ratio | pvalue | p.adjust | qvalue | Count |
| Page: 1 |
Top |
Cell-cell communication analysis |
| Identification of potential cell-cell interactions between two cell types and their ligand-receptor pairs for different disease states |
| Ligand | Receptor | LRpair | Pathway | Tissue | Disease Stage |
| Page: 1 |
Top |
Single-cell gene regulatory network inference analysis |
| Find out the significant the regulons (TFs) and the target genes of each regulon across cell types for different disease states |
| TF | Cell Type | Tissue | Disease Stage | Target Gene | RSS | Regulon Activity |
| ∗The dot plots of a searched regulon are shown for all cell subpopulations in each disease state of each tissue based on the regulon specific score inferred using pySCENIC and by calculating the average expression. |
| Page: 1 |
Top |
Somatic mutation of malignant transformation related genes |
| Annotation of somatic variants for genes involved in malignant transformation |
| Hugo Symbol | Variant Class | Variant Classification | dbSNP RS | HGVSc | HGVSp | HGVSp Short | SWISSPROT | BIOTYPE | SIFT | PolyPhen | Tumor Sample Barcode | Tissue | Histology | Sex | Age | Stage | Therapy Types | Drugs | Outcome |
| STXBP6 | SNV | Missense_Mutation | c.501N>C | p.Gln167His | p.Q167H | Q8NFX7 | protein_coding | tolerated(0.05) | benign(0.044) | TCGA-A2-A0EQ-01 | Breast | breast invasive carcinoma | Female | <65 | I/II | Chemotherapy | adriamycin | SD | |
| STXBP6 | SNV | Missense_Mutation | novel | c.49N>A | p.Glu17Lys | p.E17K | Q8NFX7 | protein_coding | deleterious(0) | probably_damaging(0.968) | TCGA-A2-A0EY-01 | Breast | breast invasive carcinoma | Female | <65 | I/II | Chemotherapy | adriamycin | SD |
| STXBP6 | SNV | Missense_Mutation | rs767031935 | c.48N>A | p.Asp16Glu | p.D16E | Q8NFX7 | protein_coding | tolerated(0.13) | probably_damaging(0.981) | TCGA-A2-A0EY-01 | Breast | breast invasive carcinoma | Female | <65 | I/II | Chemotherapy | adriamycin | SD |
| STXBP6 | SNV | Missense_Mutation | novel | c.618N>A | p.Met206Ile | p.M206I | Q8NFX7 | protein_coding | tolerated(0.25) | benign(0) | TCGA-D8-A4Z1-01 | Breast | breast invasive carcinoma | Female | >=65 | I/II | Hormone Therapy | tamoxiphen | SD |
| STXBP6 | SNV | Missense_Mutation | c.233N>T | p.Ser78Leu | p.S78L | Q8NFX7 | protein_coding | deleterious(0.03) | benign(0.131) | TCGA-C5-A1MN-01 | Cervix | cervical & endocervical cancer | Female | <65 | III/IV | Chemotherapy | cisplatin | SD | |
| STXBP6 | SNV | Missense_Mutation | rs769103083 | c.526N>T | p.Arg176Cys | p.R176C | Q8NFX7 | protein_coding | deleterious(0) | probably_damaging(0.976) | TCGA-AA-A010-01 | Colorectum | colon adenocarcinoma | Female | <65 | I/II | Chemotherapy | folinic | CR |
| STXBP6 | SNV | Missense_Mutation | novel | c.226C>T | p.Arg76Trp | p.R76W | Q8NFX7 | protein_coding | deleterious(0) | possibly_damaging(0.646) | TCGA-AG-A002-01 | Colorectum | rectum adenocarcinoma | Male | <65 | I/II | Unknown | Unknown | SD |
| STXBP6 | SNV | Missense_Mutation | c.274G>A | p.Asp92Asn | p.D92N | Q8NFX7 | protein_coding | tolerated(0.26) | benign(0) | TCGA-AP-A056-01 | Endometrium | uterine corpus endometrioid carcinoma | Female | <65 | I/II | Unknown | Unknown | SD | |
| STXBP6 | SNV | Missense_Mutation | c.34N>A | p.Phe12Ile | p.F12I | Q8NFX7 | protein_coding | deleterious(0) | probably_damaging(0.981) | TCGA-AP-A0LD-01 | Endometrium | uterine corpus endometrioid carcinoma | Female | <65 | I/II | Unknown | Unknown | SD | |
| STXBP6 | SNV | Missense_Mutation | novel | c.406N>A | p.Asp136Asn | p.D136N | Q8NFX7 | protein_coding | tolerated(0.27) | benign(0.01) | TCGA-AP-A0LM-01 | Endometrium | uterine corpus endometrioid carcinoma | Female | <65 | III/IV | Chemotherapy | cisplatin | SD |
| Page: 1 2 3 |
Top |
Related drugs of malignant transformation related genes |
| Identification of chemicals and drugs interact with genes involved in malignant transfromation |
| (DGIdb 4.0) |
| Entrez ID | Symbol | Category | Interaction Types | Drug Claim Name | Drug Name | PMIDs |
| Page: 1 |

Copyright 2023-Present -The University of Texas Health Science Center at Houston |