
|
|||||
|
 | |
| |
| |
| |
| |
| |
|
Gene: STXBP5 |
Gene summary for STXBP5 |
| Gene information | Species | Human | Gene symbol | STXBP5 | Gene ID | 134957 |
| Gene name | syntaxin binding protein 5 | |
| Gene Alias | LGL3 | |
| Cytomap | 6q24.3 | |
| Gene Type | protein-coding | GO ID | GO:0001505 | UniProtAcc | Q5T5C0 |
Top |
Malignant transformation analysis |
| Identification of the aberrant gene expression in precancerous and cancerous lesions by comparing the gene expression of stem-like cells in diseased tissues with normal stem cells |
| Entrez ID | Symbol | Replicates | Species | Organ | Tissue | Adj P-value | Log2FC | Malignancy |
| 134957 | STXBP5 | HTA11_3410_2000001011 | Human | Colorectum | AD | 4.09e-55 | -1.09e+00 | 0.0155 |
| 134957 | STXBP5 | HTA11_2487_2000001011 | Human | Colorectum | SER | 5.74e-11 | -7.40e-01 | -0.1808 |
| 134957 | STXBP5 | HTA11_2951_2000001011 | Human | Colorectum | AD | 1.79e-05 | -1.01e+00 | 0.0216 |
| 134957 | STXBP5 | HTA11_1938_2000001011 | Human | Colorectum | AD | 2.27e-03 | -5.69e-01 | -0.0811 |
| 134957 | STXBP5 | HTA11_3361_2000001011 | Human | Colorectum | AD | 3.83e-24 | -1.12e+00 | -0.1207 |
| 134957 | STXBP5 | HTA11_83_2000001011 | Human | Colorectum | SER | 1.59e-07 | -6.67e-01 | -0.1526 |
| 134957 | STXBP5 | HTA11_696_2000001011 | Human | Colorectum | AD | 6.33e-20 | -6.25e-01 | -0.1464 |
| 134957 | STXBP5 | HTA11_866_2000001011 | Human | Colorectum | AD | 6.79e-22 | -5.91e-01 | -0.1001 |
| 134957 | STXBP5 | HTA11_1391_2000001011 | Human | Colorectum | AD | 5.92e-06 | -5.88e-01 | -0.059 |
| 134957 | STXBP5 | HTA11_2992_2000001011 | Human | Colorectum | SER | 1.96e-02 | -7.59e-01 | -0.1706 |
| 134957 | STXBP5 | HTA11_5212_2000001011 | Human | Colorectum | AD | 4.80e-08 | -8.51e-01 | -0.2061 |
| 134957 | STXBP5 | HTA11_546_2000001011 | Human | Colorectum | AD | 5.29e-05 | -6.32e-01 | -0.0842 |
| 134957 | STXBP5 | HTA11_9341_2000001011 | Human | Colorectum | SER | 7.99e-05 | -1.11e+00 | -0.00410000000000005 |
| 134957 | STXBP5 | HTA11_7862_2000001011 | Human | Colorectum | AD | 2.18e-10 | -7.33e-01 | -0.0179 |
| 134957 | STXBP5 | HTA11_866_3004761011 | Human | Colorectum | AD | 1.94e-38 | -1.01e+00 | 0.096 |
| 134957 | STXBP5 | HTA11_4255_2000001011 | Human | Colorectum | SER | 1.18e-04 | -8.86e-01 | 0.0446 |
| 134957 | STXBP5 | HTA11_9408_2000001011 | Human | Colorectum | AD | 5.47e-05 | -1.10e+00 | 0.0451 |
| 134957 | STXBP5 | HTA11_8622_2000001021 | Human | Colorectum | SER | 6.61e-14 | -1.05e+00 | 0.0528 |
| 134957 | STXBP5 | HTA11_10623_2000001011 | Human | Colorectum | AD | 6.17e-03 | -6.95e-01 | -0.0177 |
| 134957 | STXBP5 | HTA11_6801_2000001011 | Human | Colorectum | SER | 6.04e-05 | -8.79e-01 | 0.0171 |
| Page: 1 2 3 4 5 |
| Tissue | Expression Dynamics | Abbreviation |
| Colorectum (GSE201348) |  | FAP: Familial adenomatous polyposis |
| CRC: Colorectal cancer | ||
| Colorectum (HTA11) |  | AD: Adenomas |
| SER: Sessile serrated lesions | ||
| MSI-H: Microsatellite-high colorectal cancer | ||
| MSS: Microsatellite stable colorectal cancer | ||
| Lung | 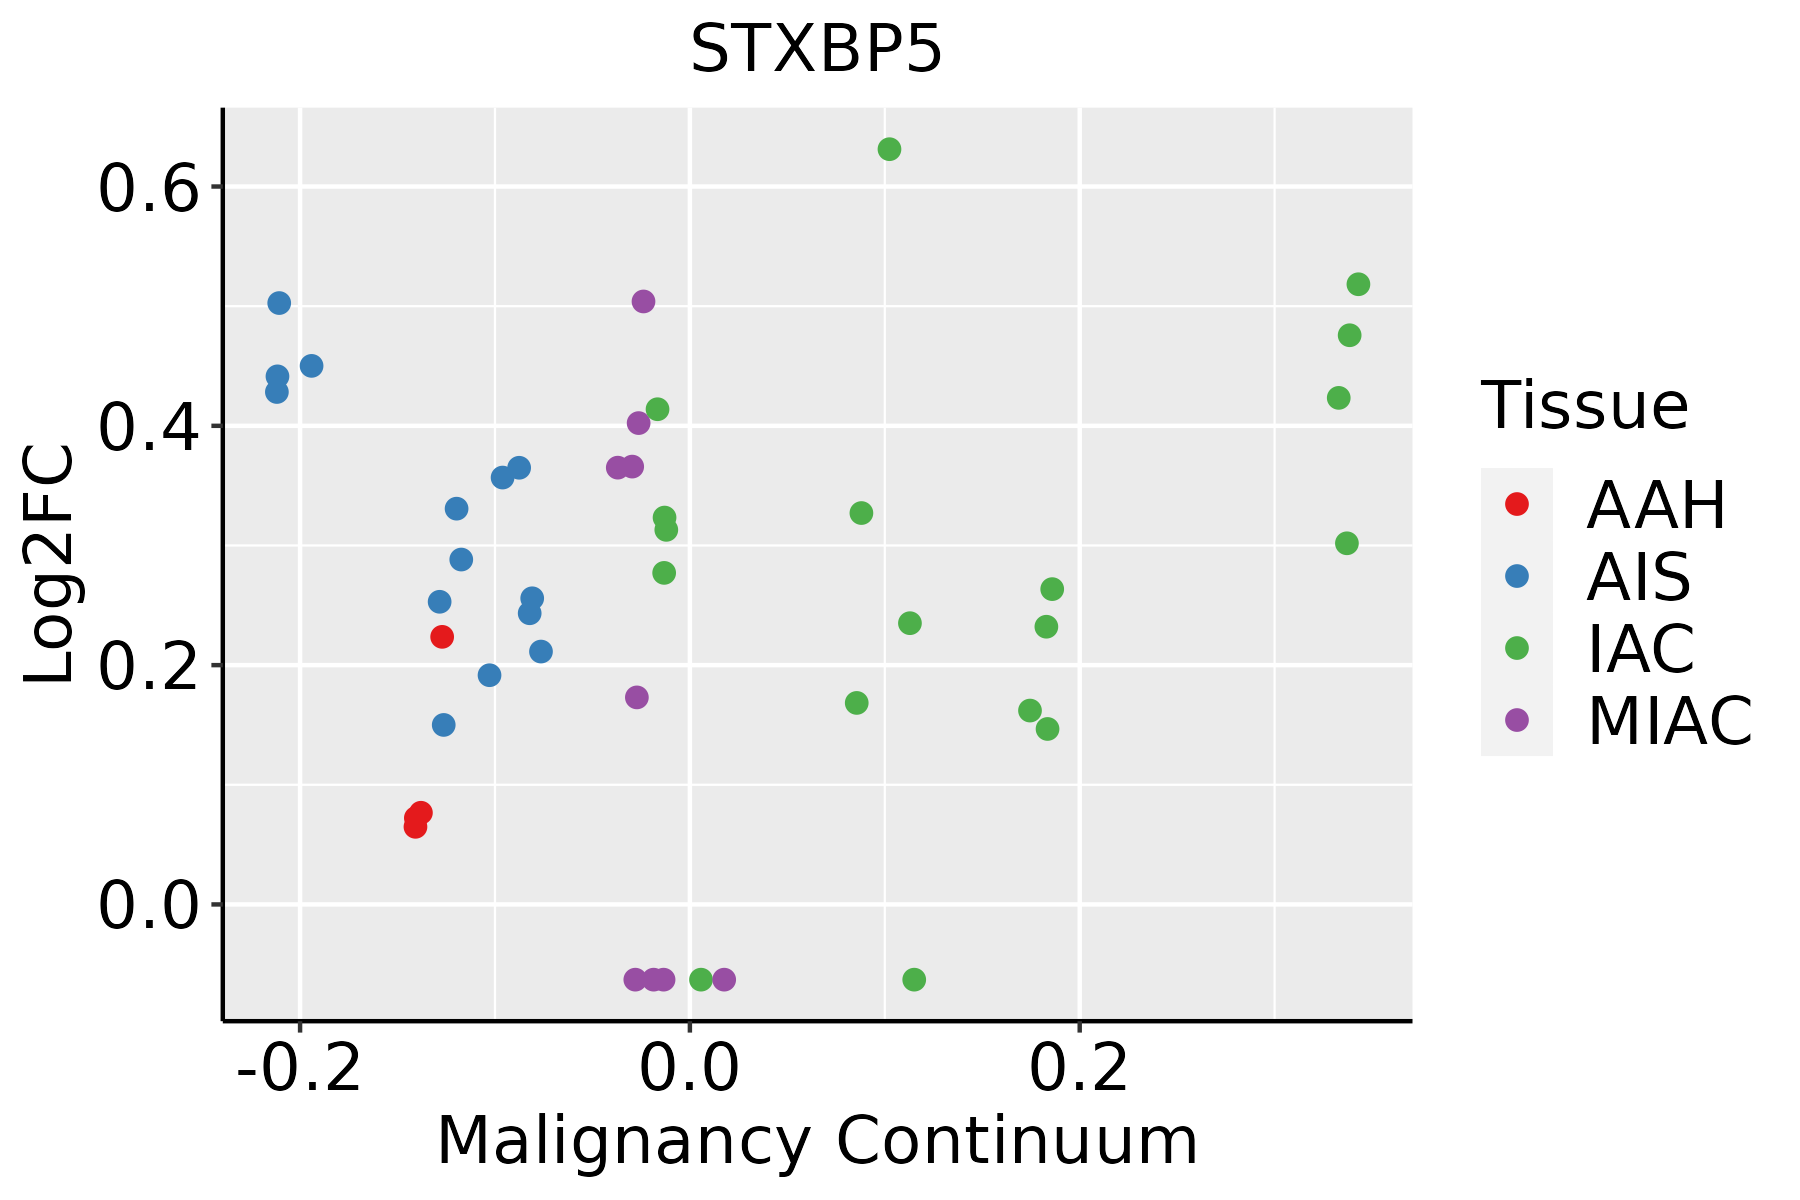 | AAH: Atypical adenomatous hyperplasia |
| AIS: Adenocarcinoma in situ | ||
| IAC: Invasive lung adenocarcinoma | ||
| MIA: Minimally invasive adenocarcinoma | ||
| Prostate |  | BPH: Benign Prostatic Hyperplasia |
| Thyroid | 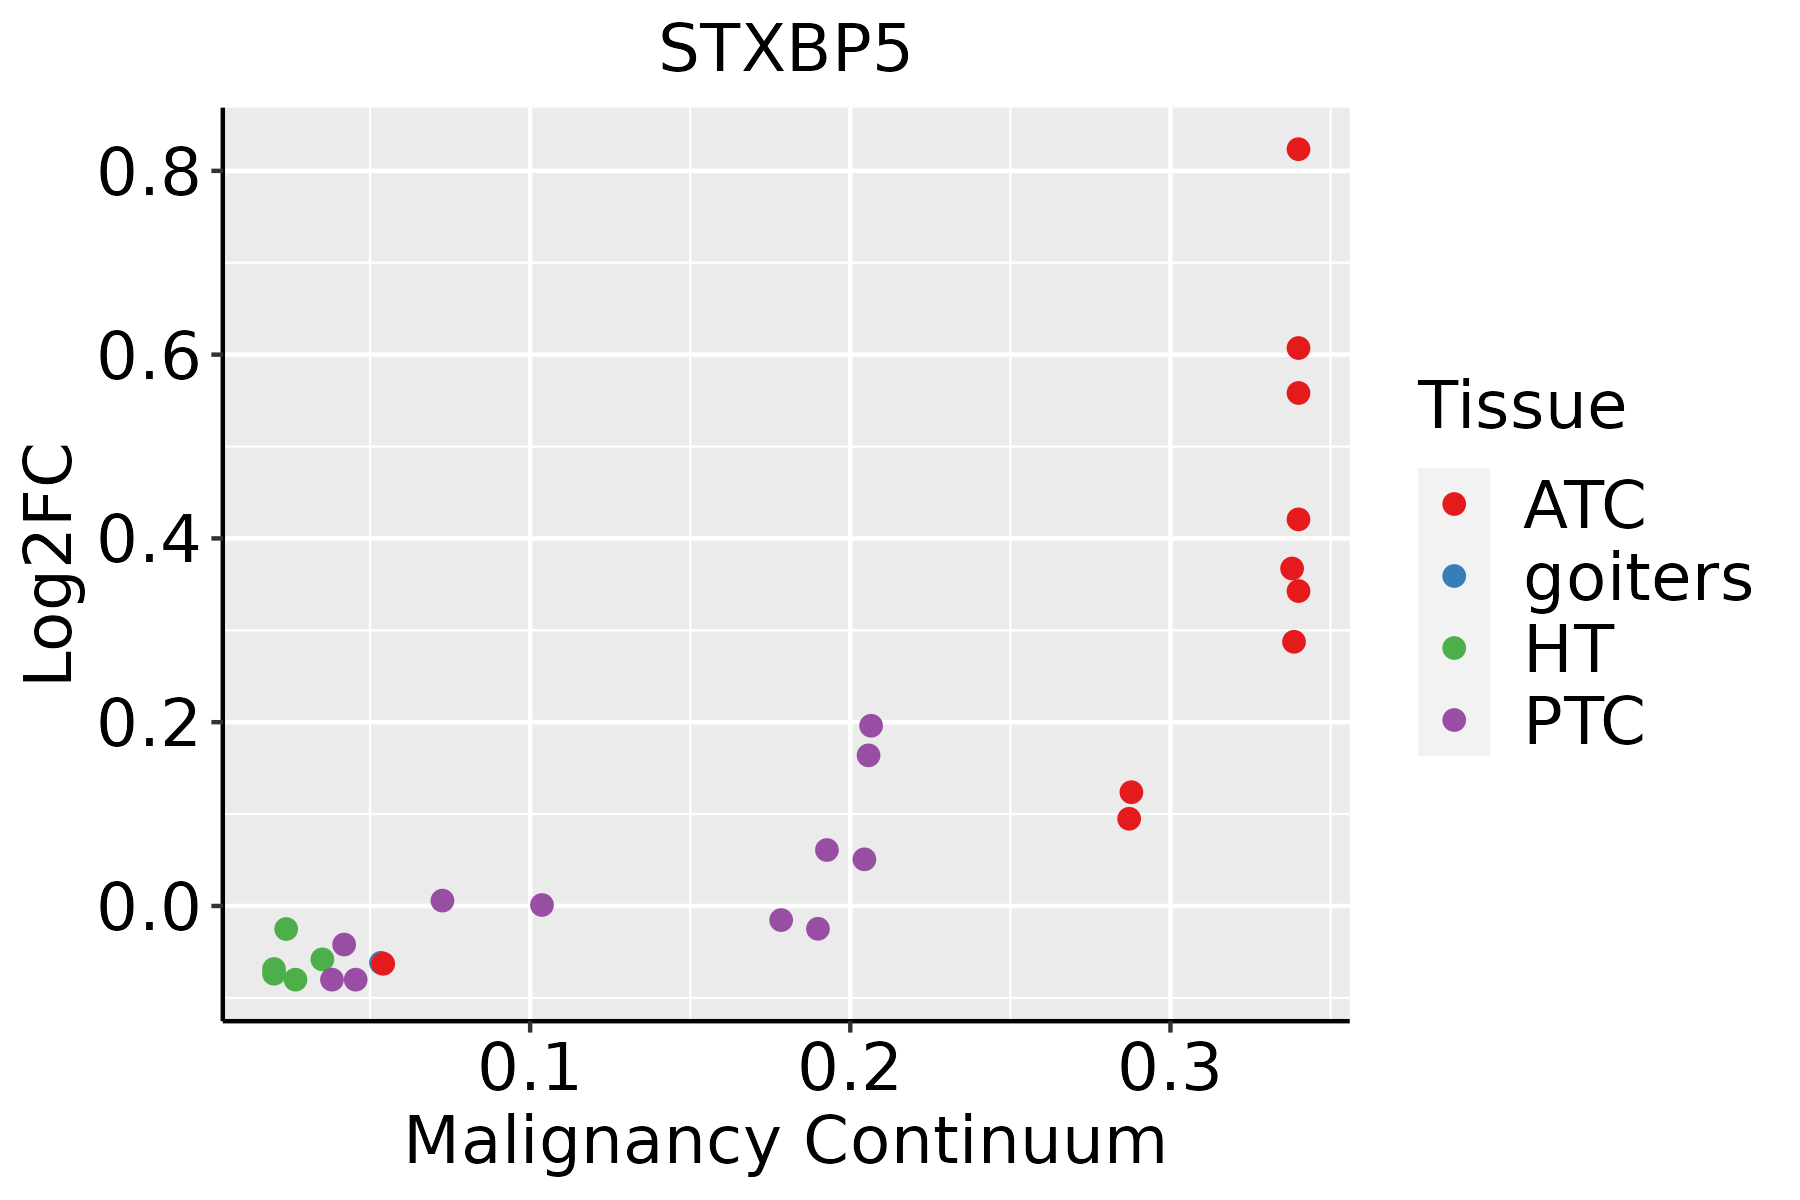 | ATC: Anaplastic thyroid cancer |
| HT: Hashimoto's thyroiditis | ||
| PTC: Papillary thyroid cancer |
| ∗log2FC in expression of this searched gene in stem-like cells from each diseased tissue sample relative to stem-like cells in normal samples in each tissue plotted against the malignancy continuum. Samples are colored based on if they are from different disease stage. |
Top |
Malignant transformation related pathway analysis |
| Find out the enriched GO biological processes and KEGG pathways involved in transition from healthy to precancer to cancer |
| Tissue | Disease Stage | Enriched GO biological Processes |
| Colorectum | AD |  |
| Colorectum | SER |  |
| Colorectum | MSS |  |
| Colorectum | MSI-H |  |
| Colorectum | FAP |  |
| ∗Top 15 enriched GO BP terms are showed in the bar plot of each disease state in each tissue. Each row represents a significant GO biological process which is colored according to the -log10(p.adjust). |
| Page: 1 2 3 4 5 6 7 8 9 |
| GO ID | Tissue | Disease Stage | Description | Gene Ratio | Bg Ratio | pvalue | p.adjust | Count |
| GO:00171574 | Cervix | CC | regulation of exocytosis | 39/2311 | 202/18723 | 2.90e-03 | 1.93e-02 | 39 |
| GO:00068873 | Cervix | CC | exocytosis | 59/2311 | 352/18723 | 8.74e-03 | 4.48e-02 | 59 |
| GO:0043254 | Colorectum | AD | regulation of protein-containing complex assembly | 148/3918 | 428/18723 | 2.64e-11 | 3.18e-09 | 148 |
| GO:0050708 | Colorectum | AD | regulation of protein secretion | 83/3918 | 268/18723 | 6.59e-05 | 1.07e-03 | 83 |
| GO:0009306 | Colorectum | AD | protein secretion | 105/3918 | 359/18723 | 1.05e-04 | 1.57e-03 | 105 |
| GO:0035592 | Colorectum | AD | establishment of protein localization to extracellular region | 105/3918 | 360/18723 | 1.18e-04 | 1.73e-03 | 105 |
| GO:0045921 | Colorectum | AD | positive regulation of exocytosis | 33/3918 | 86/18723 | 1.58e-04 | 2.20e-03 | 33 |
| GO:0071692 | Colorectum | AD | protein localization to extracellular region | 106/3918 | 368/18723 | 1.86e-04 | 2.49e-03 | 106 |
| GO:0051047 | Colorectum | AD | positive regulation of secretion | 90/3918 | 310/18723 | 4.11e-04 | 4.66e-03 | 90 |
| GO:1903532 | Colorectum | AD | positive regulation of secretion by cell | 82/3918 | 282/18723 | 6.85e-04 | 7.00e-03 | 82 |
| GO:0006887 | Colorectum | AD | exocytosis | 96/3918 | 352/18723 | 2.48e-03 | 1.90e-02 | 96 |
| GO:0017157 | Colorectum | AD | regulation of exocytosis | 59/3918 | 202/18723 | 3.20e-03 | 2.36e-02 | 59 |
| GO:0099003 | Colorectum | AD | vesicle-mediated transport in synapse | 57/3918 | 200/18723 | 6.53e-03 | 4.06e-02 | 57 |
| GO:00432541 | Colorectum | SER | regulation of protein-containing complex assembly | 119/2897 | 428/18723 | 3.34e-11 | 5.86e-09 | 119 |
| GO:00507081 | Colorectum | SER | regulation of protein secretion | 63/2897 | 268/18723 | 3.42e-04 | 5.39e-03 | 63 |
| GO:00093061 | Colorectum | SER | protein secretion | 79/2897 | 359/18723 | 5.99e-04 | 8.19e-03 | 79 |
| GO:00355921 | Colorectum | SER | establishment of protein localization to extracellular region | 79/2897 | 360/18723 | 6.54e-04 | 8.77e-03 | 79 |
| GO:00716921 | Colorectum | SER | protein localization to extracellular region | 80/2897 | 368/18723 | 8.13e-04 | 1.01e-02 | 80 |
| GO:00459211 | Colorectum | SER | positive regulation of exocytosis | 25/2897 | 86/18723 | 9.88e-04 | 1.17e-02 | 25 |
| GO:00068871 | Colorectum | SER | exocytosis | 75/2897 | 352/18723 | 2.05e-03 | 2.03e-02 | 75 |
| Page: 1 2 3 4 5 |
| Pathway ID | Tissue | Disease Stage | Description | Gene Ratio | Bg Ratio | pvalue | p.adjust | qvalue | Count |
| Page: 1 |
Top |
Cell-cell communication analysis |
| Identification of potential cell-cell interactions between two cell types and their ligand-receptor pairs for different disease states |
| Ligand | Receptor | LRpair | Pathway | Tissue | Disease Stage |
| Page: 1 |
Top |
Single-cell gene regulatory network inference analysis |
| Find out the significant the regulons (TFs) and the target genes of each regulon across cell types for different disease states |
| TF | Cell Type | Tissue | Disease Stage | Target Gene | RSS | Regulon Activity |
| ∗The dot plots of a searched regulon are shown for all cell subpopulations in each disease state of each tissue based on the regulon specific score inferred using pySCENIC and by calculating the average expression. |
| Page: 1 |
Top |
Somatic mutation of malignant transformation related genes |
| Annotation of somatic variants for genes involved in malignant transformation |
| Hugo Symbol | Variant Class | Variant Classification | dbSNP RS | HGVSc | HGVSp | HGVSp Short | SWISSPROT | BIOTYPE | SIFT | PolyPhen | Tumor Sample Barcode | Tissue | Histology | Sex | Age | Stage | Therapy Types | Drugs | Outcome |
| STXBP5 | SNV | Missense_Mutation | c.2552N>A | p.Ile851Lys | p.I851K | Q5T5C0 | protein_coding | deleterious(0) | benign(0.203) | TCGA-A8-A083-01 | Breast | breast invasive carcinoma | Female | >=65 | I/II | Unknown | Unknown | SD | |
| STXBP5 | SNV | Missense_Mutation | rs765718593 | c.488G>A | p.Arg163Gln | p.R163Q | Q5T5C0 | protein_coding | deleterious(0) | possibly_damaging(0.884) | TCGA-AN-A046-01 | Breast | breast invasive carcinoma | Female | >=65 | I/II | Unknown | Unknown | SD |
| STXBP5 | SNV | Missense_Mutation | novel | c.1207G>A | p.Glu403Lys | p.E403K | Q5T5C0 | protein_coding | tolerated(0.21) | probably_damaging(0.976) | TCGA-AN-A046-01 | Breast | breast invasive carcinoma | Female | >=65 | I/II | Unknown | Unknown | SD |
| STXBP5 | SNV | Missense_Mutation | c.2146N>C | p.Gly716Arg | p.G716R | Q5T5C0 | protein_coding | tolerated(0.23) | benign(0.031) | TCGA-AN-A0AR-01 | Breast | breast invasive carcinoma | Female | <65 | I/II | Unknown | Unknown | SD | |
| STXBP5 | SNV | Missense_Mutation | c.2422N>A | p.Asp808Asn | p.D808N | Q5T5C0 | protein_coding | deleterious(0) | possibly_damaging(0.706) | TCGA-AO-A0J4-01 | Breast | breast invasive carcinoma | Female | <65 | I/II | Chemotherapy | doxorubicin | SD | |
| STXBP5 | SNV | Missense_Mutation | c.326N>G | p.Asn109Ser | p.N109S | Q5T5C0 | protein_coding | deleterious(0) | possibly_damaging(0.864) | TCGA-C8-A134-01 | Breast | breast invasive carcinoma | Female | <65 | I/II | Chemotherapy | 5-fluorouracil | CR | |
| STXBP5 | SNV | Missense_Mutation | novel | c.2173N>A | p.Asp725Asn | p.D725N | Q5T5C0 | protein_coding | tolerated(0.35) | benign(0.003) | TCGA-E2-A10C-01 | Breast | breast invasive carcinoma | Female | <65 | I/II | Chemotherapy | cytoxan | SD |
| STXBP5 | SNV | Missense_Mutation | c.3026N>T | p.Ser1009Leu | p.S1009L | Q5T5C0 | protein_coding | deleterious(0) | benign(0.007) | TCGA-LL-A73Y-01 | Breast | breast invasive carcinoma | Female | >=65 | I/II | Chemotherapy | taxotere | SD | |
| STXBP5 | deletion | Frame_Shift_Del | novel | c.2402delN | p.Thr802ArgfsTer20 | p.T802Rfs*20 | Q5T5C0 | protein_coding | TCGA-EW-A2FV-01 | Breast | breast invasive carcinoma | Female | <65 | III/IV | Chemotherapy | docetaxel | SD | ||
| STXBP5 | SNV | Missense_Mutation | c.62N>T | p.Ser21Leu | p.S21L | Q5T5C0 | protein_coding | tolerated(0.08) | benign(0.089) | TCGA-C5-A1BQ-01 | Cervix | cervical & endocervical cancer | Female | >=65 | III/IV | Chemotherapy | cisplatin | CR |
| Page: 1 2 3 4 5 6 7 8 9 10 11 12 |
Top |
Related drugs of malignant transformation related genes |
| Identification of chemicals and drugs interact with genes involved in malignant transfromation |
| (DGIdb 4.0) |
| Entrez ID | Symbol | Category | Interaction Types | Drug Claim Name | Drug Name | PMIDs |
| Page: 1 |

Copyright 2023-Present -The University of Texas Health Science Center at Houston |