
|
|||||
|
 | |
| |
| |
| |
| |
| |
|
Gene: STXBP3 |
Gene summary for STXBP3 |
| Gene information | Species | Human | Gene symbol | STXBP3 | Gene ID | 6814 |
| Gene name | syntaxin binding protein 3 | |
| Gene Alias | MUNC18-3 | |
| Cytomap | 1p13.3 | |
| Gene Type | protein-coding | GO ID | GO:0001505 | UniProtAcc | O00186 |
Top |
Malignant transformation analysis |
| Identification of the aberrant gene expression in precancerous and cancerous lesions by comparing the gene expression of stem-like cells in diseased tissues with normal stem cells |
| Entrez ID | Symbol | Replicates | Species | Organ | Tissue | Adj P-value | Log2FC | Malignancy |
| 6814 | STXBP3 | LZE4T | Human | Esophagus | ESCC | 4.56e-05 | 9.77e-02 | 0.0811 |
| 6814 | STXBP3 | LZE7T | Human | Esophagus | ESCC | 9.87e-08 | 2.49e-01 | 0.0667 |
| 6814 | STXBP3 | LZE20T | Human | Esophagus | ESCC | 5.08e-04 | 1.26e-01 | 0.0662 |
| 6814 | STXBP3 | LZE24T | Human | Esophagus | ESCC | 4.32e-06 | 1.25e-01 | 0.0596 |
| 6814 | STXBP3 | LZE21T | Human | Esophagus | ESCC | 2.02e-07 | 1.87e-01 | 0.0655 |
| 6814 | STXBP3 | LZE6T | Human | Esophagus | ESCC | 1.11e-02 | 6.95e-02 | 0.0845 |
| 6814 | STXBP3 | P1T-E | Human | Esophagus | ESCC | 2.99e-02 | 1.61e-01 | 0.0875 |
| 6814 | STXBP3 | P2T-E | Human | Esophagus | ESCC | 2.54e-17 | 2.42e-01 | 0.1177 |
| 6814 | STXBP3 | P4T-E | Human | Esophagus | ESCC | 2.69e-14 | 1.87e-01 | 0.1323 |
| 6814 | STXBP3 | P5T-E | Human | Esophagus | ESCC | 1.79e-11 | 1.33e-01 | 0.1327 |
| 6814 | STXBP3 | P8T-E | Human | Esophagus | ESCC | 2.08e-20 | 2.94e-01 | 0.0889 |
| 6814 | STXBP3 | P9T-E | Human | Esophagus | ESCC | 5.73e-13 | 1.74e-01 | 0.1131 |
| 6814 | STXBP3 | P10T-E | Human | Esophagus | ESCC | 9.78e-14 | 2.08e-01 | 0.116 |
| 6814 | STXBP3 | P11T-E | Human | Esophagus | ESCC | 1.64e-15 | 3.44e-01 | 0.1426 |
| 6814 | STXBP3 | P12T-E | Human | Esophagus | ESCC | 6.12e-30 | 6.00e-01 | 0.1122 |
| 6814 | STXBP3 | P15T-E | Human | Esophagus | ESCC | 5.02e-09 | 7.96e-02 | 0.1149 |
| 6814 | STXBP3 | P16T-E | Human | Esophagus | ESCC | 1.91e-08 | 4.97e-02 | 0.1153 |
| 6814 | STXBP3 | P19T-E | Human | Esophagus | ESCC | 1.46e-08 | 3.84e-01 | 0.1662 |
| 6814 | STXBP3 | P20T-E | Human | Esophagus | ESCC | 7.01e-14 | 3.13e-01 | 0.1124 |
| 6814 | STXBP3 | P21T-E | Human | Esophagus | ESCC | 1.36e-16 | 1.05e-01 | 0.1617 |
| Page: 1 2 3 4 5 6 |
| Tissue | Expression Dynamics | Abbreviation |
| Esophagus | 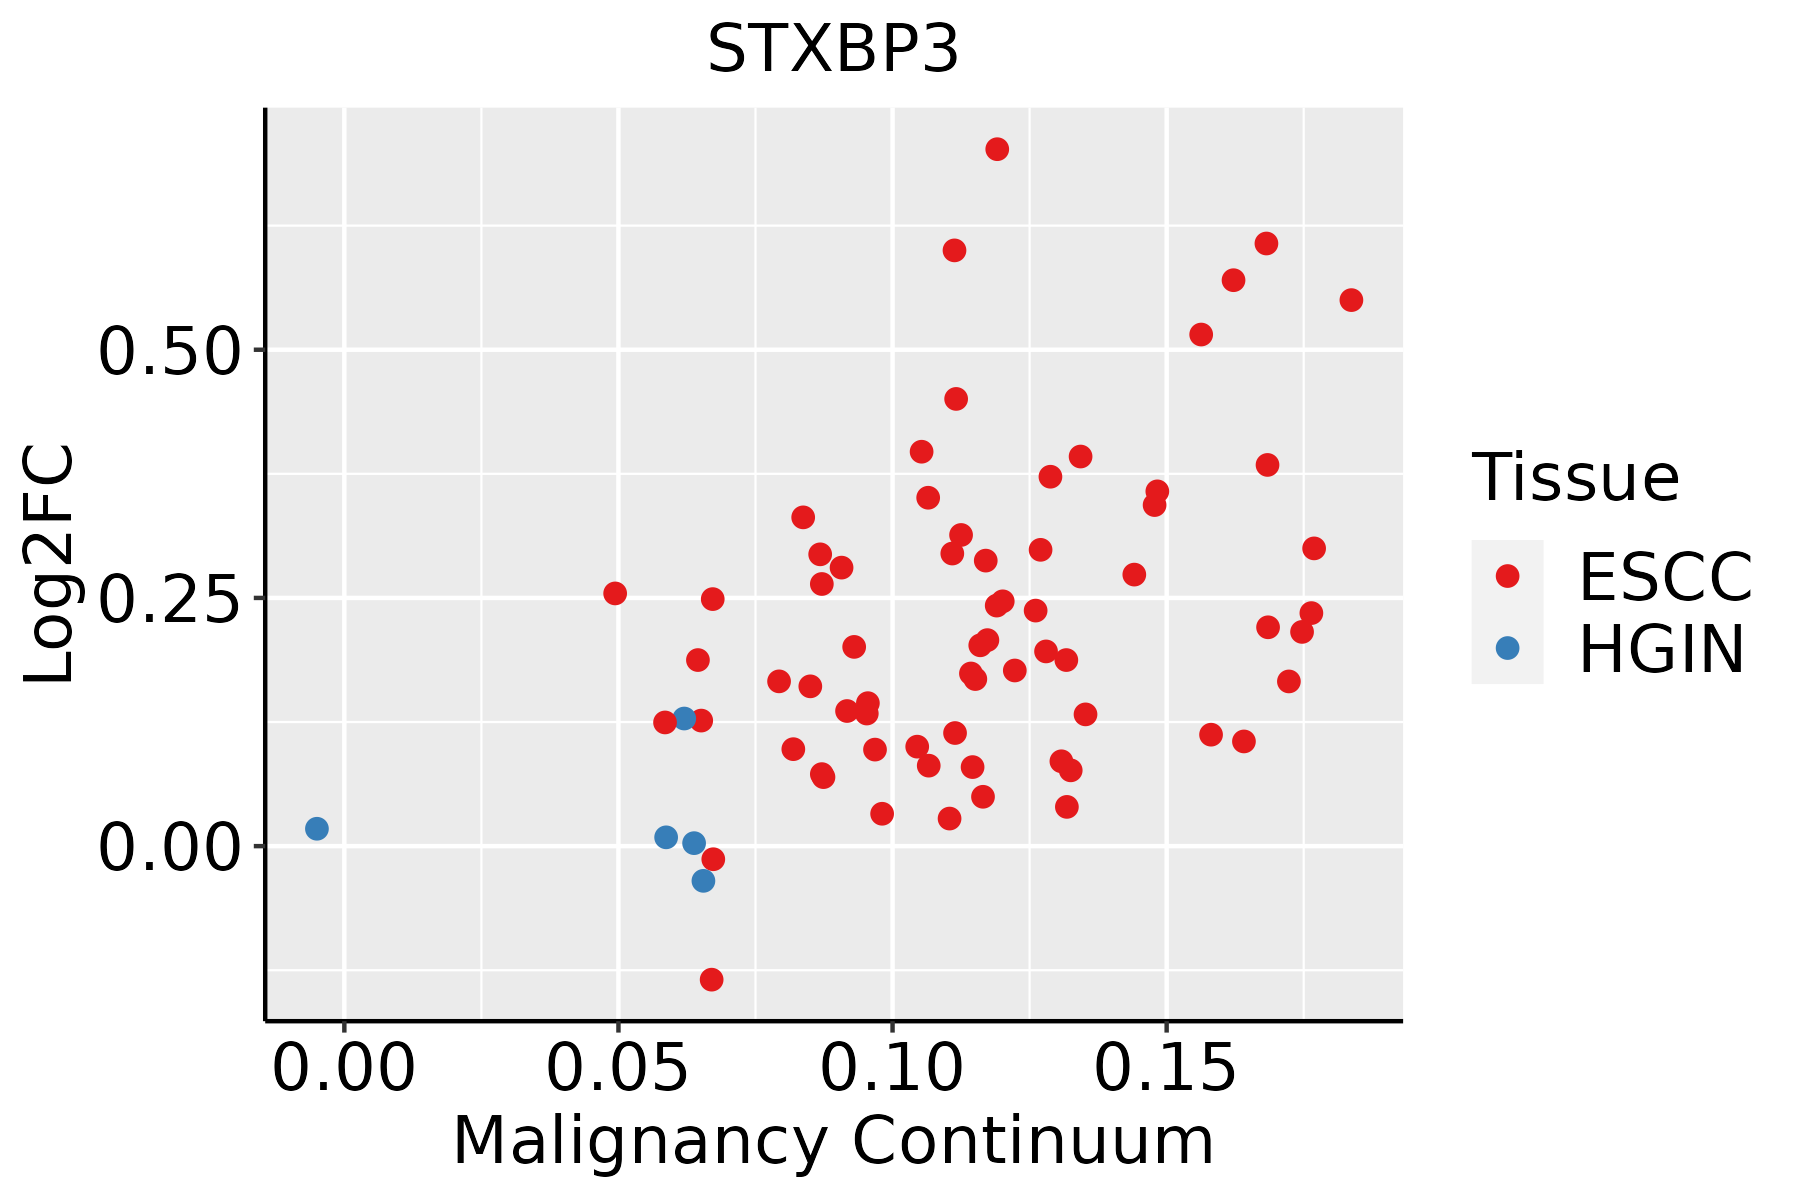 | ESCC: Esophageal squamous cell carcinoma |
| HGIN: High-grade intraepithelial neoplasias | ||
| LGIN: Low-grade intraepithelial neoplasias | ||
| Lung | 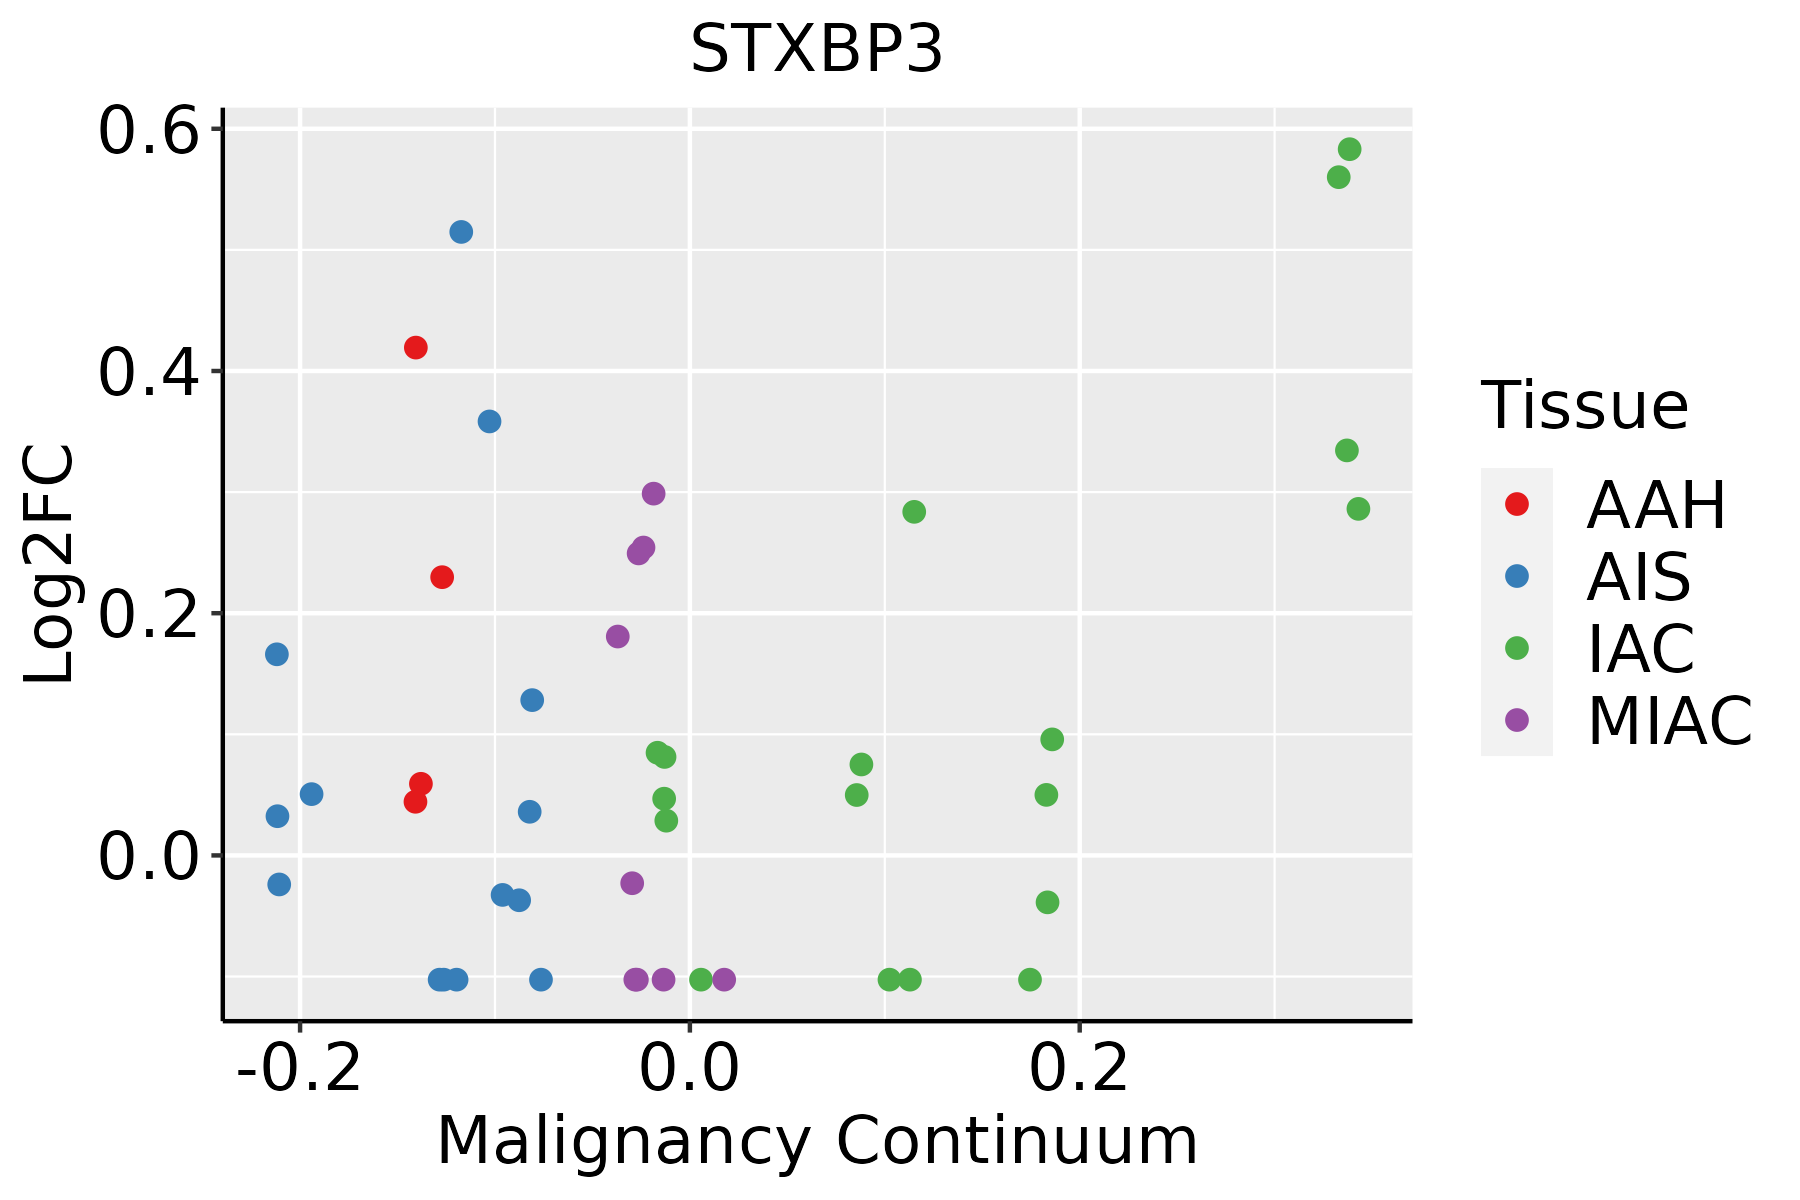 | AAH: Atypical adenomatous hyperplasia |
| AIS: Adenocarcinoma in situ | ||
| IAC: Invasive lung adenocarcinoma | ||
| MIA: Minimally invasive adenocarcinoma | ||
| Oral Cavity |  | EOLP: Erosive Oral lichen planus |
| LP: leukoplakia | ||
| NEOLP: Non-erosive oral lichen planus | ||
| OSCC: Oral squamous cell carcinoma | ||
| Skin | 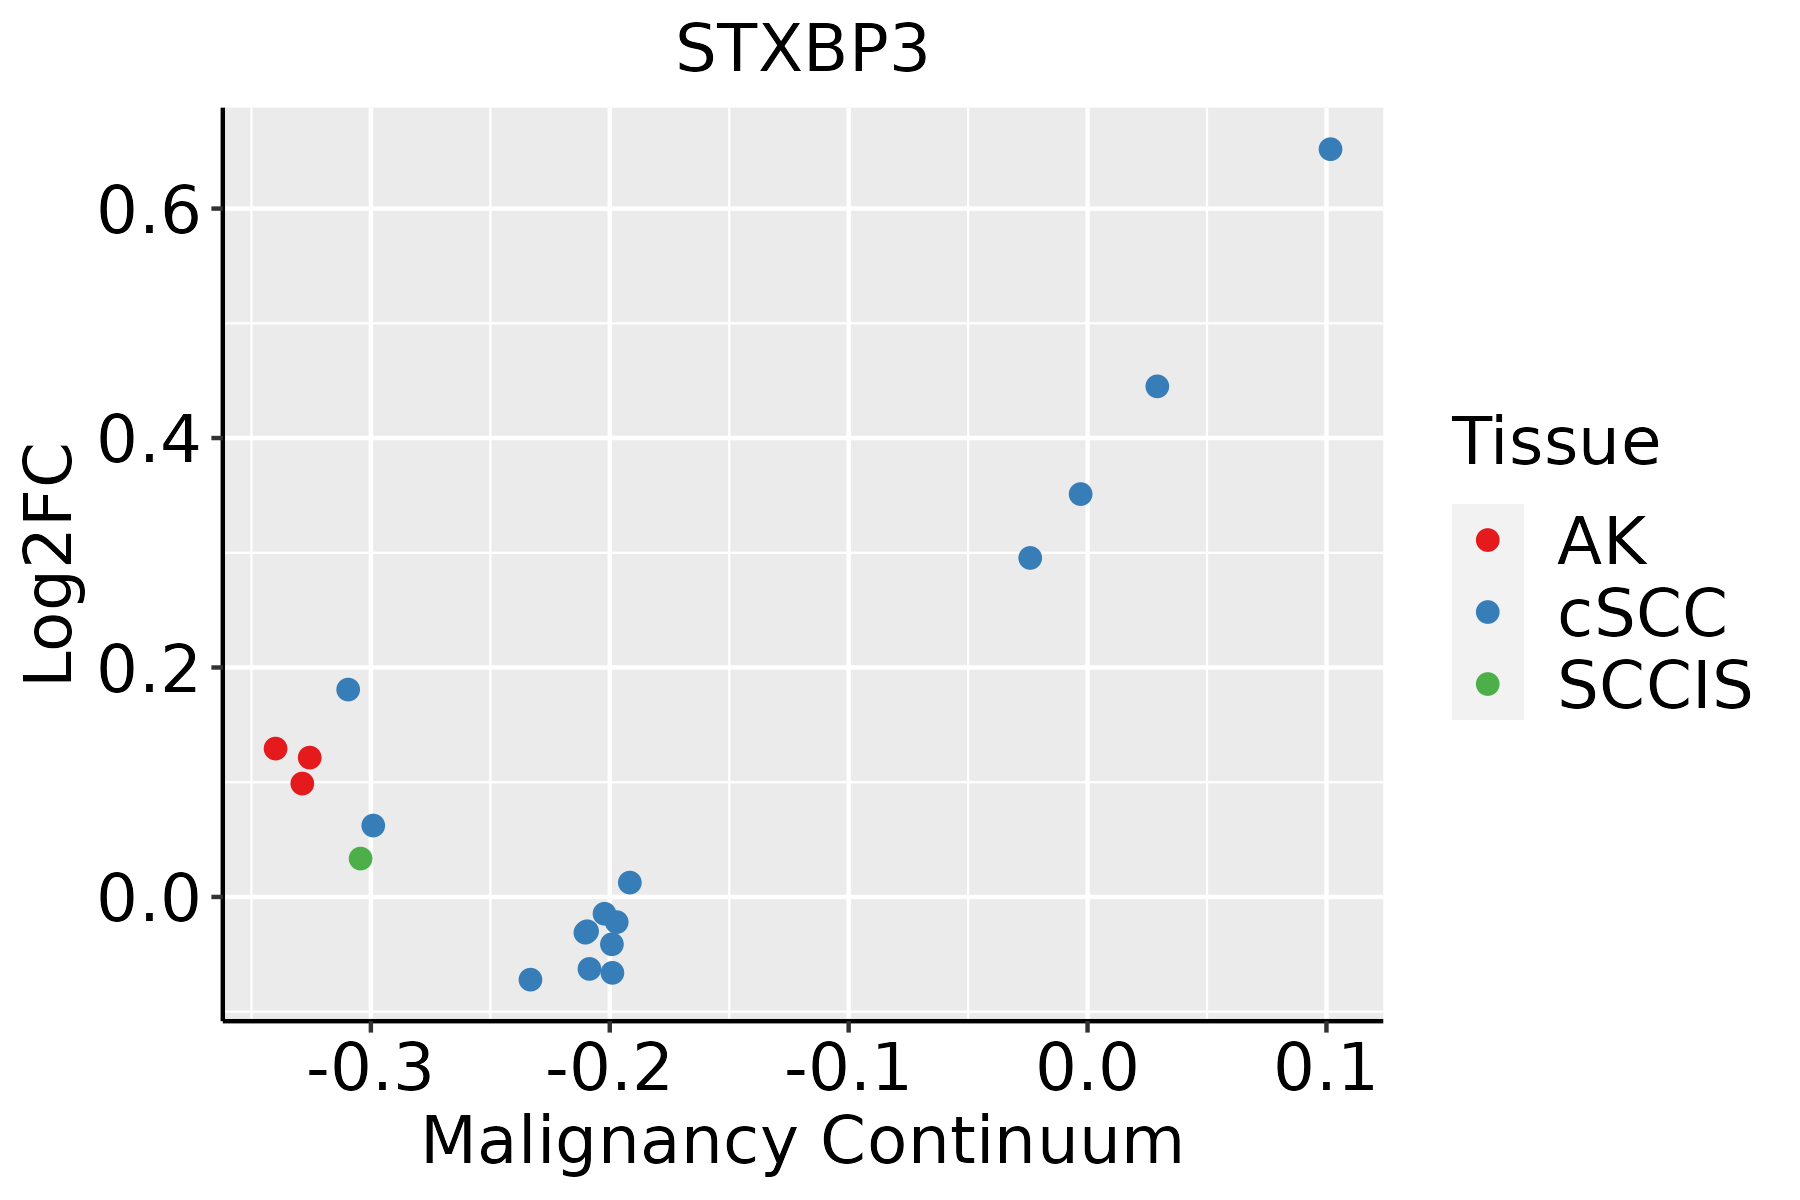 | AK: Actinic keratosis |
| cSCC: Cutaneous squamous cell carcinoma | ||
| SCCIS:squamous cell carcinoma in situ | ||
| Thyroid | 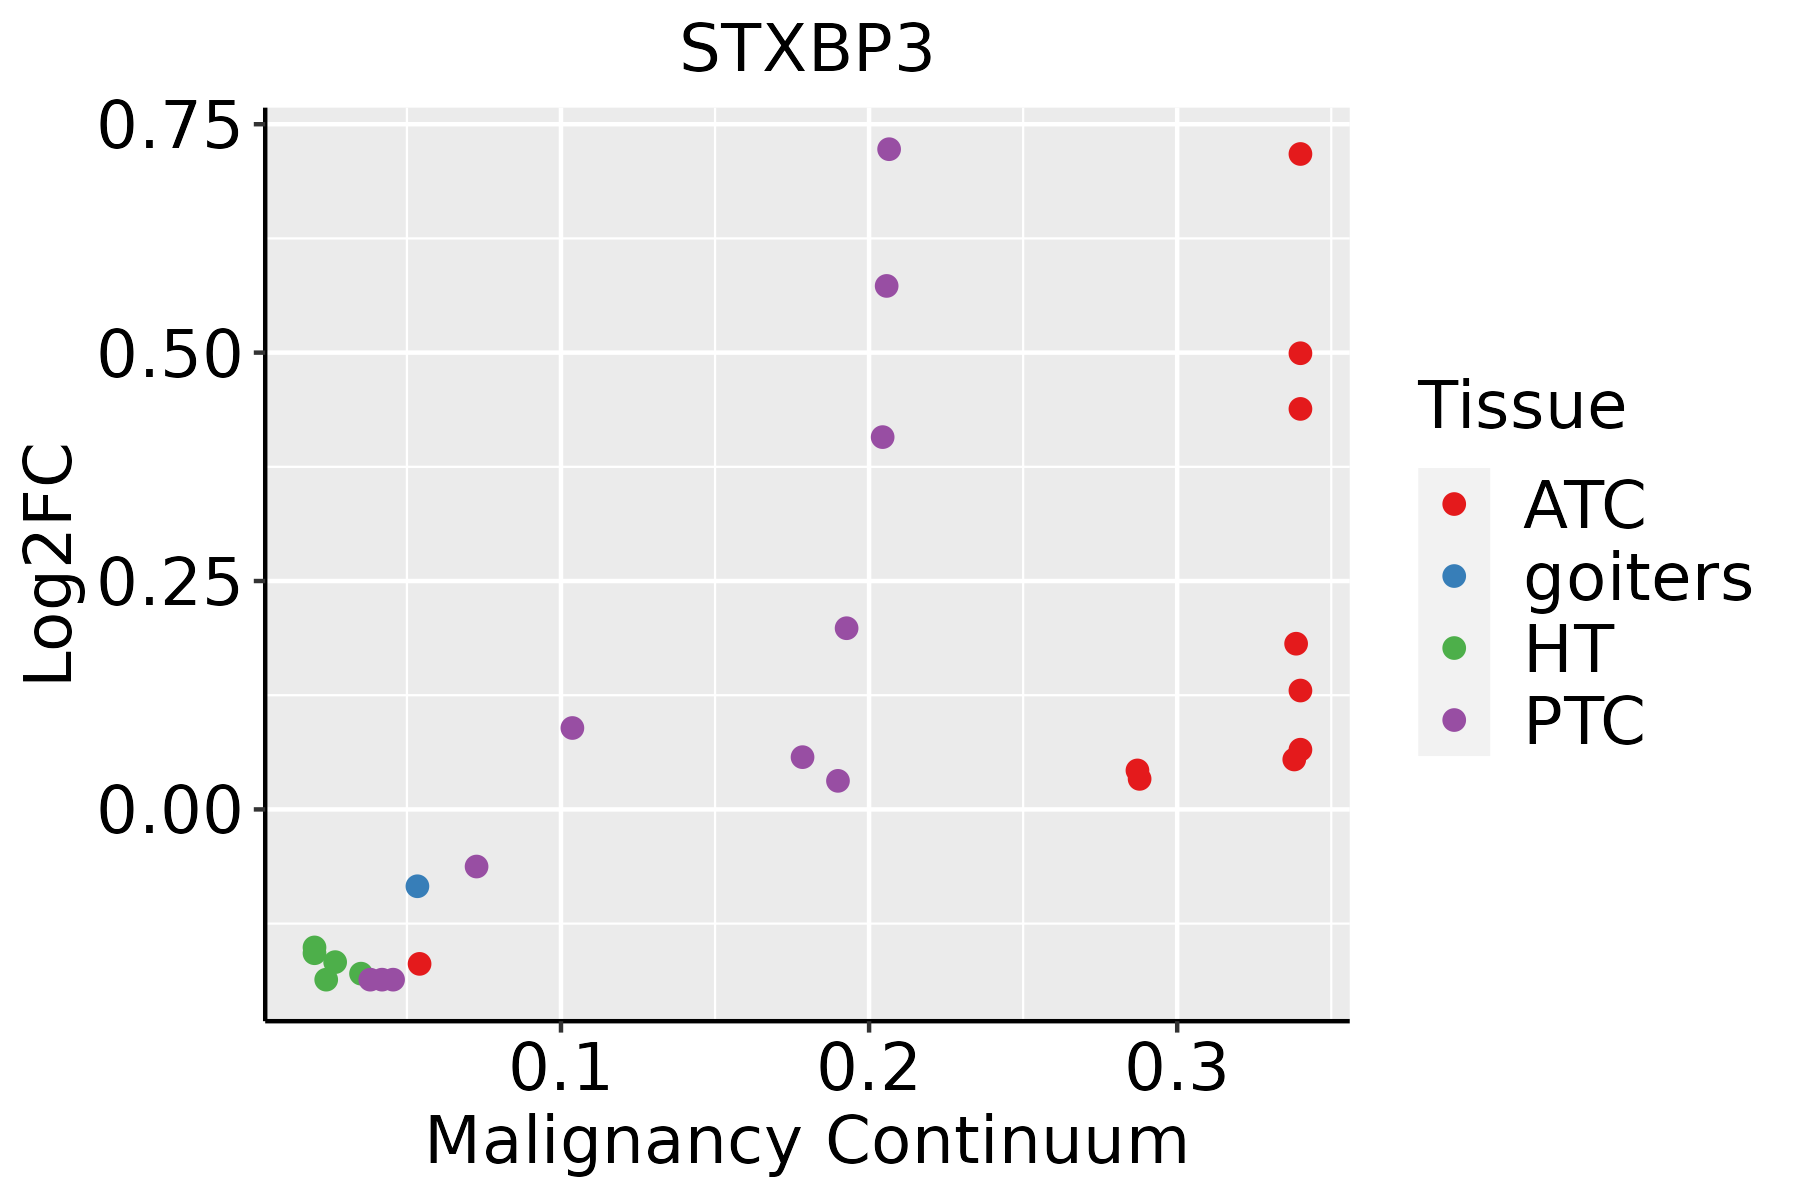 | ATC: Anaplastic thyroid cancer |
| HT: Hashimoto's thyroiditis | ||
| PTC: Papillary thyroid cancer |
| ∗log2FC in expression of this searched gene in stem-like cells from each diseased tissue sample relative to stem-like cells in normal samples in each tissue plotted against the malignancy continuum. Samples are colored based on if they are from different disease stage. |
Top |
Malignant transformation related pathway analysis |
| Find out the enriched GO biological processes and KEGG pathways involved in transition from healthy to precancer to cancer |
| Tissue | Disease Stage | Enriched GO biological Processes |
| Colorectum | AD |  |
| Colorectum | SER |  |
| Colorectum | MSS |  |
| Colorectum | MSI-H |  |
| Colorectum | FAP |  |
| ∗Top 15 enriched GO BP terms are showed in the bar plot of each disease state in each tissue. Each row represents a significant GO biological process which is colored according to the -log10(p.adjust). |
| Page: 1 2 3 4 5 6 7 8 9 |
| GO ID | Tissue | Disease Stage | Description | Gene Ratio | Bg Ratio | pvalue | p.adjust | Count |
| GO:004206027 | Esophagus | ESCC | wound healing | 243/8552 | 422/18723 | 4.62e-07 | 6.25e-06 | 243 |
| GO:00224069 | Esophagus | ESCC | membrane docking | 62/8552 | 86/18723 | 5.93e-07 | 7.79e-06 | 62 |
| GO:0043434111 | Esophagus | ESCC | response to peptide hormone | 234/8552 | 414/18723 | 4.93e-06 | 5.21e-05 | 234 |
| GO:003286818 | Esophagus | ESCC | response to insulin | 156/8552 | 264/18723 | 7.21e-06 | 7.20e-05 | 156 |
| GO:01400567 | Esophagus | ESCC | organelle localization by membrane tethering | 53/8552 | 77/18723 | 3.33e-05 | 2.74e-04 | 53 |
| GO:00343418 | Esophagus | ESCC | response to interferon-gamma | 86/8552 | 141/18723 | 1.74e-04 | 1.14e-03 | 86 |
| GO:00482781 | Esophagus | ESCC | vesicle docking | 38/8552 | 59/18723 | 2.86e-03 | 1.21e-02 | 38 |
| GO:000930617 | Esophagus | ESCC | protein secretion | 190/8552 | 359/18723 | 3.22e-03 | 1.34e-02 | 190 |
| GO:00713466 | Esophagus | ESCC | cellular response to interferon-gamma | 69/8552 | 118/18723 | 3.44e-03 | 1.41e-02 | 69 |
| GO:003559217 | Esophagus | ESCC | establishment of protein localization to extracellular region | 190/8552 | 360/18723 | 3.77e-03 | 1.53e-02 | 190 |
| GO:003410920 | Esophagus | ESCC | homotypic cell-cell adhesion | 54/8552 | 90/18723 | 4.33e-03 | 1.72e-02 | 54 |
| GO:007169210 | Esophagus | ESCC | protein localization to extracellular region | 193/8552 | 368/18723 | 5.01e-03 | 1.92e-02 | 193 |
| GO:00434347 | Lung | IAC | response to peptide hormone | 75/2061 | 414/18723 | 9.29e-06 | 3.06e-04 | 75 |
| GO:00420608 | Lung | IAC | wound healing | 76/2061 | 422/18723 | 1.01e-05 | 3.23e-04 | 76 |
| GO:00328686 | Lung | IAC | response to insulin | 53/2061 | 264/18723 | 1.03e-05 | 3.24e-04 | 53 |
| GO:00341098 | Lung | IAC | homotypic cell-cell adhesion | 19/2061 | 90/18723 | 3.82e-03 | 3.18e-02 | 19 |
| GO:00224066 | Lung | IAC | membrane docking | 18/2061 | 86/18723 | 5.26e-03 | 3.99e-02 | 18 |
| GO:004206020 | Oral cavity | OSCC | wound healing | 237/7305 | 422/18723 | 4.51e-13 | 2.18e-11 | 237 |
| GO:004343419 | Oral cavity | OSCC | response to peptide hormone | 208/7305 | 414/18723 | 1.83e-06 | 2.35e-05 | 208 |
| GO:00343417 | Oral cavity | OSCC | response to interferon-gamma | 81/7305 | 141/18723 | 6.77e-06 | 7.43e-05 | 81 |
| Page: 1 2 3 4 5 6 7 |
| Pathway ID | Tissue | Disease Stage | Description | Gene Ratio | Bg Ratio | pvalue | p.adjust | qvalue | Count |
| Page: 1 |
Top |
Cell-cell communication analysis |
| Identification of potential cell-cell interactions between two cell types and their ligand-receptor pairs for different disease states |
| Ligand | Receptor | LRpair | Pathway | Tissue | Disease Stage |
| Page: 1 |
Top |
Single-cell gene regulatory network inference analysis |
| Find out the significant the regulons (TFs) and the target genes of each regulon across cell types for different disease states |
| TF | Cell Type | Tissue | Disease Stage | Target Gene | RSS | Regulon Activity |
| ∗The dot plots of a searched regulon are shown for all cell subpopulations in each disease state of each tissue based on the regulon specific score inferred using pySCENIC and by calculating the average expression. |
| Page: 1 |
Top |
Somatic mutation of malignant transformation related genes |
| Annotation of somatic variants for genes involved in malignant transformation |
| Hugo Symbol | Variant Class | Variant Classification | dbSNP RS | HGVSc | HGVSp | HGVSp Short | SWISSPROT | BIOTYPE | SIFT | PolyPhen | Tumor Sample Barcode | Tissue | Histology | Sex | Age | Stage | Therapy Types | Drugs | Outcome |
| STXBP3 | SNV | Missense_Mutation | c.1129G>C | p.Asp377His | p.D377H | O00186 | protein_coding | deleterious(0) | probably_damaging(1) | TCGA-AC-A2B8-01 | Breast | breast invasive carcinoma | Female | >=65 | I/II | Chemotherapy | chemo | PD | |
| STXBP3 | SNV | Missense_Mutation | novel | c.1438G>T | p.Asp480Tyr | p.D480Y | O00186 | protein_coding | deleterious(0.01) | probably_damaging(1) | TCGA-AN-A046-01 | Breast | breast invasive carcinoma | Female | >=65 | I/II | Unknown | Unknown | SD |
| STXBP3 | SNV | Missense_Mutation | c.24N>C | p.Arg8Ser | p.R8S | O00186 | protein_coding | tolerated(0.54) | benign(0.121) | TCGA-AR-A1AO-01 | Breast | breast invasive carcinoma | Female | <65 | I/II | Chemotherapy | doxorubicin | SD | |
| STXBP3 | SNV | Missense_Mutation | c.273C>G | p.Phe91Leu | p.F91L | O00186 | protein_coding | tolerated(1) | benign(0.038) | TCGA-D8-A1J8-01 | Breast | breast invasive carcinoma | Female | >=65 | I/II | Hormone Therapy | nolvadex | SD | |
| STXBP3 | SNV | Missense_Mutation | novel | c.715N>A | p.Asp239Asn | p.D239N | O00186 | protein_coding | deleterious(0) | probably_damaging(0.962) | TCGA-GM-A2DH-01 | Breast | breast invasive carcinoma | Female | <65 | I/II | Chemotherapy | taxol | CR |
| STXBP3 | SNV | Missense_Mutation | rs750050452 | c.1633N>T | p.Arg545Cys | p.R545C | O00186 | protein_coding | deleterious(0) | probably_damaging(0.999) | TCGA-EA-A3HS-01 | Cervix | cervical & endocervical cancer | Female | <65 | I/II | Unknown | Unknown | SD |
| STXBP3 | SNV | Missense_Mutation | c.232C>T | p.Leu78Phe | p.L78F | O00186 | protein_coding | deleterious(0) | possibly_damaging(0.791) | TCGA-FU-A40J-01 | Cervix | cervical & endocervical cancer | Female | <65 | III/IV | Chemotherapy | carboplatin | CR | |
| STXBP3 | SNV | Missense_Mutation | novel | c.1157N>A | p.Ser386Tyr | p.S386Y | O00186 | protein_coding | deleterious(0.03) | benign(0.201) | TCGA-ZJ-AAXB-01 | Cervix | cervical & endocervical cancer | Female | <65 | I/II | Unknown | Unknown | SD |
| STXBP3 | SNV | Missense_Mutation | c.718C>T | p.Arg240Cys | p.R240C | O00186 | protein_coding | deleterious(0) | probably_damaging(0.999) | TCGA-AZ-4315-01 | Colorectum | colon adenocarcinoma | Male | <65 | I/II | Unknown | Unknown | SD | |
| STXBP3 | SNV | Missense_Mutation | c.1486C>T | p.Pro496Ser | p.P496S | O00186 | protein_coding | deleterious(0.02) | probably_damaging(0.999) | TCGA-CK-4951-01 | Colorectum | colon adenocarcinoma | Female | >=65 | I/II | Unknown | Unknown | PD |
| Page: 1 2 3 4 5 6 |
Top |
Related drugs of malignant transformation related genes |
| Identification of chemicals and drugs interact with genes involved in malignant transfromation |
| (DGIdb 4.0) |
| Entrez ID | Symbol | Category | Interaction Types | Drug Claim Name | Drug Name | PMIDs |
| Page: 1 |

Copyright 2023-Present -The University of Texas Health Science Center at Houston |