
|
|||||
|
 | |
| |
| |
| |
| |
| |
|
Gene: STXBP2 |
Gene summary for STXBP2 |
| Gene information | Species | Human | Gene symbol | STXBP2 | Gene ID | 6813 |
| Gene name | syntaxin binding protein 2 | |
| Gene Alias | FHL5 | |
| Cytomap | 19p13.2 | |
| Gene Type | protein-coding | GO ID | GO:0001505 | UniProtAcc | Q15833 |
Top |
Malignant transformation analysis |
| Identification of the aberrant gene expression in precancerous and cancerous lesions by comparing the gene expression of stem-like cells in diseased tissues with normal stem cells |
| Entrez ID | Symbol | Replicates | Species | Organ | Tissue | Adj P-value | Log2FC | Malignancy |
| 6813 | STXBP2 | HTA11_2487_2000001011 | Human | Colorectum | SER | 3.04e-06 | 3.99e-01 | -0.1808 |
| 6813 | STXBP2 | HTA11_347_2000001011 | Human | Colorectum | AD | 1.16e-06 | 1.97e-01 | -0.1954 |
| 6813 | STXBP2 | HTA11_2112_2000001011 | Human | Colorectum | SER | 8.05e-06 | 5.29e-01 | -0.2196 |
| 6813 | STXBP2 | HTA11_696_2000001011 | Human | Colorectum | AD | 4.12e-06 | 2.53e-01 | -0.1464 |
| 6813 | STXBP2 | HTA11_1391_2000001011 | Human | Colorectum | AD | 1.45e-06 | 2.35e-01 | -0.059 |
| 6813 | STXBP2 | HTA11_2992_2000001011 | Human | Colorectum | SER | 1.41e-02 | 3.45e-01 | -0.1706 |
| 6813 | STXBP2 | HTA11_10711_2000001011 | Human | Colorectum | AD | 2.08e-03 | 2.11e-01 | 0.0338 |
| 6813 | STXBP2 | LZE4T | Human | Esophagus | ESCC | 7.97e-19 | 4.98e-01 | 0.0811 |
| 6813 | STXBP2 | LZE5T | Human | Esophagus | ESCC | 1.64e-03 | 4.06e-01 | 0.0514 |
| 6813 | STXBP2 | LZE7T | Human | Esophagus | ESCC | 9.10e-09 | 7.70e-01 | 0.0667 |
| 6813 | STXBP2 | LZE8T | Human | Esophagus | ESCC | 2.14e-11 | 5.02e-01 | 0.067 |
| 6813 | STXBP2 | LZE20T | Human | Esophagus | ESCC | 4.22e-07 | 1.80e-01 | 0.0662 |
| 6813 | STXBP2 | LZE22D1 | Human | Esophagus | HGIN | 1.13e-02 | 2.28e-01 | 0.0595 |
| 6813 | STXBP2 | LZE22T | Human | Esophagus | ESCC | 7.99e-05 | 4.06e-01 | 0.068 |
| 6813 | STXBP2 | LZE24T | Human | Esophagus | ESCC | 5.05e-37 | 9.89e-01 | 0.0596 |
| 6813 | STXBP2 | LZE21T | Human | Esophagus | ESCC | 8.64e-11 | 5.77e-01 | 0.0655 |
| 6813 | STXBP2 | LZE6T | Human | Esophagus | ESCC | 2.21e-10 | 5.30e-01 | 0.0845 |
| 6813 | STXBP2 | P1T-E | Human | Esophagus | ESCC | 1.01e-18 | 9.11e-01 | 0.0875 |
| 6813 | STXBP2 | P2T-E | Human | Esophagus | ESCC | 8.73e-20 | 2.69e-01 | 0.1177 |
| 6813 | STXBP2 | P4T-E | Human | Esophagus | ESCC | 2.10e-24 | 6.53e-01 | 0.1323 |
| Page: 1 2 3 4 5 6 7 |
| Tissue | Expression Dynamics | Abbreviation |
| Colorectum (GSE201348) |  | FAP: Familial adenomatous polyposis |
| CRC: Colorectal cancer | ||
| Colorectum (HTA11) |  | AD: Adenomas |
| SER: Sessile serrated lesions | ||
| MSI-H: Microsatellite-high colorectal cancer | ||
| MSS: Microsatellite stable colorectal cancer | ||
| Esophagus |  | ESCC: Esophageal squamous cell carcinoma |
| HGIN: High-grade intraepithelial neoplasias | ||
| LGIN: Low-grade intraepithelial neoplasias | ||
| Liver | 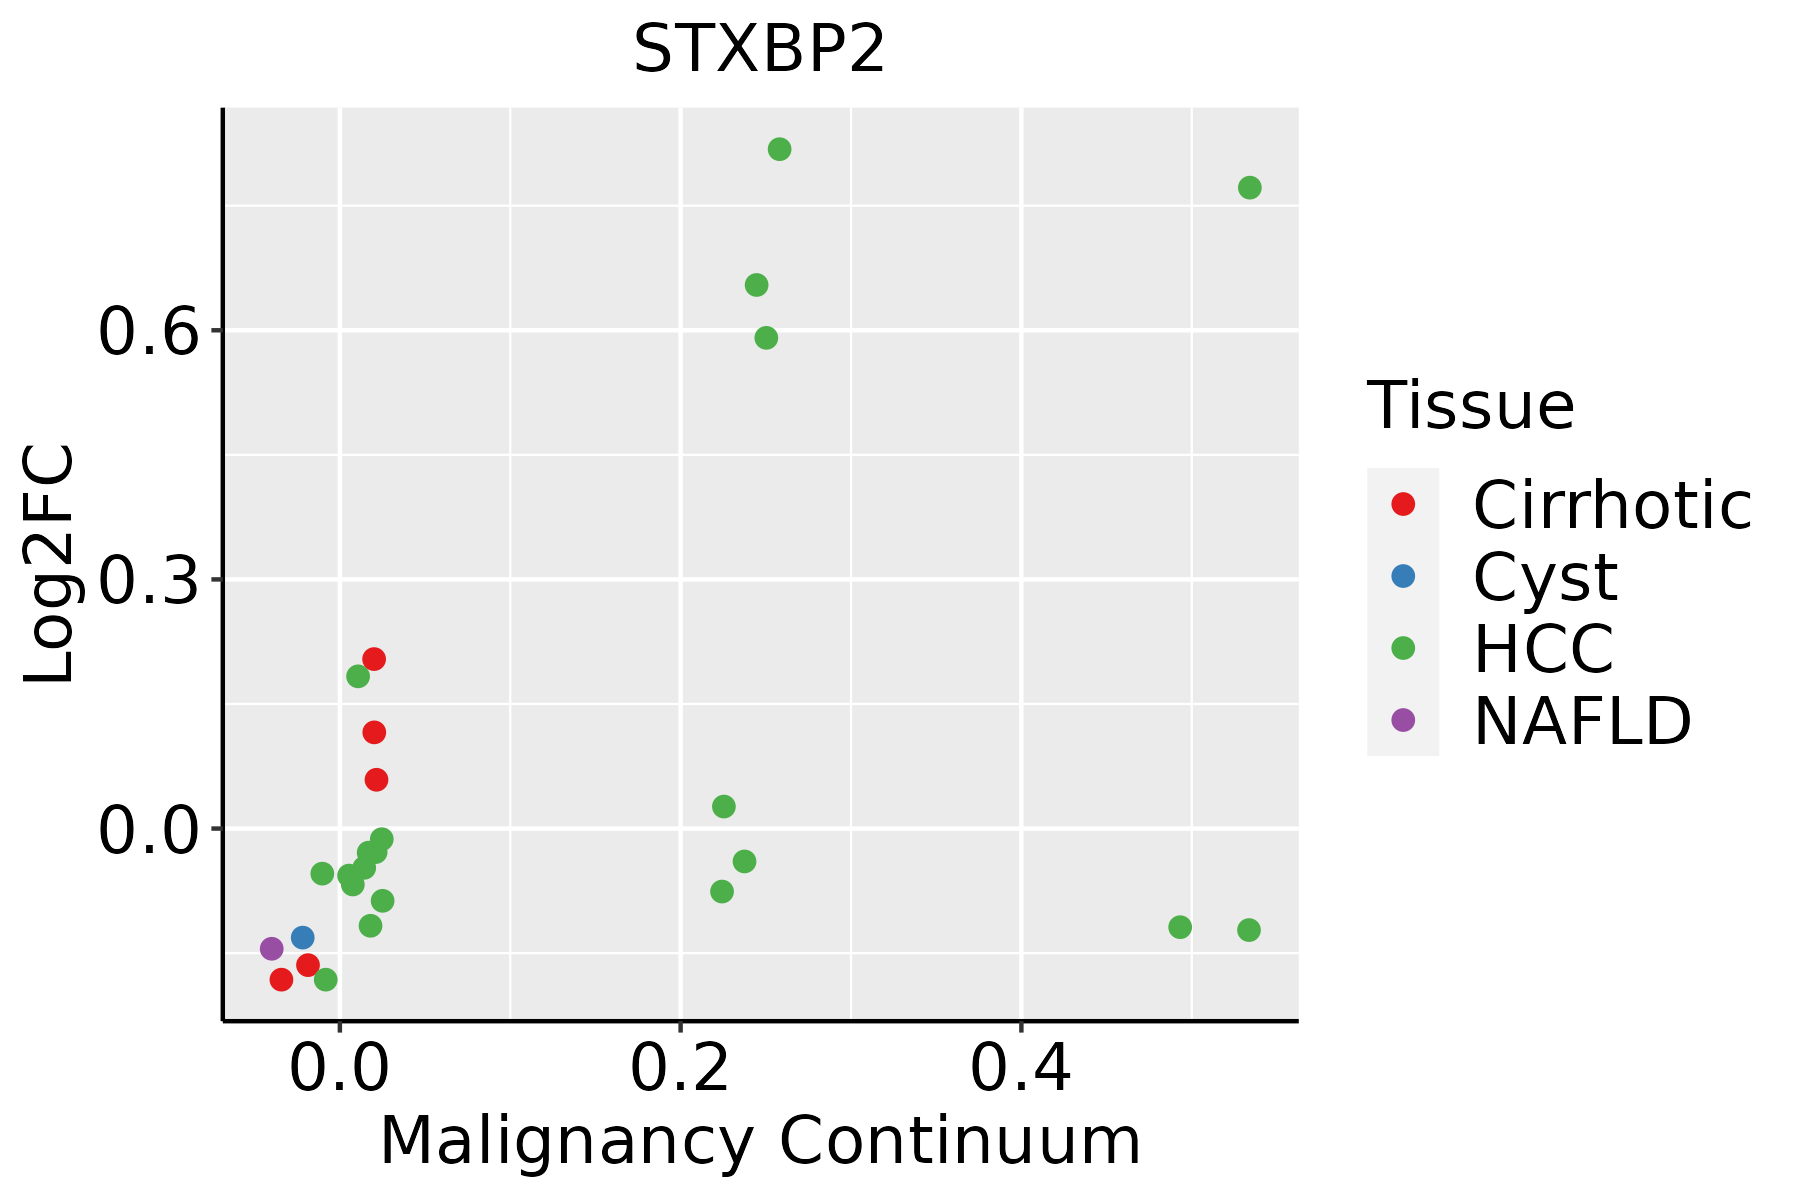 | HCC: Hepatocellular carcinoma |
| NAFLD: Non-alcoholic fatty liver disease | ||
| Oral Cavity | 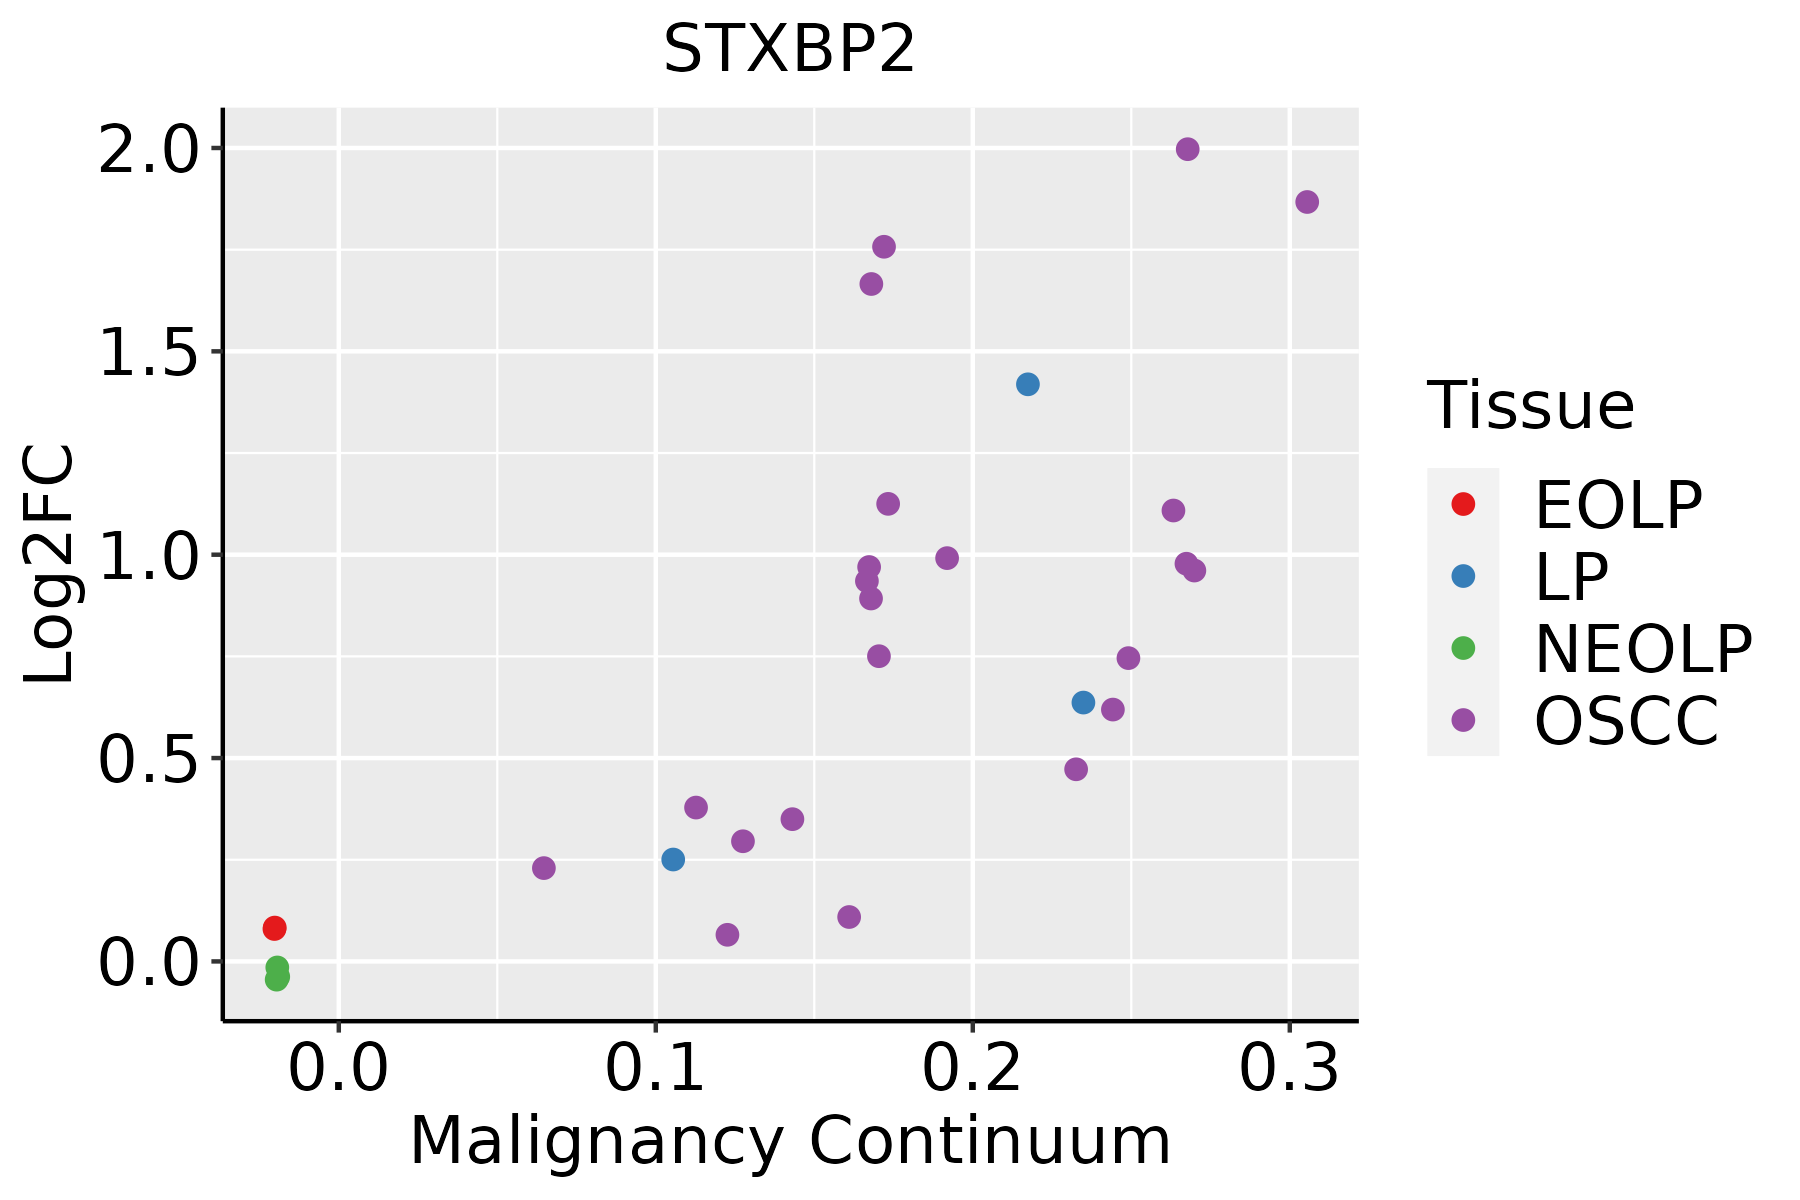 | EOLP: Erosive Oral lichen planus |
| LP: leukoplakia | ||
| NEOLP: Non-erosive oral lichen planus | ||
| OSCC: Oral squamous cell carcinoma | ||
| Prostate | 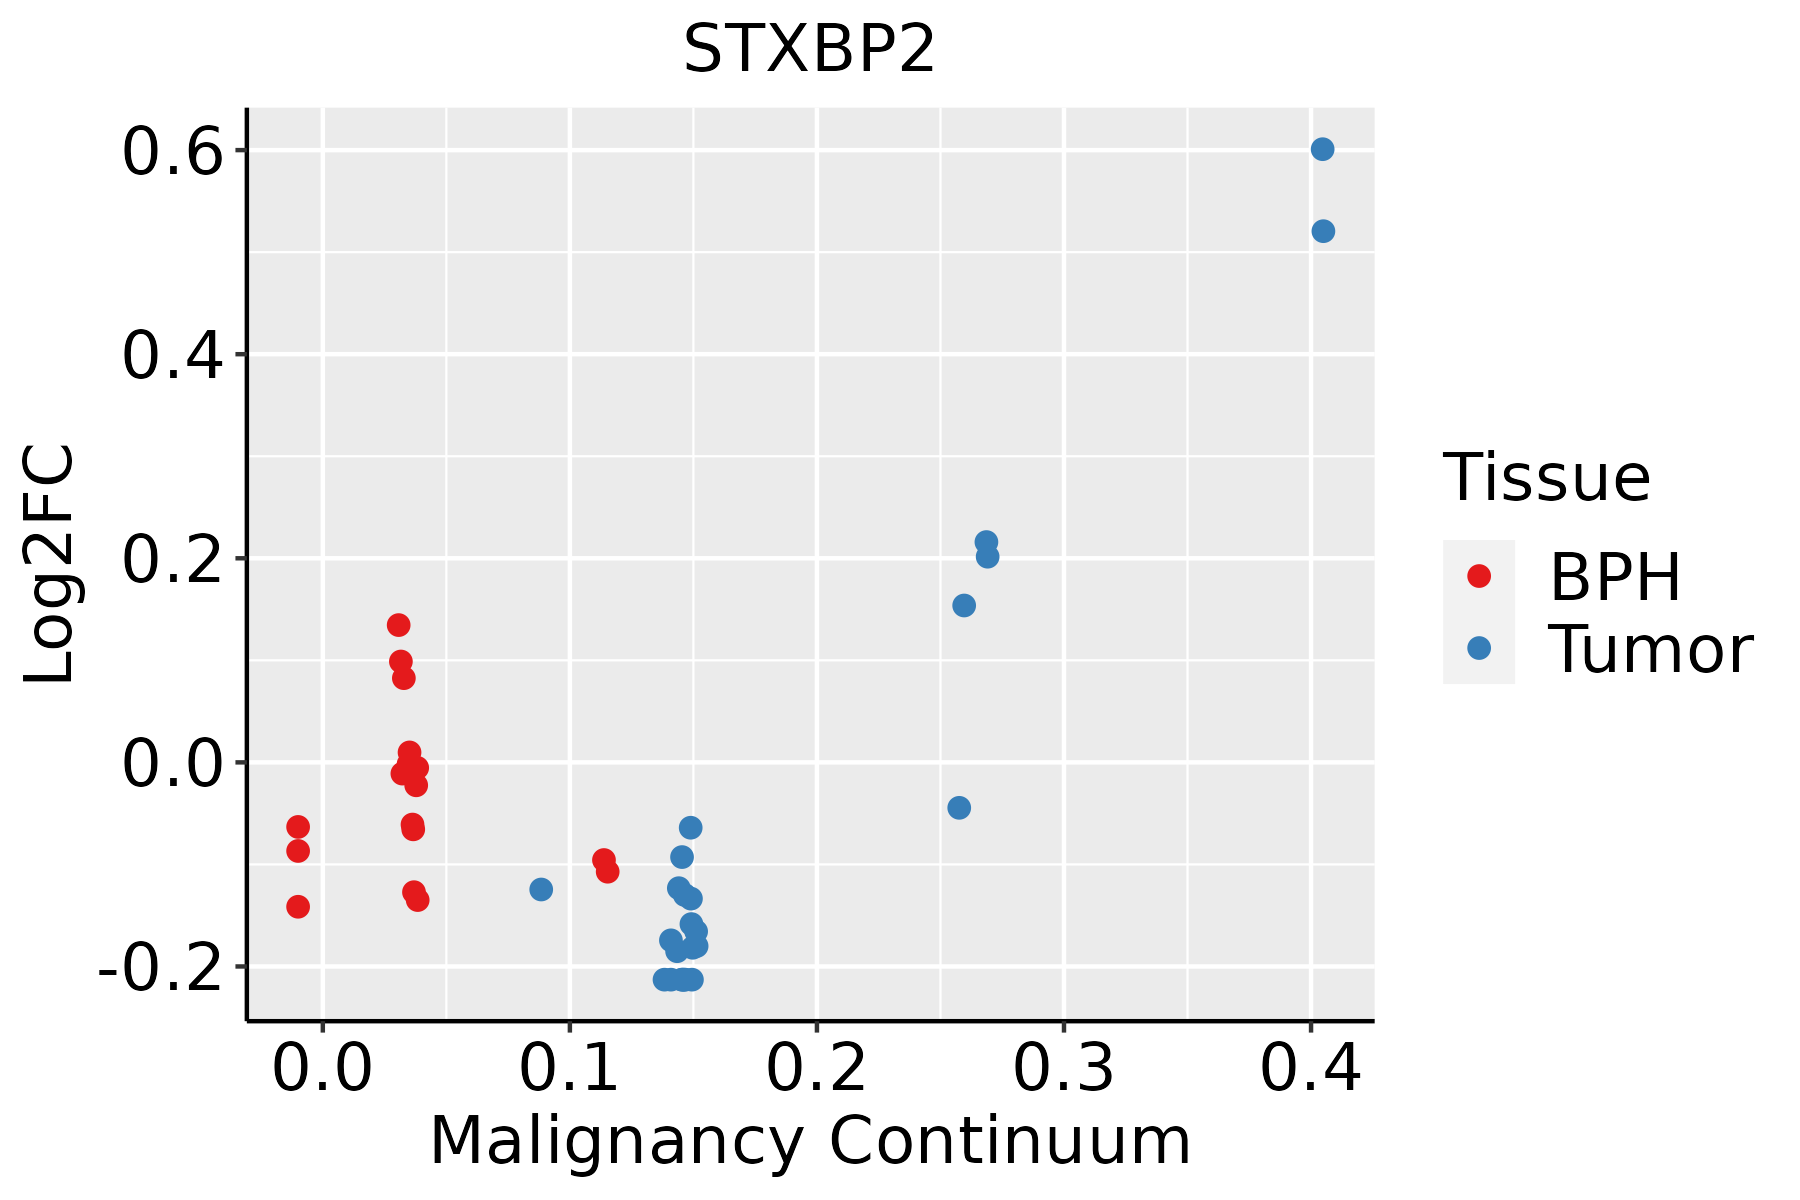 | BPH: Benign Prostatic Hyperplasia |
| Skin | 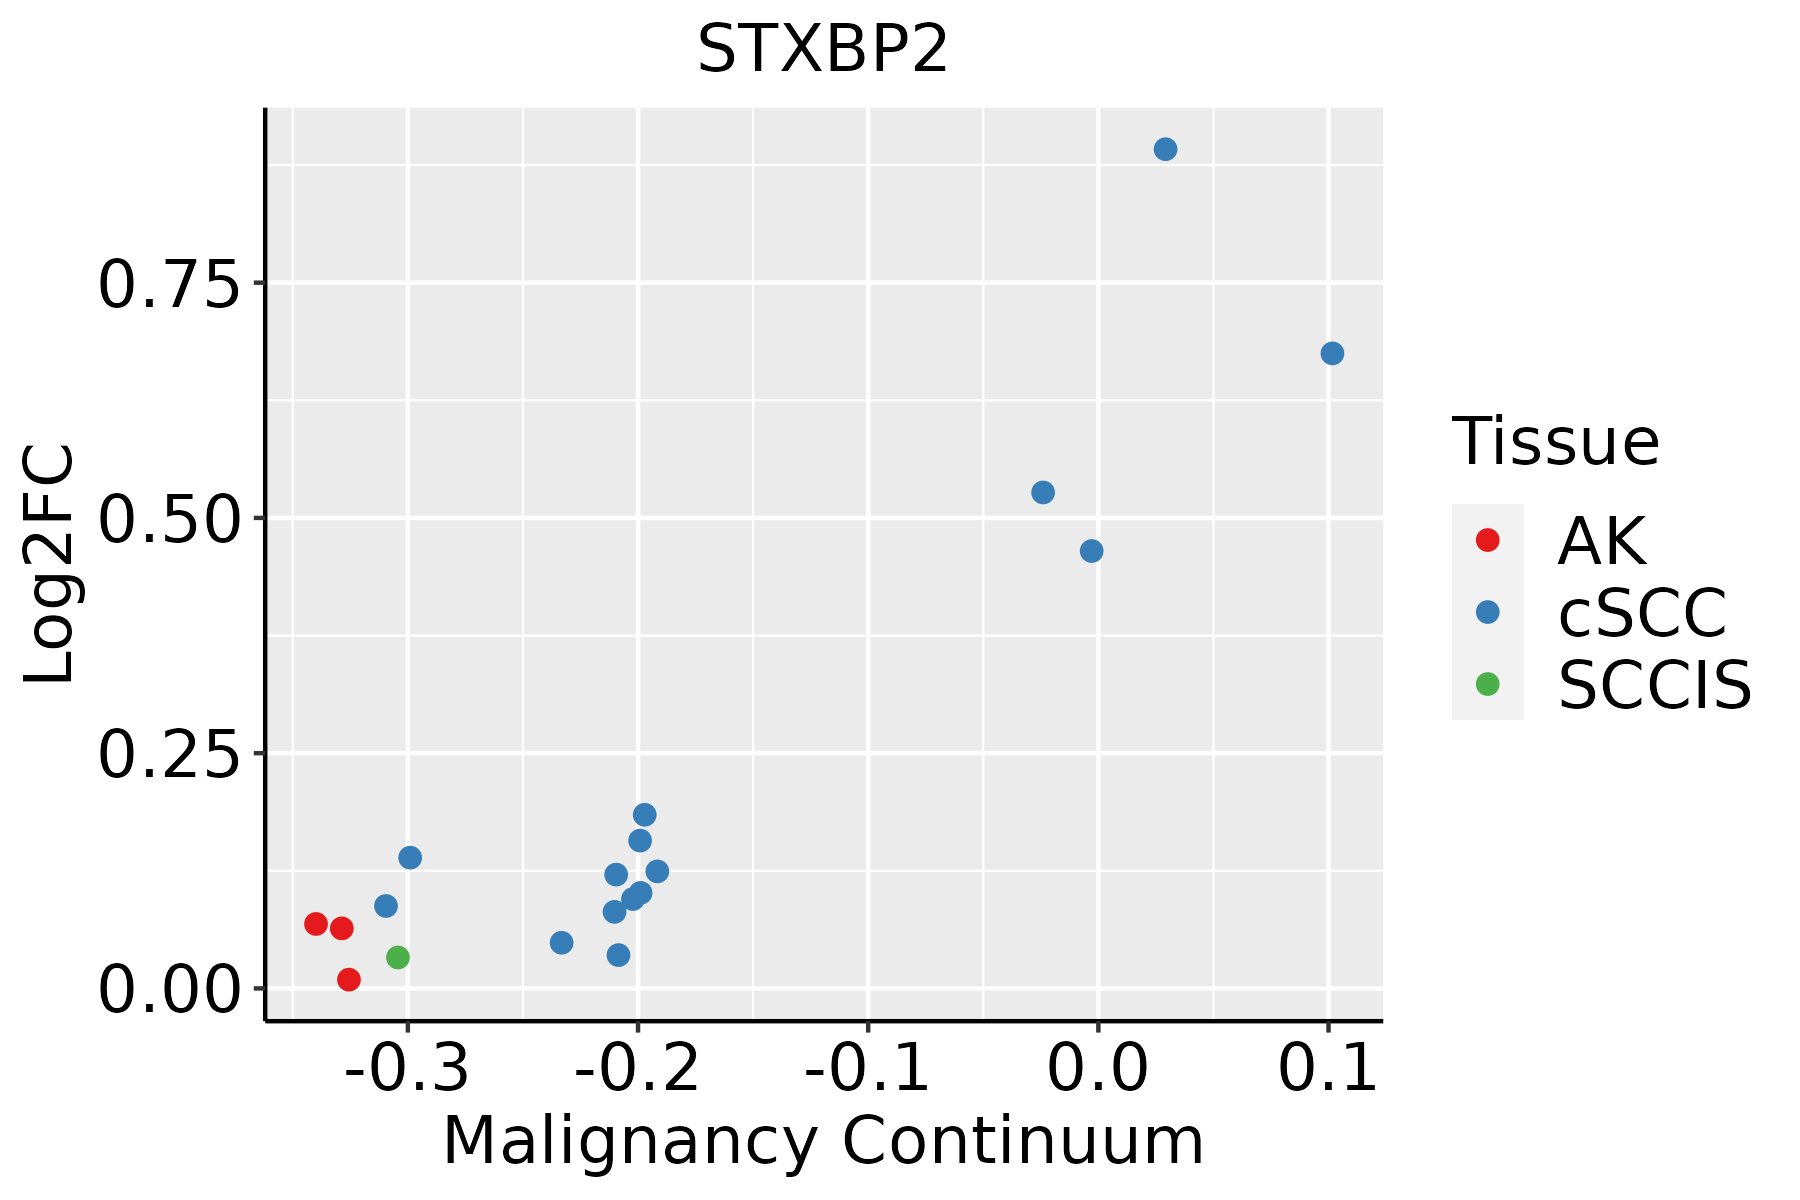 | AK: Actinic keratosis |
| cSCC: Cutaneous squamous cell carcinoma | ||
| SCCIS:squamous cell carcinoma in situ | ||
| Thyroid | 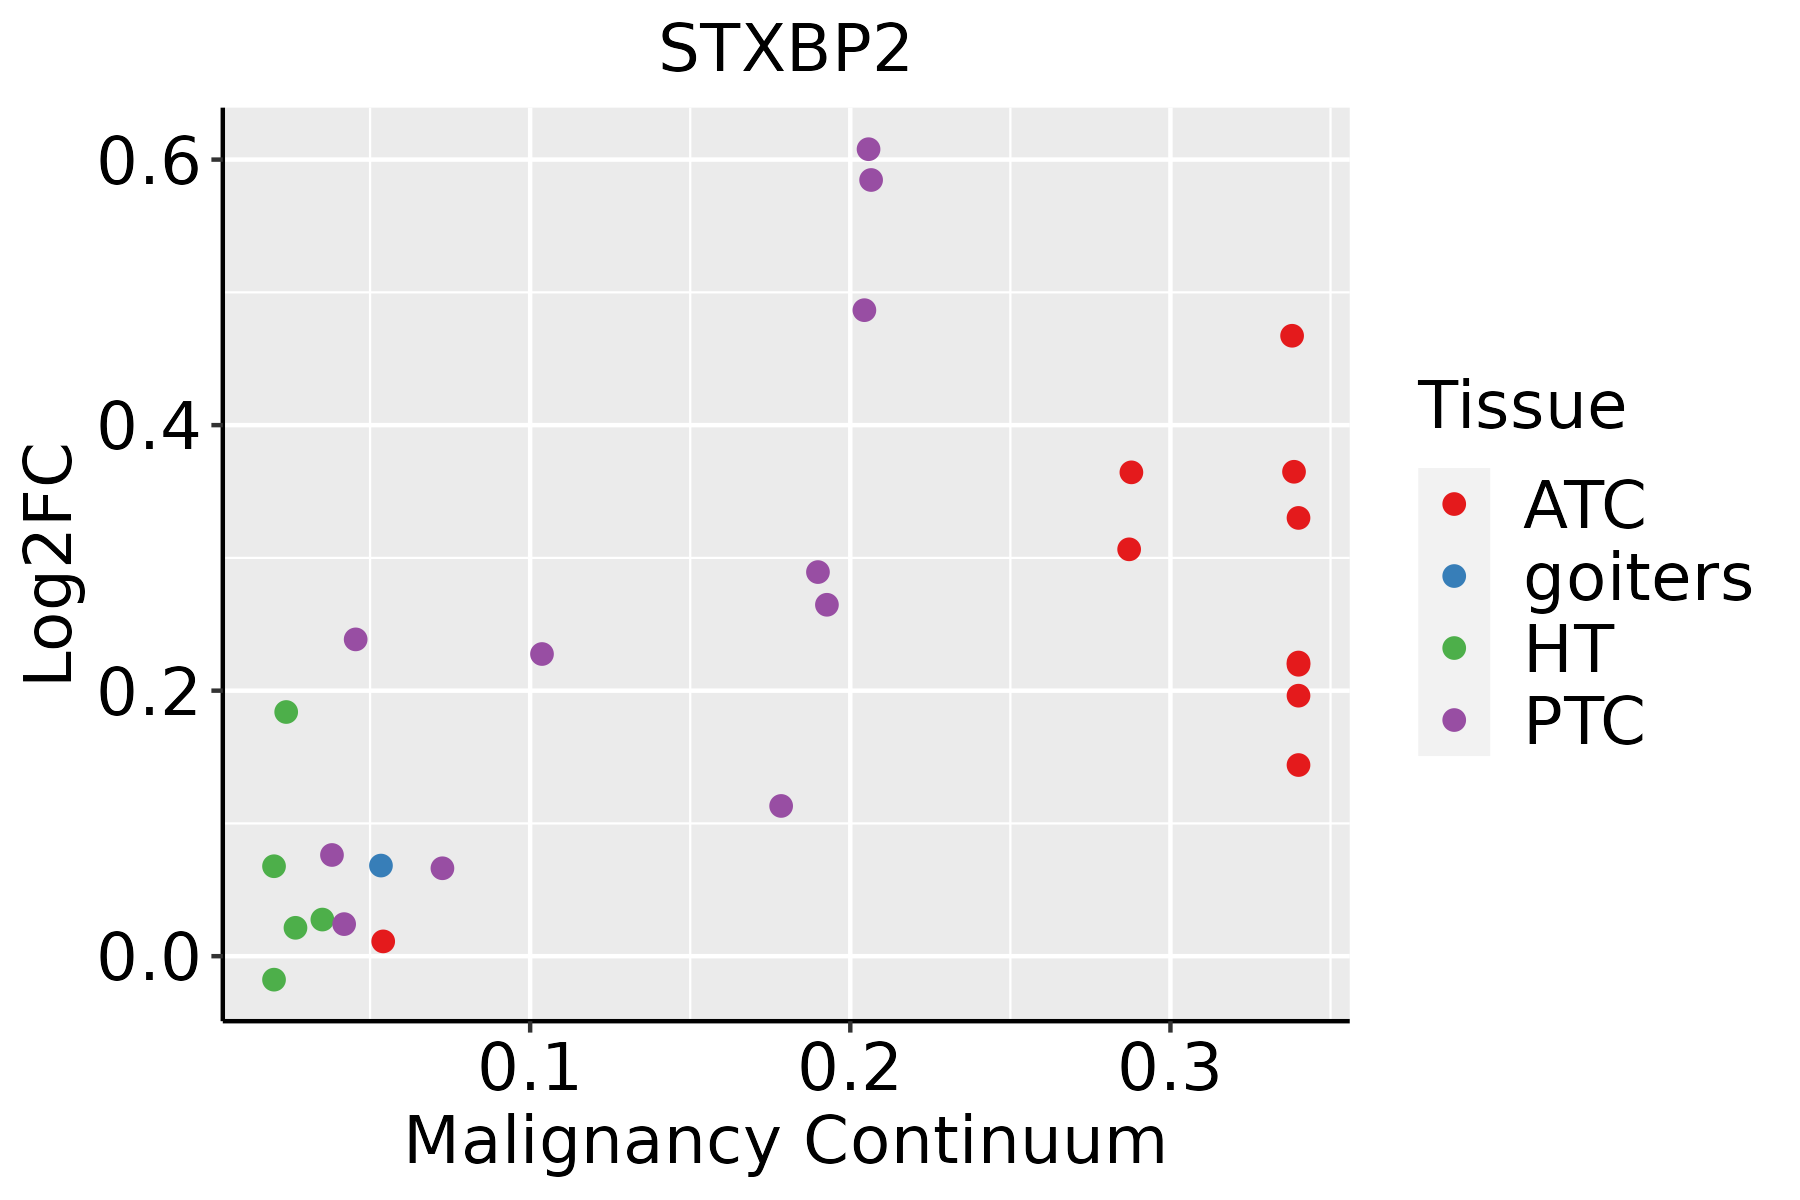 | ATC: Anaplastic thyroid cancer |
| HT: Hashimoto's thyroiditis | ||
| PTC: Papillary thyroid cancer |
| ∗log2FC in expression of this searched gene in stem-like cells from each diseased tissue sample relative to stem-like cells in normal samples in each tissue plotted against the malignancy continuum. Samples are colored based on if they are from different disease stage. |
Top |
Malignant transformation related pathway analysis |
| Find out the enriched GO biological processes and KEGG pathways involved in transition from healthy to precancer to cancer |
| Tissue | Disease Stage | Enriched GO biological Processes |
| Colorectum | AD |  |
| Colorectum | SER |  |
| Colorectum | MSS |  |
| Colorectum | MSI-H |  |
| Colorectum | FAP |  |
| ∗Top 15 enriched GO BP terms are showed in the bar plot of each disease state in each tissue. Each row represents a significant GO biological process which is colored according to the -log10(p.adjust). |
| Page: 1 2 3 4 5 6 7 8 9 |
| GO ID | Tissue | Disease Stage | Description | Gene Ratio | Bg Ratio | pvalue | p.adjust | Count |
| GO:0051656 | Colorectum | AD | establishment of organelle localization | 131/3918 | 390/18723 | 3.00e-09 | 2.06e-07 | 131 |
| GO:0022406 | Colorectum | AD | membrane docking | 31/3918 | 86/18723 | 8.67e-04 | 8.45e-03 | 31 |
| GO:0140056 | Colorectum | AD | organelle localization by membrane tethering | 28/3918 | 77/18723 | 1.29e-03 | 1.14e-02 | 28 |
| GO:0006887 | Colorectum | AD | exocytosis | 96/3918 | 352/18723 | 2.48e-03 | 1.90e-02 | 96 |
| GO:0017157 | Colorectum | AD | regulation of exocytosis | 59/3918 | 202/18723 | 3.20e-03 | 2.36e-02 | 59 |
| GO:00516561 | Colorectum | SER | establishment of organelle localization | 100/2897 | 390/18723 | 1.11e-07 | 6.79e-06 | 100 |
| GO:00224061 | Colorectum | SER | membrane docking | 25/2897 | 86/18723 | 9.88e-04 | 1.17e-02 | 25 |
| GO:00068871 | Colorectum | SER | exocytosis | 75/2897 | 352/18723 | 2.05e-03 | 2.03e-02 | 75 |
| GO:01400561 | Colorectum | SER | organelle localization by membrane tethering | 22/2897 | 77/18723 | 2.46e-03 | 2.32e-02 | 22 |
| GO:00171571 | Colorectum | SER | regulation of exocytosis | 45/2897 | 202/18723 | 6.46e-03 | 4.63e-02 | 45 |
| GO:005165616 | Esophagus | HGIN | establishment of organelle localization | 90/2587 | 390/18723 | 4.27e-07 | 1.94e-05 | 90 |
| GO:005165617 | Esophagus | ESCC | establishment of organelle localization | 273/8552 | 390/18723 | 9.13e-23 | 1.81e-20 | 273 |
| GO:00224069 | Esophagus | ESCC | membrane docking | 62/8552 | 86/18723 | 5.93e-07 | 7.79e-06 | 62 |
| GO:01400567 | Esophagus | ESCC | organelle localization by membrane tethering | 53/8552 | 77/18723 | 3.33e-05 | 2.74e-04 | 53 |
| GO:00482781 | Esophagus | ESCC | vesicle docking | 38/8552 | 59/18723 | 2.86e-03 | 1.21e-02 | 38 |
| GO:00224065 | Liver | Cirrhotic | membrane docking | 39/4634 | 86/18723 | 2.47e-05 | 3.22e-04 | 39 |
| GO:005165611 | Liver | Cirrhotic | establishment of organelle localization | 128/4634 | 390/18723 | 1.78e-04 | 1.67e-03 | 128 |
| GO:01400565 | Liver | Cirrhotic | organelle localization by membrane tethering | 32/4634 | 77/18723 | 8.65e-04 | 6.23e-03 | 32 |
| GO:005165621 | Liver | HCC | establishment of organelle localization | 226/7958 | 390/18723 | 4.15e-10 | 1.34e-08 | 226 |
| GO:002240611 | Liver | HCC | membrane docking | 57/7958 | 86/18723 | 7.14e-06 | 8.47e-05 | 57 |
| Page: 1 2 3 |
| Pathway ID | Tissue | Disease Stage | Description | Gene Ratio | Bg Ratio | pvalue | p.adjust | qvalue | Count |
| Page: 1 |
Top |
Cell-cell communication analysis |
| Identification of potential cell-cell interactions between two cell types and their ligand-receptor pairs for different disease states |
| Ligand | Receptor | LRpair | Pathway | Tissue | Disease Stage |
| Page: 1 |
Top |
Single-cell gene regulatory network inference analysis |
| Find out the significant the regulons (TFs) and the target genes of each regulon across cell types for different disease states |
| TF | Cell Type | Tissue | Disease Stage | Target Gene | RSS | Regulon Activity |
| ∗The dot plots of a searched regulon are shown for all cell subpopulations in each disease state of each tissue based on the regulon specific score inferred using pySCENIC and by calculating the average expression. |
| Page: 1 |
Top |
Somatic mutation of malignant transformation related genes |
| Annotation of somatic variants for genes involved in malignant transformation |
| Hugo Symbol | Variant Class | Variant Classification | dbSNP RS | HGVSc | HGVSp | HGVSp Short | SWISSPROT | BIOTYPE | SIFT | PolyPhen | Tumor Sample Barcode | Tissue | Histology | Sex | Age | Stage | Therapy Types | Drugs | Outcome |
| STXBP2 | SNV | Missense_Mutation | novel | c.1157N>T | p.Ser386Phe | p.S386F | Q15833 | protein_coding | deleterious(0.04) | benign(0.035) | TCGA-5L-AAT1-01 | Breast | breast invasive carcinoma | Female | <65 | III/IV | Hormone Therapy | letrozol | SD |
| STXBP2 | SNV | Missense_Mutation | c.1633C>T | p.Leu545Phe | p.L545F | Q15833 | protein_coding | deleterious(0.01) | probably_damaging(0.961) | TCGA-AN-A0XR-01 | Breast | breast invasive carcinoma | Female | <65 | III/IV | Unknown | Unknown | SD | |
| STXBP2 | SNV | Missense_Mutation | c.245N>C | p.Lys82Thr | p.K82T | Q15833 | protein_coding | deleterious(0.02) | benign(0.178) | TCGA-BH-A0DG-01 | Breast | breast invasive carcinoma | Female | <65 | I/II | Chemotherapy | taxotere | CR | |
| STXBP2 | SNV | Missense_Mutation | c.1017N>C | p.Gln339His | p.Q339H | Q15833 | protein_coding | tolerated(0.18) | benign(0.018) | TCGA-E2-A1LH-01 | Breast | breast invasive carcinoma | Female | <65 | I/II | Chemotherapy | adriamycin | SD | |
| STXBP2 | deletion | Frame_Shift_Del | c.1167delN | p.Glu391ArgfsTer7 | p.E391Rfs*7 | Q15833 | protein_coding | TCGA-AN-A0AK-01 | Breast | breast invasive carcinoma | Female | >=65 | I/II | Unknown | Unknown | SD | |||
| STXBP2 | SNV | Missense_Mutation | c.1191G>A | p.Met397Ile | p.M397I | Q15833 | protein_coding | deleterious(0.04) | possibly_damaging(0.734) | TCGA-EK-A2RK-01 | Cervix | cervical & endocervical cancer | Female | >=65 | I/II | Unknown | Unknown | SD | |
| STXBP2 | SNV | Missense_Mutation | c.337N>A | p.Ala113Thr | p.A113T | Q15833 | protein_coding | deleterious(0) | probably_damaging(0.997) | TCGA-A6-5661-01 | Colorectum | colon adenocarcinoma | Female | >=65 | I/II | Unknown | Unknown | SD | |
| STXBP2 | SNV | Missense_Mutation | c.1665N>A | p.Met555Ile | p.M555I | Q15833 | protein_coding | deleterious(0.01) | benign(0.102) | TCGA-AA-3492-01 | Colorectum | colon adenocarcinoma | Female | >=65 | I/II | Unknown | Unknown | SD | |
| STXBP2 | SNV | Missense_Mutation | c.296N>C | p.Ile99Thr | p.I99T | Q15833 | protein_coding | deleterious(0) | probably_damaging(0.987) | TCGA-G4-6628-01 | Colorectum | colon adenocarcinoma | Male | >=65 | I/II | Unknown | Unknown | SD | |
| STXBP2 | SNV | Missense_Mutation | rs767497356 | c.355N>A | p.Asp119Asn | p.D119N | Q15833 | protein_coding | deleterious(0) | probably_damaging(0.979) | TCGA-AG-A002-01 | Colorectum | rectum adenocarcinoma | Male | <65 | I/II | Unknown | Unknown | SD |
| Page: 1 2 3 4 5 |
Top |
Related drugs of malignant transformation related genes |
| Identification of chemicals and drugs interact with genes involved in malignant transfromation |
| (DGIdb 4.0) |
| Entrez ID | Symbol | Category | Interaction Types | Drug Claim Name | Drug Name | PMIDs |
| 6813 | STXBP2 | NA | emapalumab | EMAPALUMAB | ||
| 6813 | STXBP2 | NA | Emapalumab-lzsg | EMAPALUMAB |
| Page: 1 |

Copyright 2023-Present -The University of Texas Health Science Center at Houston |