
|
|||||
|
 | |
| |
| |
| |
| |
| |
|
Gene: STX7 |
Gene summary for STX7 |
| Gene information | Species | Human | Gene symbol | STX7 | Gene ID | 8417 |
| Gene name | syntaxin 7 | |
| Gene Alias | STX7 | |
| Cytomap | 6q23.2 | |
| Gene Type | protein-coding | GO ID | GO:0001906 | UniProtAcc | O15400 |
Top |
Malignant transformation analysis |
| Identification of the aberrant gene expression in precancerous and cancerous lesions by comparing the gene expression of stem-like cells in diseased tissues with normal stem cells |
| Entrez ID | Symbol | Replicates | Species | Organ | Tissue | Adj P-value | Log2FC | Malignancy |
| 8417 | STX7 | LZE4T | Human | Esophagus | ESCC | 6.52e-11 | 2.19e-01 | 0.0811 |
| 8417 | STX7 | LZE7T | Human | Esophagus | ESCC | 2.38e-05 | 1.49e-01 | 0.0667 |
| 8417 | STX7 | LZE20T | Human | Esophagus | ESCC | 3.28e-02 | 1.88e-02 | 0.0662 |
| 8417 | STX7 | LZE24T | Human | Esophagus | ESCC | 2.44e-12 | 3.72e-01 | 0.0596 |
| 8417 | STX7 | LZE21T | Human | Esophagus | ESCC | 4.54e-02 | 1.19e-01 | 0.0655 |
| 8417 | STX7 | LZE6T | Human | Esophagus | ESCC | 3.63e-03 | 8.53e-02 | 0.0845 |
| 8417 | STX7 | P1T-E | Human | Esophagus | ESCC | 1.98e-14 | 3.76e-01 | 0.0875 |
| 8417 | STX7 | P2T-E | Human | Esophagus | ESCC | 3.63e-24 | 3.40e-01 | 0.1177 |
| 8417 | STX7 | P4T-E | Human | Esophagus | ESCC | 1.32e-27 | 5.00e-01 | 0.1323 |
| 8417 | STX7 | P5T-E | Human | Esophagus | ESCC | 3.47e-21 | 3.98e-01 | 0.1327 |
| 8417 | STX7 | P8T-E | Human | Esophagus | ESCC | 1.75e-25 | 4.21e-01 | 0.0889 |
| 8417 | STX7 | P9T-E | Human | Esophagus | ESCC | 3.92e-05 | 1.37e-01 | 0.1131 |
| 8417 | STX7 | P10T-E | Human | Esophagus | ESCC | 1.85e-19 | 2.61e-01 | 0.116 |
| 8417 | STX7 | P11T-E | Human | Esophagus | ESCC | 6.11e-09 | 3.19e-01 | 0.1426 |
| 8417 | STX7 | P12T-E | Human | Esophagus | ESCC | 2.94e-19 | 3.26e-01 | 0.1122 |
| 8417 | STX7 | P15T-E | Human | Esophagus | ESCC | 1.18e-12 | 3.42e-01 | 0.1149 |
| 8417 | STX7 | P16T-E | Human | Esophagus | ESCC | 3.62e-18 | 4.36e-01 | 0.1153 |
| 8417 | STX7 | P17T-E | Human | Esophagus | ESCC | 1.01e-07 | 3.48e-01 | 0.1278 |
| 8417 | STX7 | P19T-E | Human | Esophagus | ESCC | 8.93e-06 | 8.26e-01 | 0.1662 |
| 8417 | STX7 | P20T-E | Human | Esophagus | ESCC | 5.19e-18 | 3.44e-01 | 0.1124 |
| Page: 1 2 3 4 5 6 |
| Tissue | Expression Dynamics | Abbreviation |
| Esophagus | 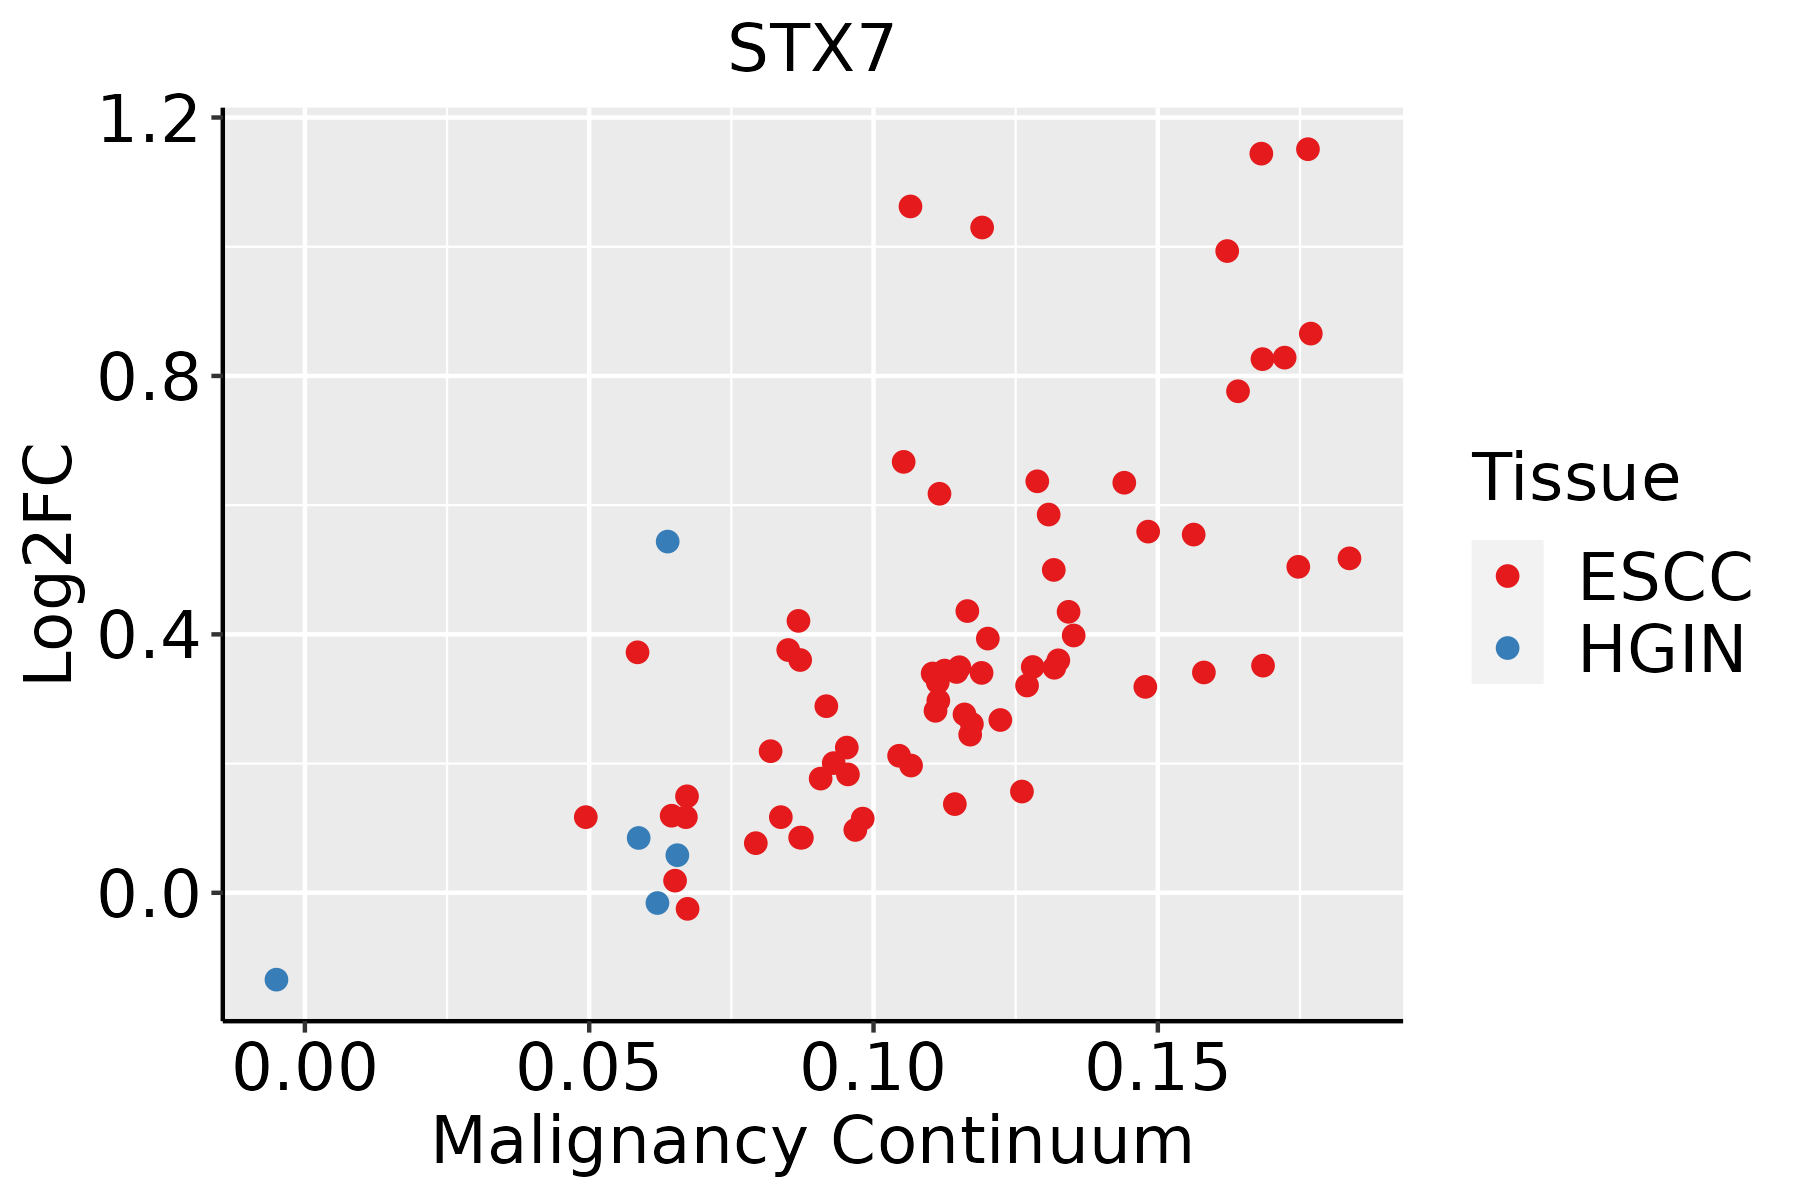 | ESCC: Esophageal squamous cell carcinoma |
| HGIN: High-grade intraepithelial neoplasias | ||
| LGIN: Low-grade intraepithelial neoplasias | ||
| Liver |  | HCC: Hepatocellular carcinoma |
| NAFLD: Non-alcoholic fatty liver disease | ||
| Oral Cavity | 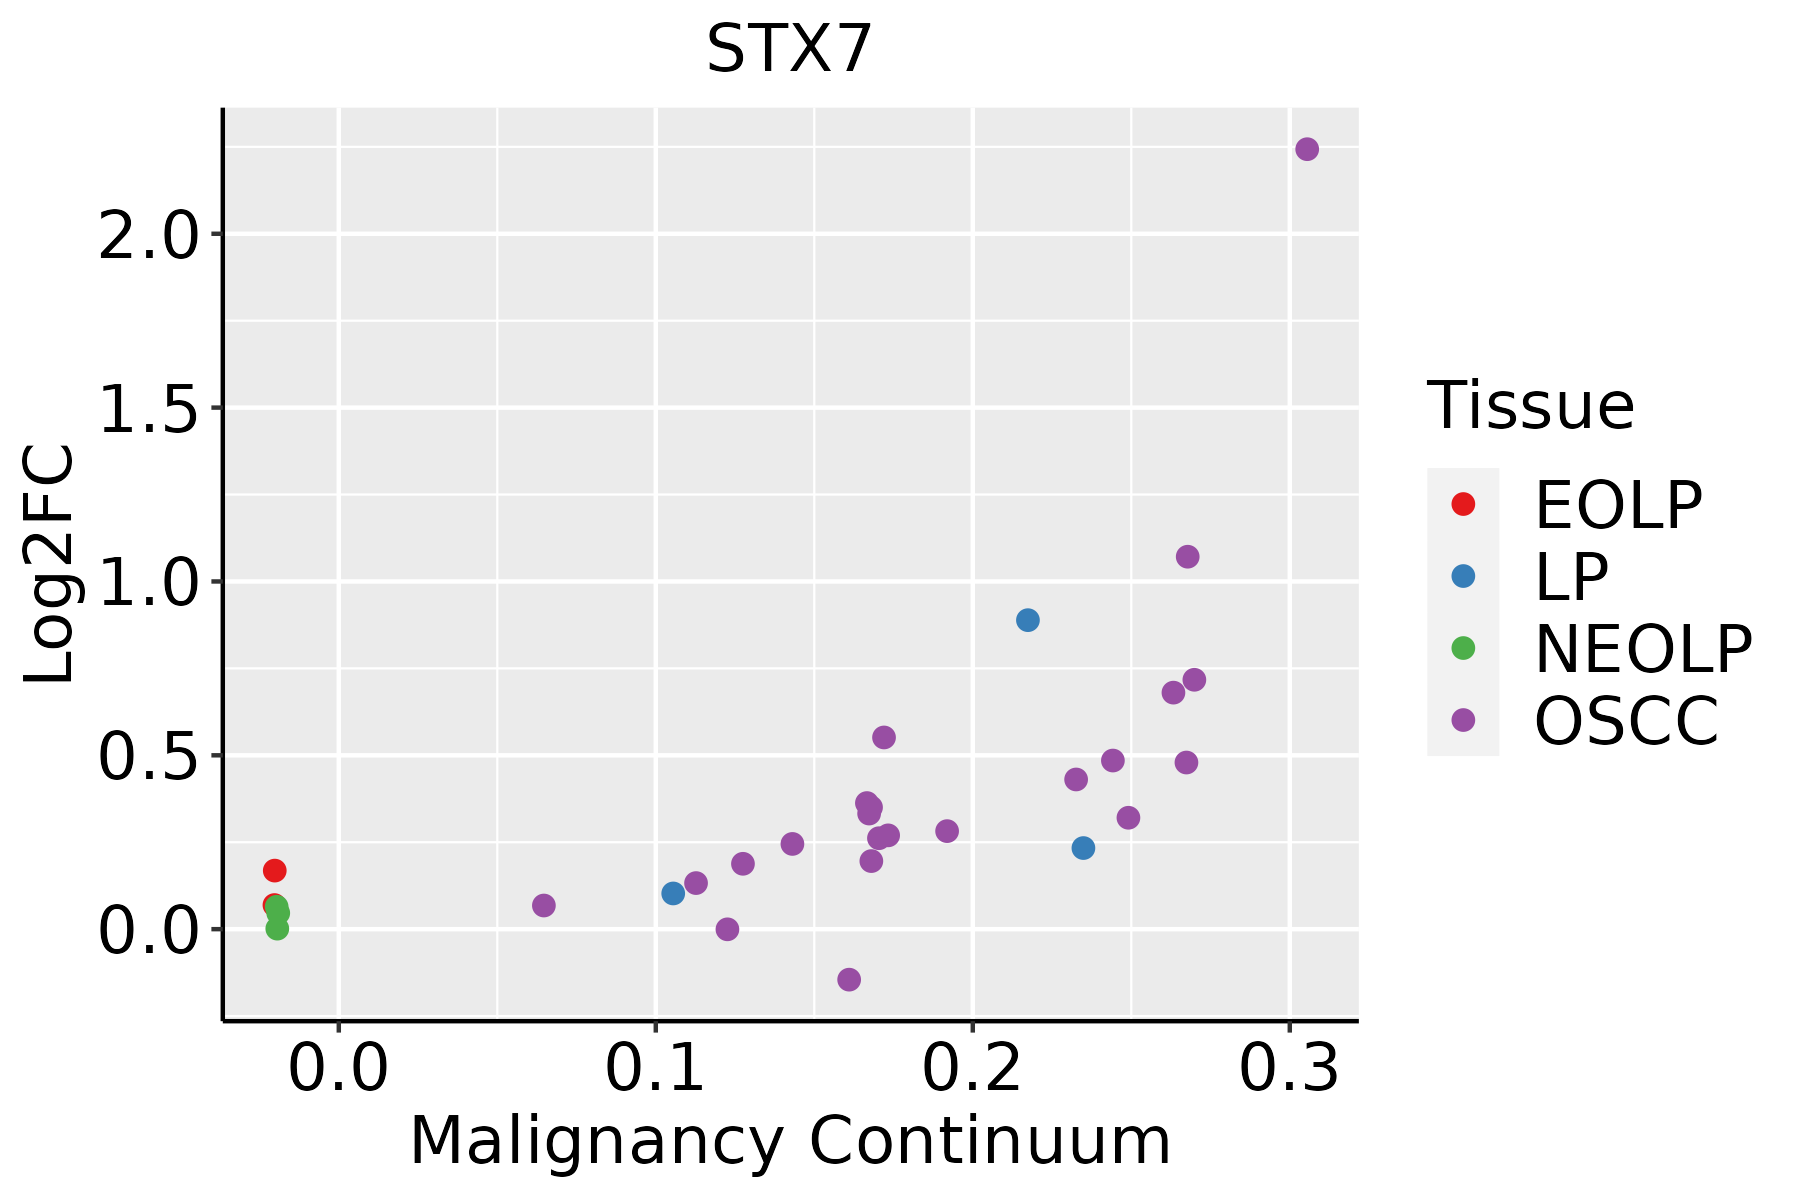 | EOLP: Erosive Oral lichen planus |
| LP: leukoplakia | ||
| NEOLP: Non-erosive oral lichen planus | ||
| OSCC: Oral squamous cell carcinoma | ||
| Skin | 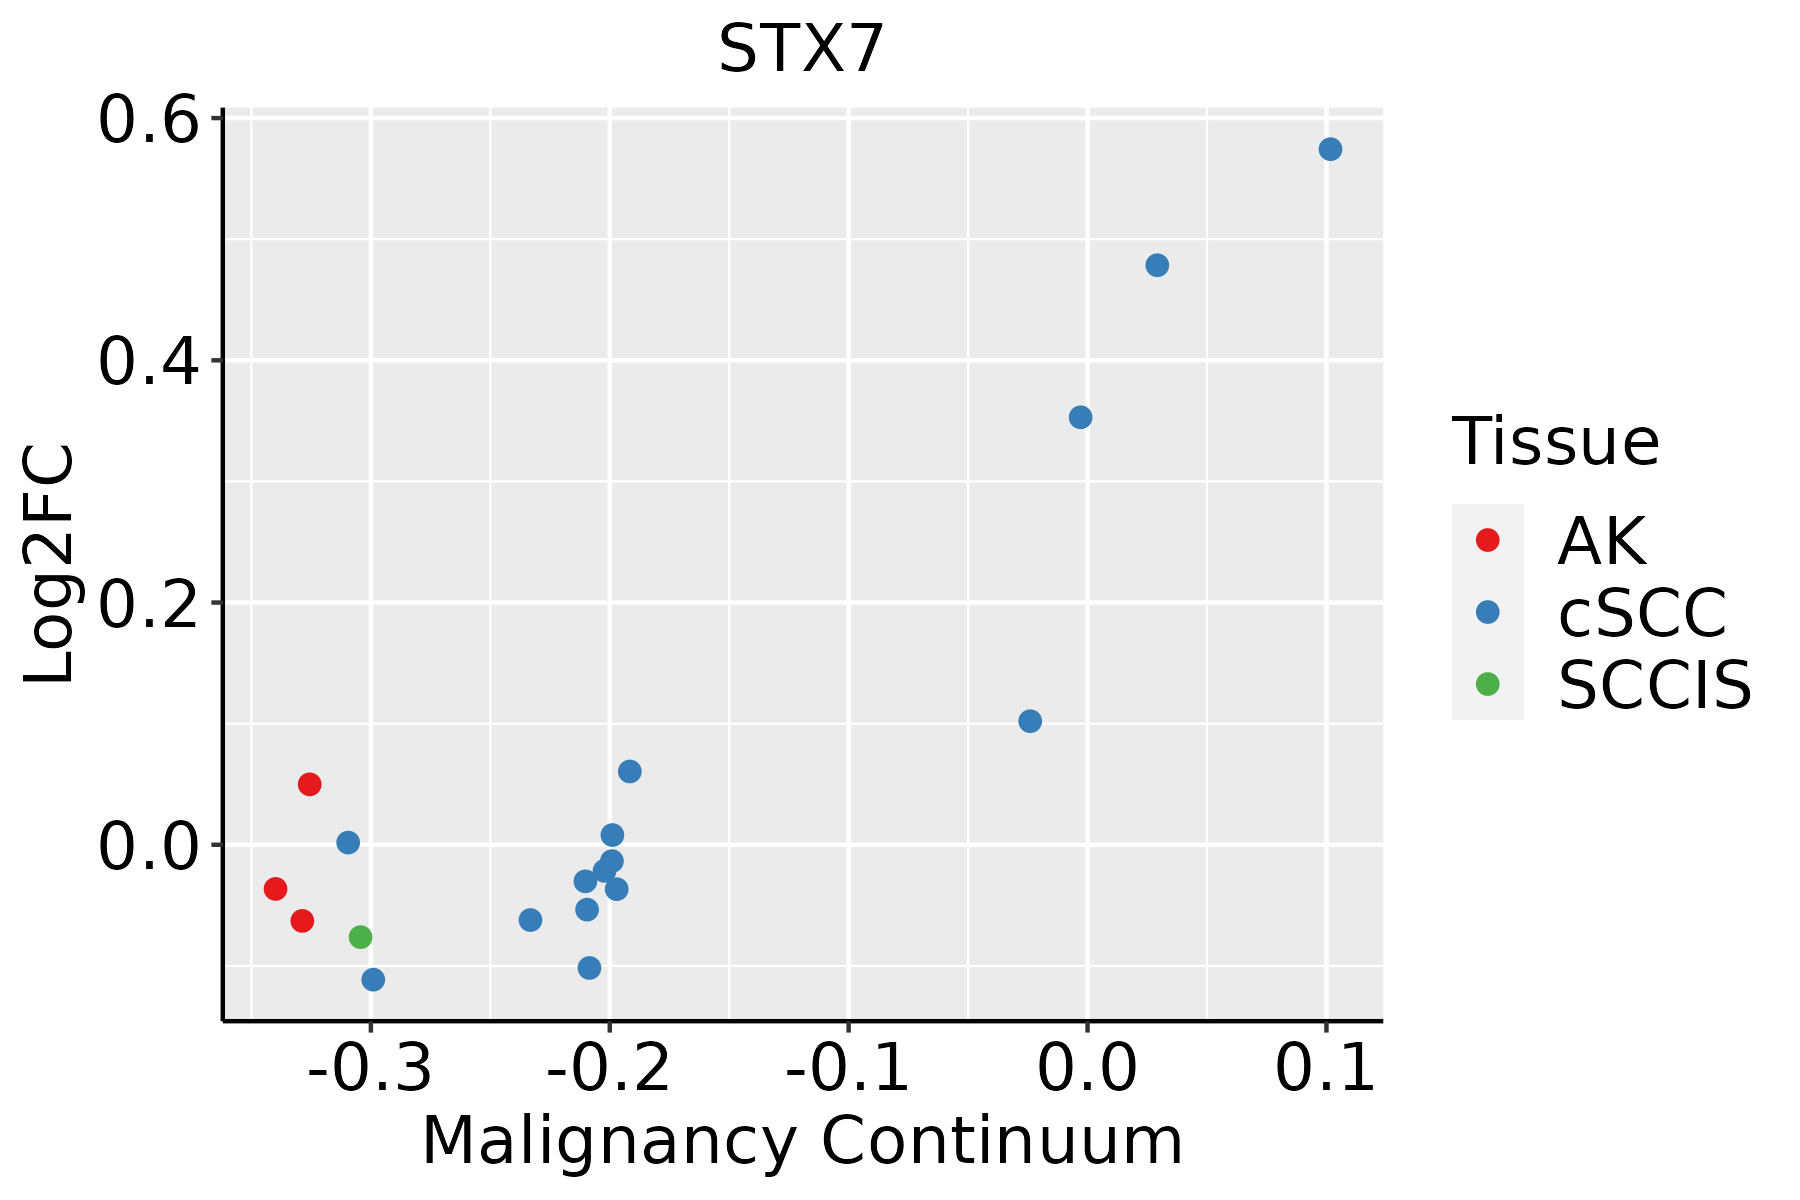 | AK: Actinic keratosis |
| cSCC: Cutaneous squamous cell carcinoma | ||
| SCCIS:squamous cell carcinoma in situ | ||
| Thyroid |  | ATC: Anaplastic thyroid cancer |
| HT: Hashimoto's thyroiditis | ||
| PTC: Papillary thyroid cancer |
| ∗log2FC in expression of this searched gene in stem-like cells from each diseased tissue sample relative to stem-like cells in normal samples in each tissue plotted against the malignancy continuum. Samples are colored based on if they are from different disease stage. |
Top |
Malignant transformation related pathway analysis |
| Find out the enriched GO biological processes and KEGG pathways involved in transition from healthy to precancer to cancer |
| Tissue | Disease Stage | Enriched GO biological Processes |
| Colorectum | AD |  |
| Colorectum | SER |  |
| Colorectum | MSS |  |
| Colorectum | MSI-H |  |
| Colorectum | FAP |  |
| ∗Top 15 enriched GO BP terms are showed in the bar plot of each disease state in each tissue. Each row represents a significant GO biological process which is colored according to the -log10(p.adjust). |
| Page: 1 2 3 4 5 6 7 8 9 |
| GO ID | Tissue | Disease Stage | Description | Gene Ratio | Bg Ratio | pvalue | p.adjust | Count |
| GO:001605014 | Esophagus | ESCC | vesicle organization | 211/8552 | 300/18723 | 2.85e-18 | 2.87e-16 | 211 |
| GO:0072659110 | Esophagus | ESCC | protein localization to plasma membrane | 193/8552 | 284/18723 | 1.95e-14 | 1.03e-12 | 193 |
| GO:199077819 | Esophagus | ESCC | protein localization to cell periphery | 217/8552 | 333/18723 | 4.08e-13 | 1.88e-11 | 217 |
| GO:190547519 | Esophagus | ESCC | regulation of protein localization to membrane | 117/8552 | 175/18723 | 1.14e-08 | 2.26e-07 | 117 |
| GO:003150314 | Esophagus | ESCC | protein-containing complex localization | 139/8552 | 220/18723 | 1.14e-07 | 1.85e-06 | 139 |
| GO:190437519 | Esophagus | ESCC | regulation of protein localization to cell periphery | 85/8552 | 125/18723 | 3.63e-07 | 5.06e-06 | 85 |
| GO:00482844 | Esophagus | ESCC | organelle fusion | 94/8552 | 141/18723 | 3.72e-07 | 5.16e-06 | 94 |
| GO:00224069 | Esophagus | ESCC | membrane docking | 62/8552 | 86/18723 | 5.93e-07 | 7.79e-06 | 62 |
| GO:1903076110 | Esophagus | ESCC | regulation of protein localization to plasma membrane | 72/8552 | 104/18723 | 9.74e-07 | 1.23e-05 | 72 |
| GO:00901743 | Esophagus | ESCC | organelle membrane fusion | 73/8552 | 110/18723 | 9.29e-06 | 8.88e-05 | 73 |
| GO:00069063 | Esophagus | ESCC | vesicle fusion | 70/8552 | 106/18723 | 1.82e-05 | 1.60e-04 | 70 |
| GO:01400567 | Esophagus | ESCC | organelle localization by membrane tethering | 53/8552 | 77/18723 | 3.33e-05 | 2.74e-04 | 53 |
| GO:00610254 | Esophagus | ESCC | membrane fusion | 98/8552 | 163/18723 | 1.39e-04 | 9.41e-04 | 98 |
| GO:00482781 | Esophagus | ESCC | vesicle docking | 38/8552 | 59/18723 | 2.86e-03 | 1.21e-02 | 38 |
| GO:001605011 | Liver | Cirrhotic | vesicle organization | 133/4634 | 300/18723 | 7.35e-14 | 6.41e-12 | 133 |
| GO:199077811 | Liver | Cirrhotic | protein localization to cell periphery | 135/4634 | 333/18723 | 1.18e-10 | 6.21e-09 | 135 |
| GO:007265911 | Liver | Cirrhotic | protein localization to plasma membrane | 119/4634 | 284/18723 | 1.30e-10 | 6.80e-09 | 119 |
| GO:19054755 | Liver | Cirrhotic | regulation of protein localization to membrane | 76/4634 | 175/18723 | 4.55e-08 | 1.45e-06 | 76 |
| GO:190437511 | Liver | Cirrhotic | regulation of protein localization to cell periphery | 57/4634 | 125/18723 | 2.97e-07 | 7.18e-06 | 57 |
| GO:190307611 | Liver | Cirrhotic | regulation of protein localization to plasma membrane | 47/4634 | 104/18723 | 4.29e-06 | 7.15e-05 | 47 |
| Page: 1 2 3 4 5 6 |
| Pathway ID | Tissue | Disease Stage | Description | Gene Ratio | Bg Ratio | pvalue | p.adjust | qvalue | Count |
| hsa041305 | Esophagus | ESCC | SNARE interactions in vesicular transport | 28/4205 | 33/8465 | 2.75e-05 | 1.32e-04 | 6.75e-05 | 28 |
| hsa0414530 | Esophagus | ESCC | Phagosome | 100/4205 | 152/8465 | 3.81e-05 | 1.72e-04 | 8.82e-05 | 100 |
| hsa0413012 | Esophagus | ESCC | SNARE interactions in vesicular transport | 28/4205 | 33/8465 | 2.75e-05 | 1.32e-04 | 6.75e-05 | 28 |
| hsa04145114 | Esophagus | ESCC | Phagosome | 100/4205 | 152/8465 | 3.81e-05 | 1.72e-04 | 8.82e-05 | 100 |
| hsa0414514 | Liver | Cirrhotic | Phagosome | 73/2530 | 152/8465 | 1.61e-06 | 1.78e-05 | 1.10e-05 | 73 |
| hsa04130 | Liver | Cirrhotic | SNARE interactions in vesicular transport | 18/2530 | 33/8465 | 2.64e-03 | 1.10e-02 | 6.76e-03 | 18 |
| hsa0414515 | Liver | Cirrhotic | Phagosome | 73/2530 | 152/8465 | 1.61e-06 | 1.78e-05 | 1.10e-05 | 73 |
| hsa041301 | Liver | Cirrhotic | SNARE interactions in vesicular transport | 18/2530 | 33/8465 | 2.64e-03 | 1.10e-02 | 6.76e-03 | 18 |
| hsa0414521 | Liver | HCC | Phagosome | 93/4020 | 152/8465 | 4.27e-04 | 1.88e-03 | 1.05e-03 | 93 |
| hsa041302 | Liver | HCC | SNARE interactions in vesicular transport | 25/4020 | 33/8465 | 8.78e-04 | 3.38e-03 | 1.88e-03 | 25 |
| hsa0414531 | Liver | HCC | Phagosome | 93/4020 | 152/8465 | 4.27e-04 | 1.88e-03 | 1.05e-03 | 93 |
| hsa041303 | Liver | HCC | SNARE interactions in vesicular transport | 25/4020 | 33/8465 | 8.78e-04 | 3.38e-03 | 1.88e-03 | 25 |
| hsa041304 | Oral cavity | OSCC | SNARE interactions in vesicular transport | 28/3704 | 33/8465 | 1.31e-06 | 7.18e-06 | 3.66e-06 | 28 |
| hsa0414528 | Oral cavity | OSCC | Phagosome | 88/3704 | 152/8465 | 2.83e-04 | 9.13e-04 | 4.65e-04 | 88 |
| hsa0413011 | Oral cavity | OSCC | SNARE interactions in vesicular transport | 28/3704 | 33/8465 | 1.31e-06 | 7.18e-06 | 3.66e-06 | 28 |
| hsa04145113 | Oral cavity | OSCC | Phagosome | 88/3704 | 152/8465 | 2.83e-04 | 9.13e-04 | 4.65e-04 | 88 |
| hsa0414529 | Oral cavity | LP | Phagosome | 73/2418 | 152/8465 | 2.37e-07 | 3.29e-06 | 2.12e-06 | 73 |
| hsa0413021 | Oral cavity | LP | SNARE interactions in vesicular transport | 22/2418 | 33/8465 | 6.00e-06 | 4.76e-05 | 3.07e-05 | 22 |
| hsa0414536 | Oral cavity | LP | Phagosome | 73/2418 | 152/8465 | 2.37e-07 | 3.29e-06 | 2.12e-06 | 73 |
| hsa0413031 | Oral cavity | LP | SNARE interactions in vesicular transport | 22/2418 | 33/8465 | 6.00e-06 | 4.76e-05 | 3.07e-05 | 22 |
| Page: 1 |
Top |
Cell-cell communication analysis |
| Identification of potential cell-cell interactions between two cell types and their ligand-receptor pairs for different disease states |
| Ligand | Receptor | LRpair | Pathway | Tissue | Disease Stage |
| Page: 1 |
Top |
Single-cell gene regulatory network inference analysis |
| Find out the significant the regulons (TFs) and the target genes of each regulon across cell types for different disease states |
| TF | Cell Type | Tissue | Disease Stage | Target Gene | RSS | Regulon Activity |
| ∗The dot plots of a searched regulon are shown for all cell subpopulations in each disease state of each tissue based on the regulon specific score inferred using pySCENIC and by calculating the average expression. |
| Page: 1 |
Top |
Somatic mutation of malignant transformation related genes |
| Annotation of somatic variants for genes involved in malignant transformation |
| Hugo Symbol | Variant Class | Variant Classification | dbSNP RS | HGVSc | HGVSp | HGVSp Short | SWISSPROT | BIOTYPE | SIFT | PolyPhen | Tumor Sample Barcode | Tissue | Histology | Sex | Age | Stage | Therapy Types | Drugs | Outcome |
| STX7 | SNV | Missense_Mutation | novel | c.226C>A | p.Leu76Met | p.L76M | O15400 | protein_coding | deleterious(0.03) | probably_damaging(0.996) | TCGA-2W-A8YY-01 | Cervix | cervical & endocervical cancer | Female | <65 | I/II | Chemotherapy | cisplatin | CR |
| STX7 | SNV | Missense_Mutation | c.727N>G | p.Leu243Val | p.L243V | O15400 | protein_coding | tolerated(0.64) | benign(0) | TCGA-LP-A5U2-01 | Cervix | cervical & endocervical cancer | Female | <65 | III/IV | Unknown | Unknown | SD | |
| STX7 | SNV | Missense_Mutation | rs747083359 | c.101G>T | p.Arg34Ile | p.R34I | O15400 | protein_coding | deleterious(0.01) | probably_damaging(0.937) | TCGA-AA-A00N-01 | Colorectum | colon adenocarcinoma | Male | >=65 | I/II | Unknown | Unknown | PD |
| STX7 | SNV | Missense_Mutation | rs746429926 | c.695G>A | p.Arg232His | p.R232H | O15400 | protein_coding | deleterious(0.04) | possibly_damaging(0.767) | TCGA-AA-A02R-01 | Colorectum | colon adenocarcinoma | Female | >=65 | I/II | Unknown | Unknown | PD |
| STX7 | SNV | Missense_Mutation | rs747083359 | c.101N>T | p.Arg34Ile | p.R34I | O15400 | protein_coding | deleterious(0.01) | probably_damaging(0.937) | TCGA-A5-A1OF-01 | Endometrium | uterine corpus endometrioid carcinoma | Female | <65 | I/II | Unknown | Unknown | SD |
| STX7 | SNV | Missense_Mutation | novel | c.130G>T | p.Asp44Tyr | p.D44Y | O15400 | protein_coding | deleterious(0) | probably_damaging(0.999) | TCGA-AJ-A3EL-01 | Endometrium | uterine corpus endometrioid carcinoma | Female | <65 | I/II | Unknown | Unknown | SD |
| STX7 | SNV | Missense_Mutation | c.402G>T | p.Glu134Asp | p.E134D | O15400 | protein_coding | tolerated(0.68) | benign(0.001) | TCGA-AP-A059-01 | Endometrium | uterine corpus endometrioid carcinoma | Female | >=65 | I/II | Unknown | Unknown | SD | |
| STX7 | SNV | Missense_Mutation | novel | c.326G>T | p.Arg109Met | p.R109M | O15400 | protein_coding | deleterious(0) | probably_damaging(0.998) | TCGA-AP-A059-01 | Endometrium | uterine corpus endometrioid carcinoma | Female | >=65 | I/II | Unknown | Unknown | SD |
| STX7 | SNV | Missense_Mutation | rs747083359 | c.101G>T | p.Arg34Ile | p.R34I | O15400 | protein_coding | deleterious(0.01) | probably_damaging(0.937) | TCGA-AP-A059-01 | Endometrium | uterine corpus endometrioid carcinoma | Female | >=65 | I/II | Unknown | Unknown | SD |
| STX7 | SNV | Missense_Mutation | c.216N>T | p.Glu72Asp | p.E72D | O15400 | protein_coding | tolerated(0.41) | benign(0.007) | TCGA-B5-A0JY-01 | Endometrium | uterine corpus endometrioid carcinoma | Female | <65 | III/IV | Chemotherapy | doxorubicin | SD |
| Page: 1 2 3 |
Top |
Related drugs of malignant transformation related genes |
| Identification of chemicals and drugs interact with genes involved in malignant transfromation |
| (DGIdb 4.0) |
| Entrez ID | Symbol | Category | Interaction Types | Drug Claim Name | Drug Name | PMIDs |
| Page: 1 |

Copyright 2023-Present -The University of Texas Health Science Center at Houston |