
|
|||||
|
 | |
| |
| |
| |
| |
| |
|
Gene: STX5 |
Gene summary for STX5 |
| Gene information | Species | Human | Gene symbol | STX5 | Gene ID | 6811 |
| Gene name | syntaxin 5 | |
| Gene Alias | SED5 | |
| Cytomap | 11q12.3 | |
| Gene Type | protein-coding | GO ID | GO:0006807 | UniProtAcc | Q13190 |
Top |
Malignant transformation analysis |
| Identification of the aberrant gene expression in precancerous and cancerous lesions by comparing the gene expression of stem-like cells in diseased tissues with normal stem cells |
| Entrez ID | Symbol | Replicates | Species | Organ | Tissue | Adj P-value | Log2FC | Malignancy |
| 6811 | STX5 | LZE4T | Human | Esophagus | ESCC | 4.37e-10 | 3.56e-01 | 0.0811 |
| 6811 | STX5 | LZE7T | Human | Esophagus | ESCC | 1.72e-02 | 3.05e-01 | 0.0667 |
| 6811 | STX5 | LZE8T | Human | Esophagus | ESCC | 1.41e-02 | 1.56e-01 | 0.067 |
| 6811 | STX5 | LZE20T | Human | Esophagus | ESCC | 1.83e-02 | 1.92e-01 | 0.0662 |
| 6811 | STX5 | LZE22D1 | Human | Esophagus | HGIN | 2.64e-05 | 3.00e-01 | 0.0595 |
| 6811 | STX5 | LZE22T | Human | Esophagus | ESCC | 2.49e-07 | 4.29e-01 | 0.068 |
| 6811 | STX5 | LZE24T | Human | Esophagus | ESCC | 9.79e-22 | 7.45e-01 | 0.0596 |
| 6811 | STX5 | LZE6T | Human | Esophagus | ESCC | 5.71e-05 | 3.28e-01 | 0.0845 |
| 6811 | STX5 | P1T-E | Human | Esophagus | ESCC | 1.21e-02 | 3.70e-01 | 0.0875 |
| 6811 | STX5 | P2T-E | Human | Esophagus | ESCC | 1.13e-26 | 4.92e-01 | 0.1177 |
| 6811 | STX5 | P4T-E | Human | Esophagus | ESCC | 6.73e-27 | 6.00e-01 | 0.1323 |
| 6811 | STX5 | P5T-E | Human | Esophagus | ESCC | 3.73e-18 | 3.88e-01 | 0.1327 |
| 6811 | STX5 | P8T-E | Human | Esophagus | ESCC | 5.05e-33 | 6.96e-01 | 0.0889 |
| 6811 | STX5 | P9T-E | Human | Esophagus | ESCC | 3.13e-17 | 4.48e-01 | 0.1131 |
| 6811 | STX5 | P10T-E | Human | Esophagus | ESCC | 1.21e-14 | 2.64e-01 | 0.116 |
| 6811 | STX5 | P11T-E | Human | Esophagus | ESCC | 4.52e-20 | 7.56e-01 | 0.1426 |
| 6811 | STX5 | P12T-E | Human | Esophagus | ESCC | 2.14e-32 | 6.00e-01 | 0.1122 |
| 6811 | STX5 | P15T-E | Human | Esophagus | ESCC | 4.52e-07 | 1.90e-01 | 0.1149 |
| 6811 | STX5 | P16T-E | Human | Esophagus | ESCC | 1.90e-21 | 4.61e-01 | 0.1153 |
| 6811 | STX5 | P17T-E | Human | Esophagus | ESCC | 5.50e-11 | 5.36e-01 | 0.1278 |
| Page: 1 2 3 4 5 6 7 |
| Tissue | Expression Dynamics | Abbreviation |
| Esophagus | 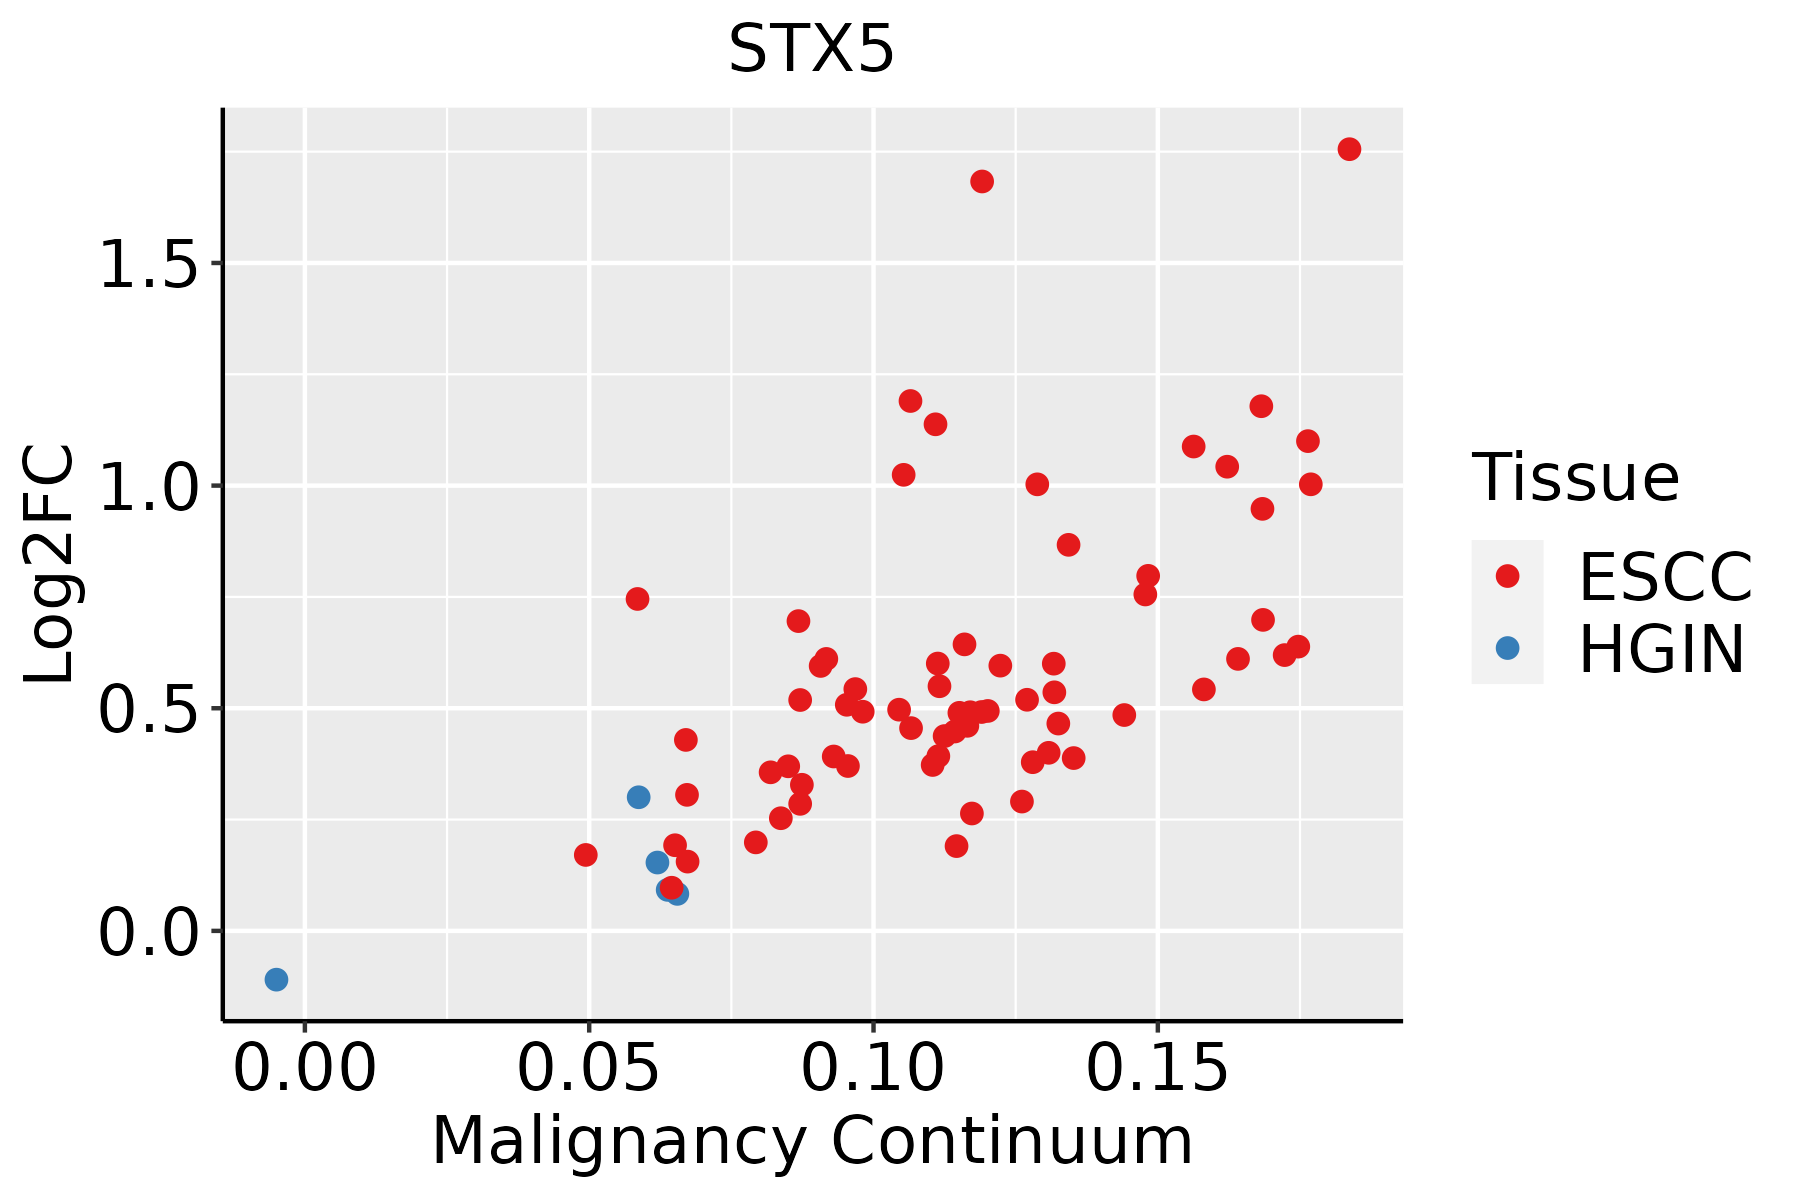 | ESCC: Esophageal squamous cell carcinoma |
| HGIN: High-grade intraepithelial neoplasias | ||
| LGIN: Low-grade intraepithelial neoplasias | ||
| Liver | 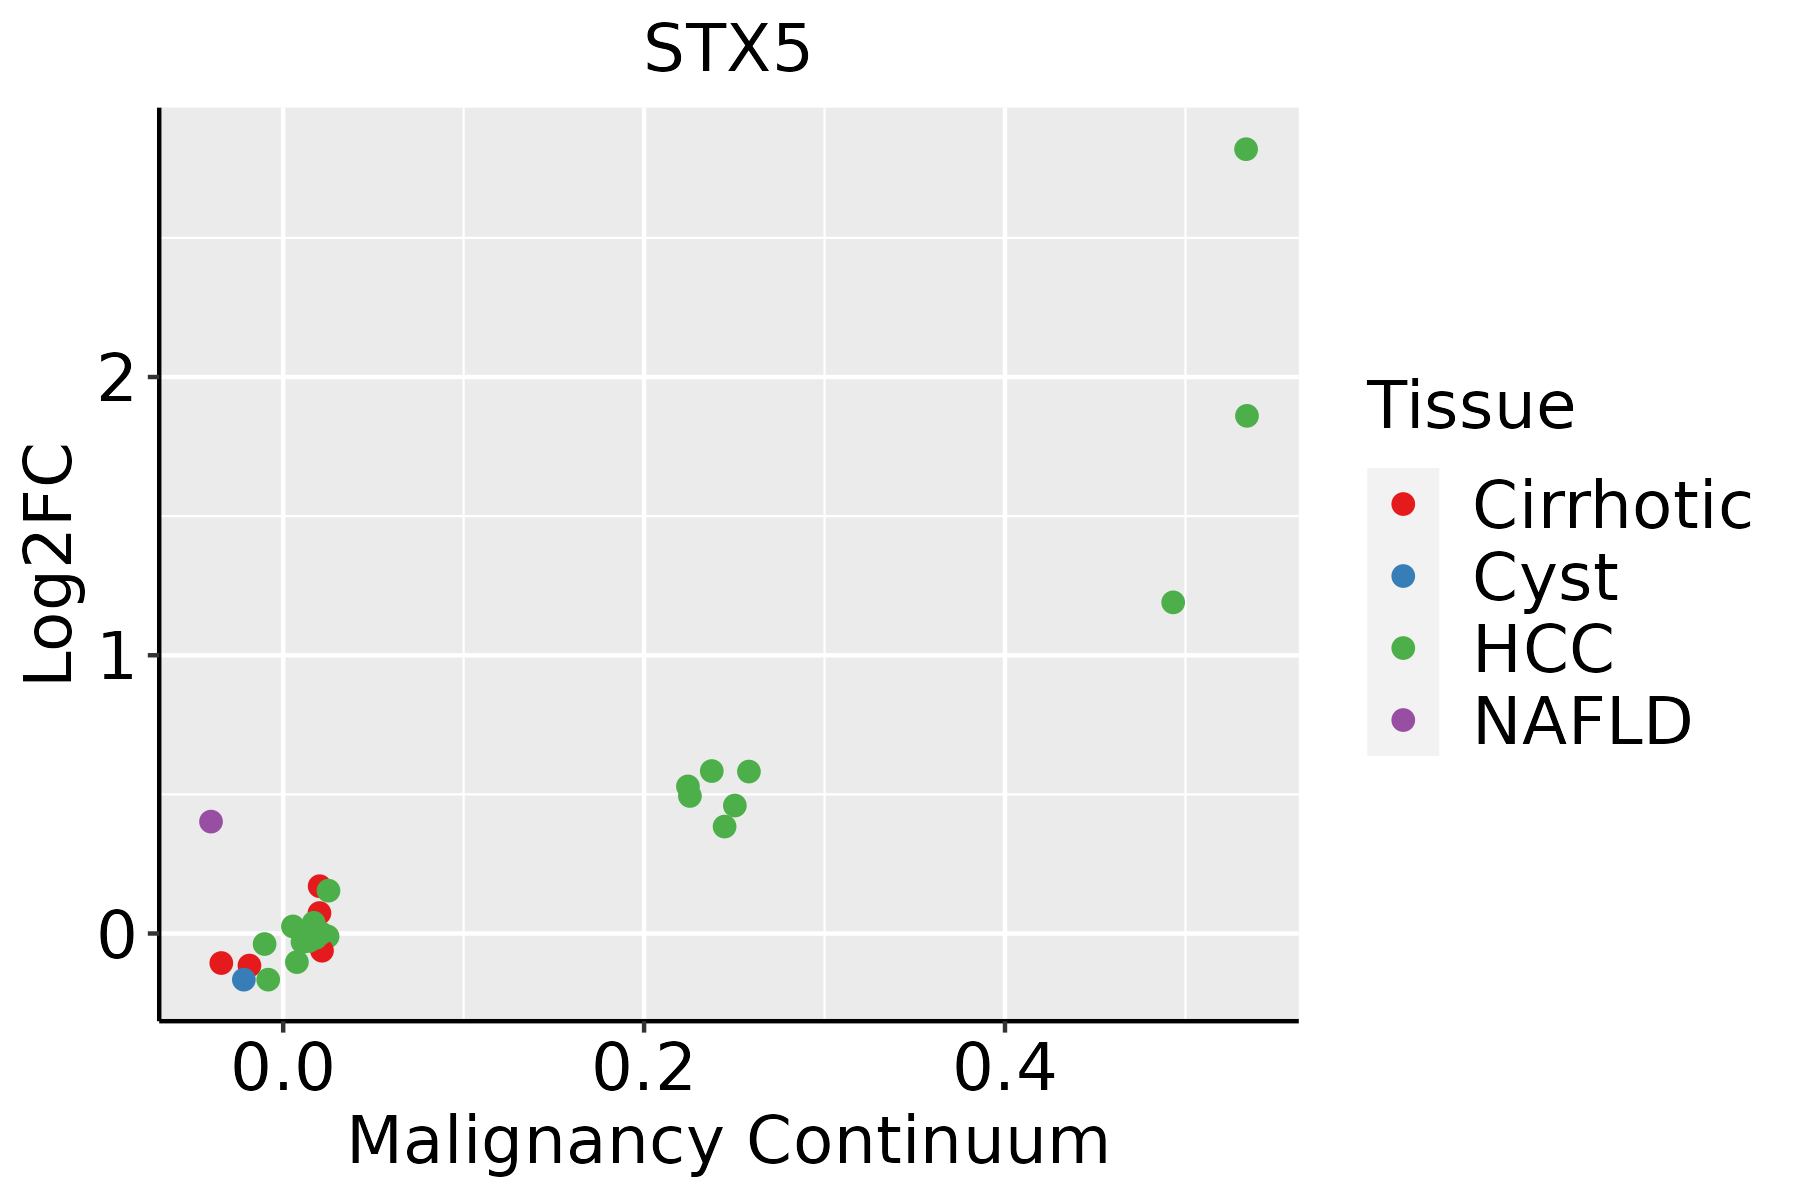 | HCC: Hepatocellular carcinoma |
| NAFLD: Non-alcoholic fatty liver disease | ||
| Lung | 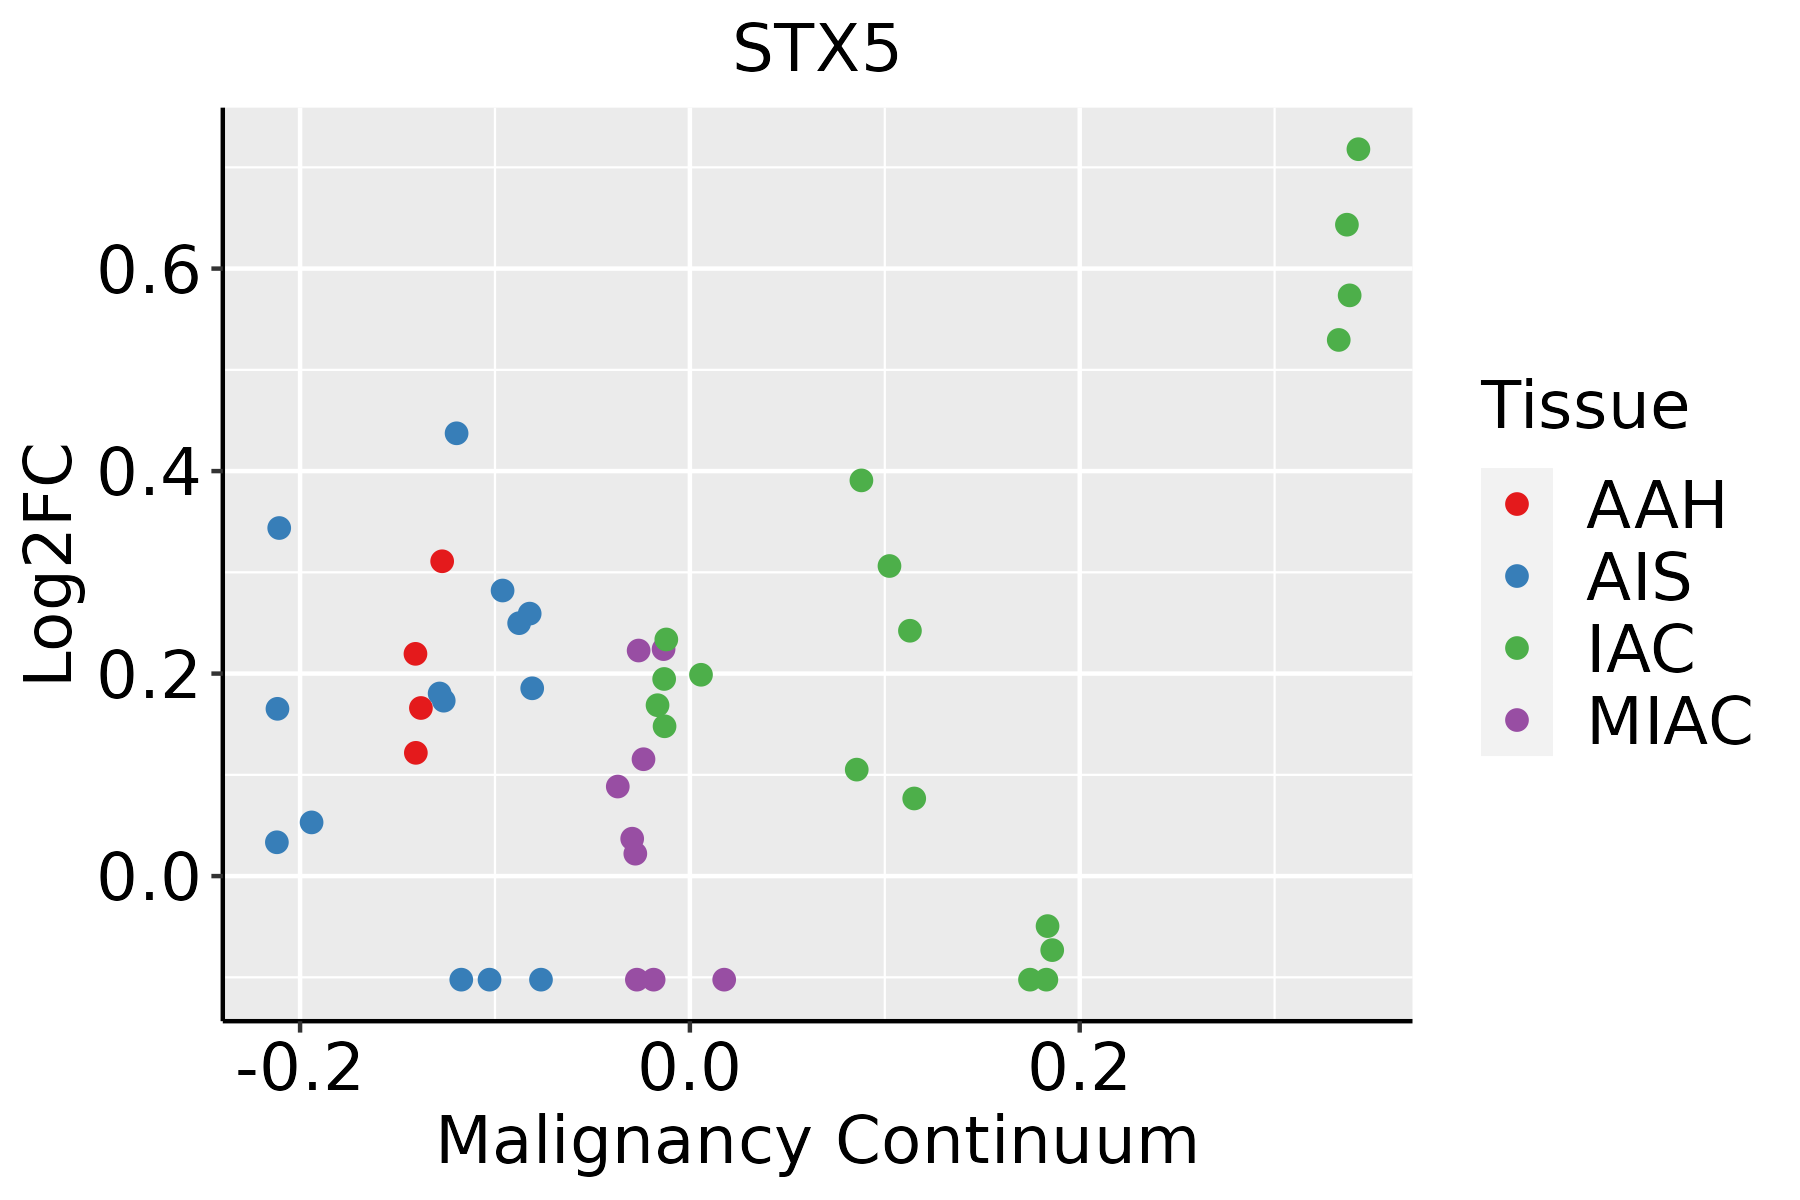 | AAH: Atypical adenomatous hyperplasia |
| AIS: Adenocarcinoma in situ | ||
| IAC: Invasive lung adenocarcinoma | ||
| MIA: Minimally invasive adenocarcinoma | ||
| Oral Cavity | 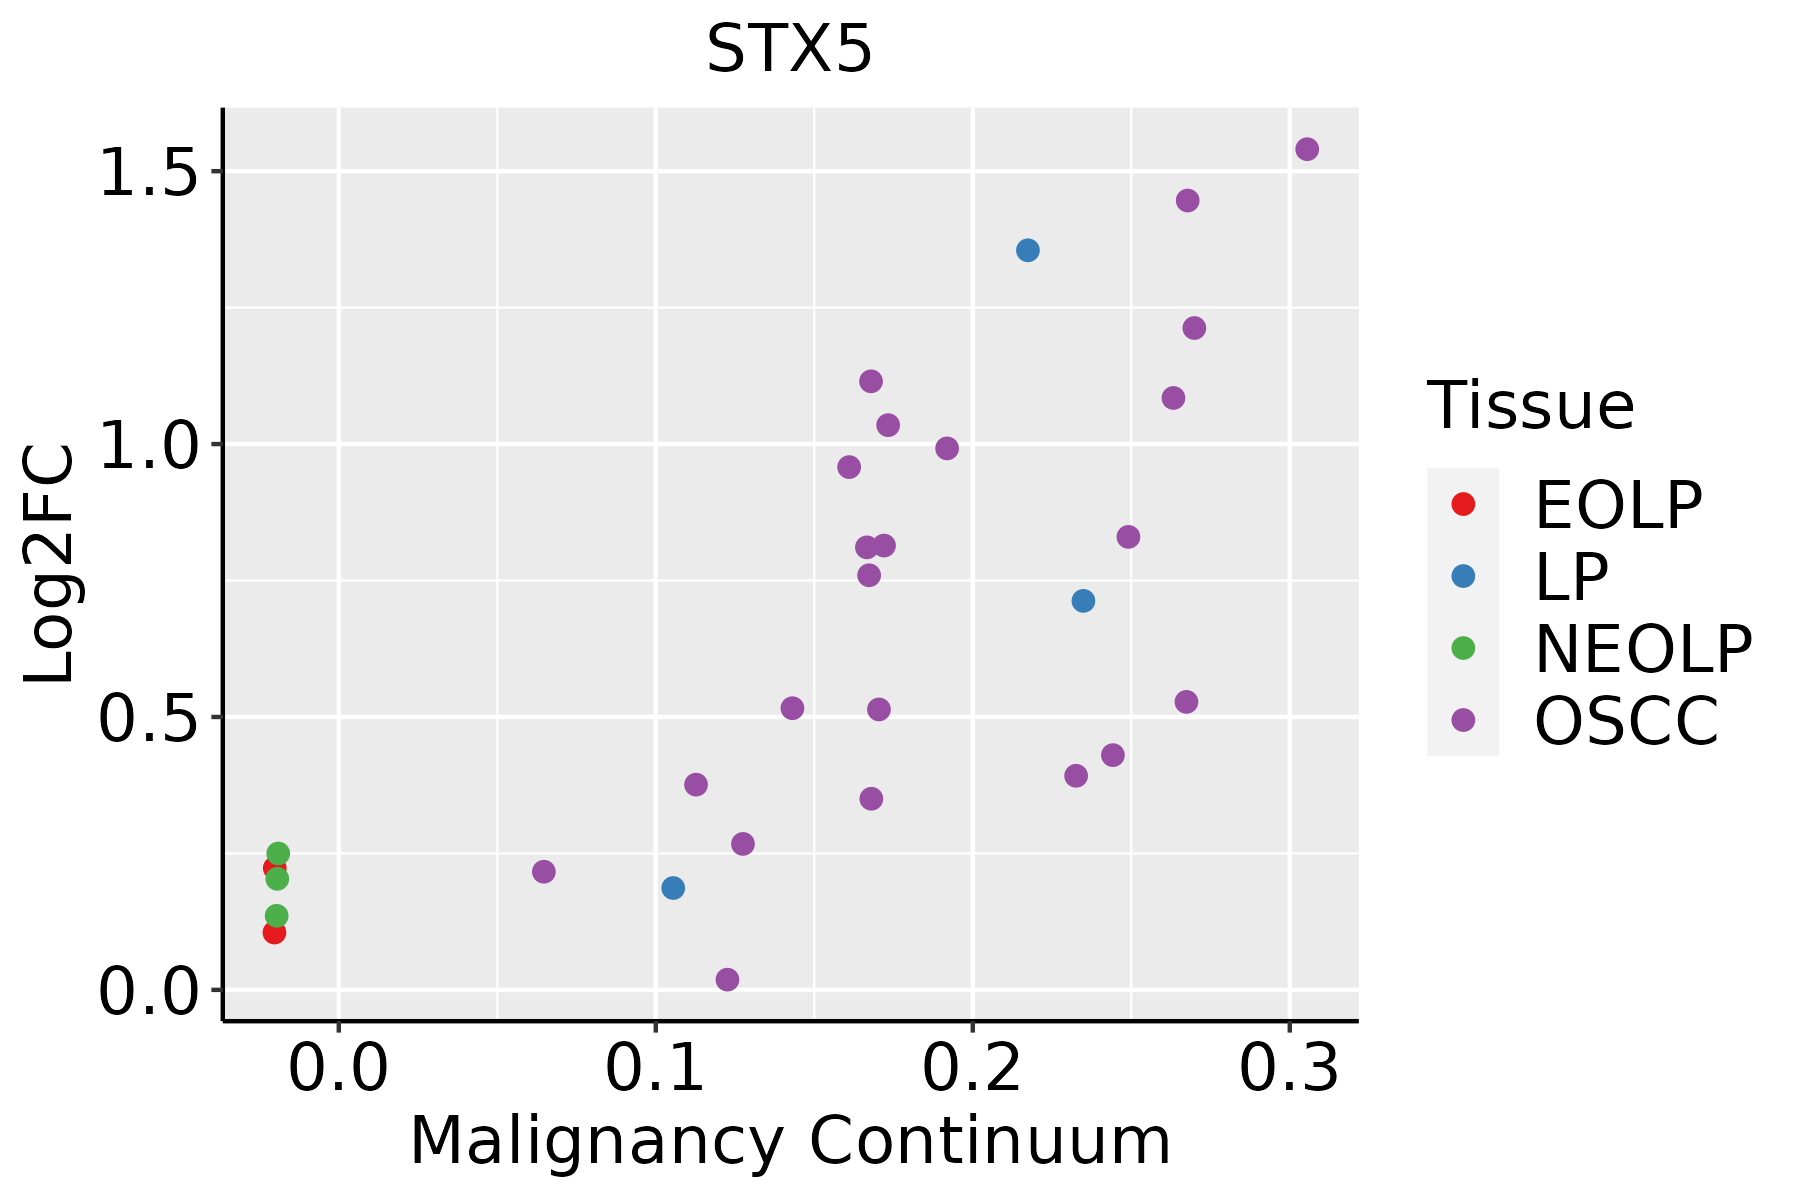 | EOLP: Erosive Oral lichen planus |
| LP: leukoplakia | ||
| NEOLP: Non-erosive oral lichen planus | ||
| OSCC: Oral squamous cell carcinoma | ||
| Skin | 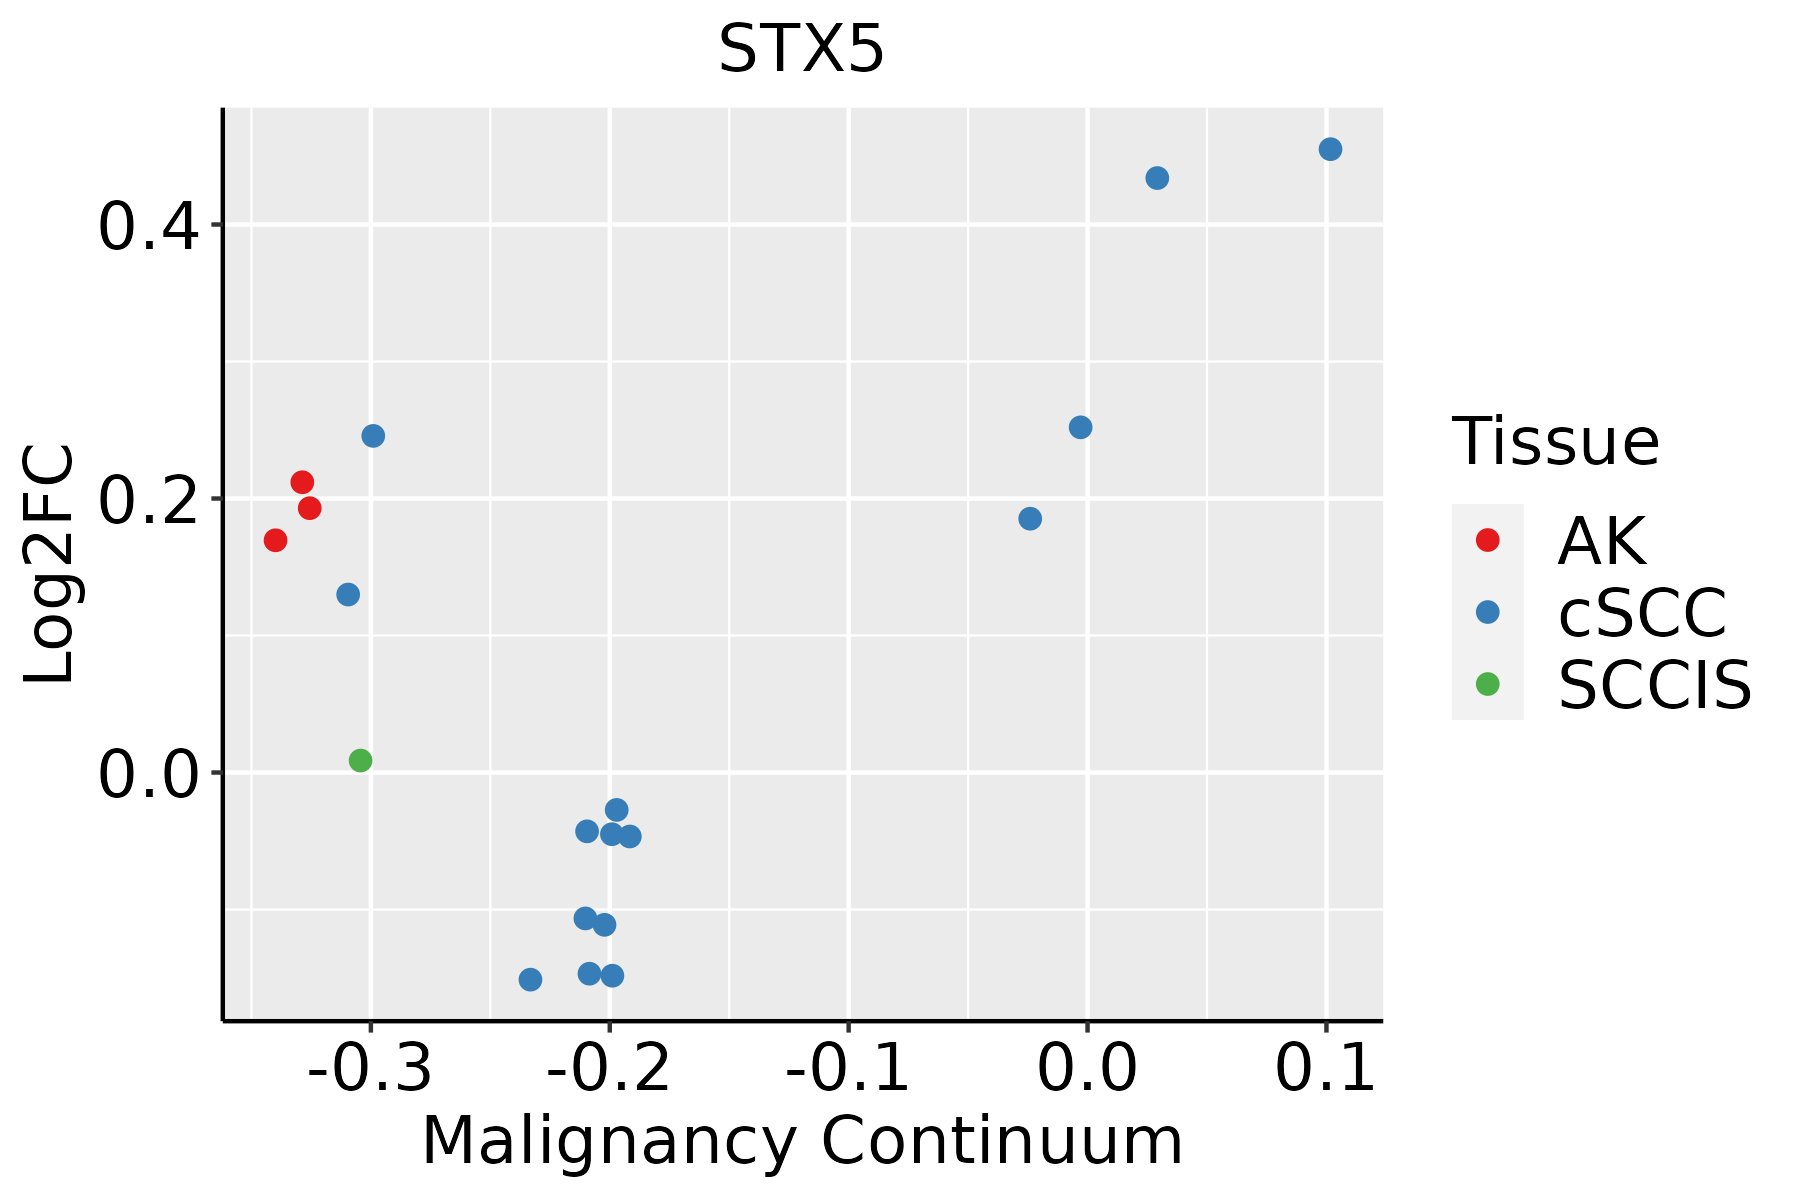 | AK: Actinic keratosis |
| cSCC: Cutaneous squamous cell carcinoma | ||
| SCCIS:squamous cell carcinoma in situ | ||
| Thyroid | 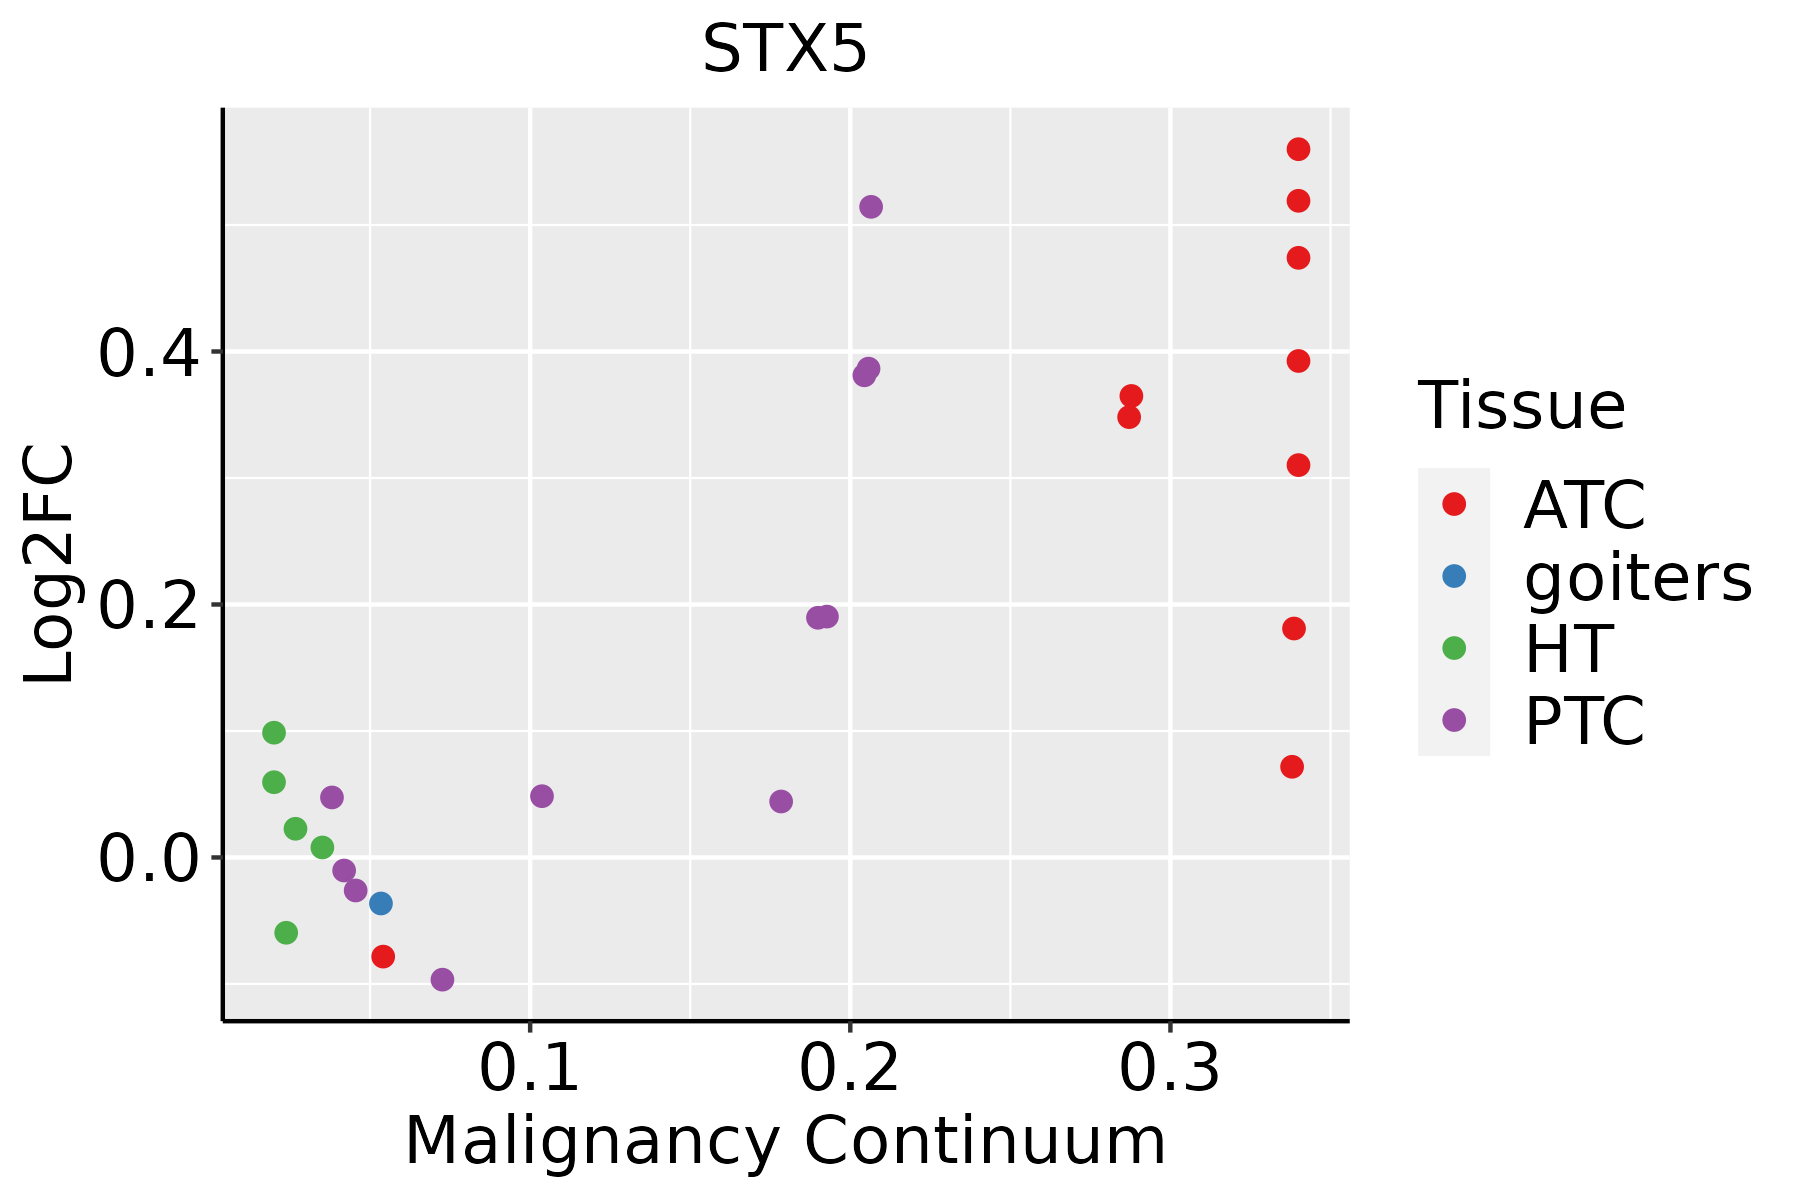 | ATC: Anaplastic thyroid cancer |
| HT: Hashimoto's thyroiditis | ||
| PTC: Papillary thyroid cancer |
| ∗log2FC in expression of this searched gene in stem-like cells from each diseased tissue sample relative to stem-like cells in normal samples in each tissue plotted against the malignancy continuum. Samples are colored based on if they are from different disease stage. |
Top |
Malignant transformation related pathway analysis |
| Find out the enriched GO biological processes and KEGG pathways involved in transition from healthy to precancer to cancer |
| Tissue | Disease Stage | Enriched GO biological Processes |
| Colorectum | AD |  |
| Colorectum | SER |  |
| Colorectum | MSS |  |
| Colorectum | MSI-H |  |
| Colorectum | FAP |  |
| ∗Top 15 enriched GO BP terms are showed in the bar plot of each disease state in each tissue. Each row represents a significant GO biological process which is colored according to the -log10(p.adjust). |
| Page: 1 2 3 4 5 6 7 8 9 |
| GO ID | Tissue | Disease Stage | Description | Gene Ratio | Bg Ratio | pvalue | p.adjust | Count |
| GO:004217627 | Esophagus | HGIN | regulation of protein catabolic process | 119/2587 | 391/18723 | 8.09e-18 | 2.43e-15 | 119 |
| GO:000989626 | Esophagus | HGIN | positive regulation of catabolic process | 126/2587 | 492/18723 | 1.46e-12 | 2.09e-10 | 126 |
| GO:004819317 | Esophagus | HGIN | Golgi vesicle transport | 83/2587 | 296/18723 | 8.59e-11 | 8.89e-09 | 83 |
| GO:004573227 | Esophagus | HGIN | positive regulation of protein catabolic process | 69/2587 | 231/18723 | 1.66e-10 | 1.64e-08 | 69 |
| GO:002241120 | Esophagus | HGIN | cellular component disassembly | 102/2587 | 443/18723 | 8.31e-08 | 4.33e-06 | 102 |
| GO:00068889 | Esophagus | HGIN | endoplasmic reticulum to Golgi vesicle-mediated transport | 40/2587 | 130/18723 | 4.67e-07 | 2.07e-05 | 40 |
| GO:19030089 | Esophagus | HGIN | organelle disassembly | 36/2587 | 114/18723 | 8.60e-07 | 3.58e-05 | 36 |
| GO:001619710 | Esophagus | HGIN | endosomal transport | 57/2587 | 230/18723 | 5.74e-06 | 1.81e-04 | 57 |
| GO:00160509 | Esophagus | HGIN | vesicle organization | 65/2587 | 300/18723 | 1.24e-04 | 2.54e-03 | 65 |
| GO:004819318 | Esophagus | ESCC | Golgi vesicle transport | 231/8552 | 296/18723 | 1.82e-30 | 9.63e-28 | 231 |
| GO:0042176111 | Esophagus | ESCC | regulation of protein catabolic process | 280/8552 | 391/18723 | 8.65e-26 | 2.39e-23 | 280 |
| GO:0022411111 | Esophagus | ESCC | cellular component disassembly | 305/8552 | 443/18723 | 1.94e-23 | 4.57e-21 | 305 |
| GO:0009896111 | Esophagus | ESCC | positive regulation of catabolic process | 332/8552 | 492/18723 | 4.36e-23 | 9.22e-21 | 332 |
| GO:001605014 | Esophagus | ESCC | vesicle organization | 211/8552 | 300/18723 | 2.85e-18 | 2.87e-16 | 211 |
| GO:001619715 | Esophagus | ESCC | endosomal transport | 168/8552 | 230/18723 | 2.28e-17 | 1.93e-15 | 168 |
| GO:0045732111 | Esophagus | ESCC | positive regulation of protein catabolic process | 167/8552 | 231/18723 | 1.47e-16 | 1.14e-14 | 167 |
| GO:000688815 | Esophagus | ESCC | endoplasmic reticulum to Golgi vesicle-mediated transport | 102/8552 | 130/18723 | 1.73e-14 | 9.22e-13 | 102 |
| GO:001648210 | Esophagus | ESCC | cytosolic transport | 124/8552 | 168/18723 | 9.69e-14 | 4.69e-12 | 124 |
| GO:190300816 | Esophagus | ESCC | organelle disassembly | 89/8552 | 114/18723 | 1.36e-12 | 5.80e-11 | 89 |
| GO:00482844 | Esophagus | ESCC | organelle fusion | 94/8552 | 141/18723 | 3.72e-07 | 5.16e-06 | 94 |
| Page: 1 2 3 4 5 6 7 8 9 10 11 12 |
| Pathway ID | Tissue | Disease Stage | Description | Gene Ratio | Bg Ratio | pvalue | p.adjust | qvalue | Count |
| hsa041305 | Esophagus | ESCC | SNARE interactions in vesicular transport | 28/4205 | 33/8465 | 2.75e-05 | 1.32e-04 | 6.75e-05 | 28 |
| hsa0413012 | Esophagus | ESCC | SNARE interactions in vesicular transport | 28/4205 | 33/8465 | 2.75e-05 | 1.32e-04 | 6.75e-05 | 28 |
| hsa04130 | Liver | Cirrhotic | SNARE interactions in vesicular transport | 18/2530 | 33/8465 | 2.64e-03 | 1.10e-02 | 6.76e-03 | 18 |
| hsa041301 | Liver | Cirrhotic | SNARE interactions in vesicular transport | 18/2530 | 33/8465 | 2.64e-03 | 1.10e-02 | 6.76e-03 | 18 |
| hsa041302 | Liver | HCC | SNARE interactions in vesicular transport | 25/4020 | 33/8465 | 8.78e-04 | 3.38e-03 | 1.88e-03 | 25 |
| hsa041303 | Liver | HCC | SNARE interactions in vesicular transport | 25/4020 | 33/8465 | 8.78e-04 | 3.38e-03 | 1.88e-03 | 25 |
| hsa041304 | Oral cavity | OSCC | SNARE interactions in vesicular transport | 28/3704 | 33/8465 | 1.31e-06 | 7.18e-06 | 3.66e-06 | 28 |
| hsa0413011 | Oral cavity | OSCC | SNARE interactions in vesicular transport | 28/3704 | 33/8465 | 1.31e-06 | 7.18e-06 | 3.66e-06 | 28 |
| hsa0413021 | Oral cavity | LP | SNARE interactions in vesicular transport | 22/2418 | 33/8465 | 6.00e-06 | 4.76e-05 | 3.07e-05 | 22 |
| hsa0413031 | Oral cavity | LP | SNARE interactions in vesicular transport | 22/2418 | 33/8465 | 6.00e-06 | 4.76e-05 | 3.07e-05 | 22 |
| Page: 1 |
Top |
Cell-cell communication analysis |
| Identification of potential cell-cell interactions between two cell types and their ligand-receptor pairs for different disease states |
| Ligand | Receptor | LRpair | Pathway | Tissue | Disease Stage |
| Page: 1 |
Top |
Single-cell gene regulatory network inference analysis |
| Find out the significant the regulons (TFs) and the target genes of each regulon across cell types for different disease states |
| TF | Cell Type | Tissue | Disease Stage | Target Gene | RSS | Regulon Activity |
| ∗The dot plots of a searched regulon are shown for all cell subpopulations in each disease state of each tissue based on the regulon specific score inferred using pySCENIC and by calculating the average expression. |
| Page: 1 |
Top |
Somatic mutation of malignant transformation related genes |
| Annotation of somatic variants for genes involved in malignant transformation |
| Hugo Symbol | Variant Class | Variant Classification | dbSNP RS | HGVSc | HGVSp | HGVSp Short | SWISSPROT | BIOTYPE | SIFT | PolyPhen | Tumor Sample Barcode | Tissue | Histology | Sex | Age | Stage | Therapy Types | Drugs | Outcome |
| STX5 | SNV | Missense_Mutation | rs761425627 | c.998G>A | p.Arg333Gln | p.R333Q | Q13190 | protein_coding | deleterious(0) | probably_damaging(0.967) | TCGA-VS-A9UL-01 | Cervix | cervical & endocervical cancer | Female | >=65 | III/IV | Unknown | Unknown | PD |
| STX5 | SNV | Missense_Mutation | rs143457390 | c.298C>T | p.Arg100Cys | p.R100C | Q13190 | protein_coding | tolerated(0.22) | benign(0.017) | TCGA-AA-3864-01 | Colorectum | colon adenocarcinoma | Male | >=65 | I/II | Unknown | Unknown | SD |
| STX5 | SNV | Missense_Mutation | c.833N>T | p.Ser278Leu | p.S278L | Q13190 | protein_coding | deleterious(0) | probably_damaging(0.948) | TCGA-AA-3867-01 | Colorectum | colon adenocarcinoma | Male | >=65 | III/IV | Unknown | Unknown | PD | |
| STX5 | SNV | Missense_Mutation | c.913G>A | p.Asp305Asn | p.D305N | Q13190 | protein_coding | deleterious(0.04) | possibly_damaging(0.847) | TCGA-AA-A00N-01 | Colorectum | colon adenocarcinoma | Male | >=65 | I/II | Unknown | Unknown | PD | |
| STX5 | SNV | Missense_Mutation | rs542193132 | c.266N>A | p.Arg89Gln | p.R89Q | Q13190 | protein_coding | tolerated(1) | benign(0.003) | TCGA-AH-6643-01 | Colorectum | rectum adenocarcinoma | Male | <65 | III/IV | Chemotherapy | oxaliplatin | PD |
| STX5 | SNV | Missense_Mutation | novel | c.14A>C | p.Lys5Thr | p.K5T | Q13190 | protein_coding | deleterious_low_confidence(0.02) | benign(0.143) | TCGA-F5-6814-01 | Colorectum | rectum adenocarcinoma | Male | <65 | I/II | Unknown | Unknown | SD |
| STX5 | insertion | Frame_Shift_Ins | rs746707646 | c.131_132insC | p.Val45SerfsTer38 | p.V45Sfs*38 | Q13190 | protein_coding | TCGA-AZ-6598-01 | Colorectum | colon adenocarcinoma | Female | >=65 | I/II | Unknown | Unknown | SD | ||
| STX5 | insertion | Frame_Shift_Ins | rs746707646 | c.131_132insC | p.Val45SerfsTer38 | p.V45Sfs*38 | Q13190 | protein_coding | TCGA-CK-5913-01 | Colorectum | colon adenocarcinoma | Female | <65 | I/II | Unknown | Unknown | SD | ||
| STX5 | insertion | Frame_Shift_Ins | rs746707646 | c.131_132insC | p.Val45SerfsTer38 | p.V45Sfs*38 | Q13190 | protein_coding | TCGA-G4-6309-01 | Colorectum | colon adenocarcinoma | Female | <65 | III/IV | Chemotherapy | xeloda | PD | ||
| STX5 | SNV | Missense_Mutation | c.310N>T | p.Asp104Tyr | p.D104Y | Q13190 | protein_coding | deleterious(0) | probably_damaging(0.997) | TCGA-A5-A1OF-01 | Endometrium | uterine corpus endometrioid carcinoma | Female | <65 | I/II | Unknown | Unknown | SD |
| Page: 1 2 3 |
Top |
Related drugs of malignant transformation related genes |
| Identification of chemicals and drugs interact with genes involved in malignant transfromation |
| (DGIdb 4.0) |
| Entrez ID | Symbol | Category | Interaction Types | Drug Claim Name | Drug Name | PMIDs |
| Page: 1 |

Copyright 2023-Present -The University of Texas Health Science Center at Houston |