
|
|||||
|
 | |
| |
| |
| |
| |
| |
|
Gene: STX4 |
Gene summary for STX4 |
| Gene information | Species | Human | Gene symbol | STX4 | Gene ID | 6810 |
| Gene name | syntaxin 4 | |
| Gene Alias | STX4A | |
| Cytomap | 16p11.2 | |
| Gene Type | protein-coding | GO ID | GO:0001505 | UniProtAcc | B7Z425 |
Top |
Malignant transformation analysis |
| Identification of the aberrant gene expression in precancerous and cancerous lesions by comparing the gene expression of stem-like cells in diseased tissues with normal stem cells |
| Entrez ID | Symbol | Replicates | Species | Organ | Tissue | Adj P-value | Log2FC | Malignancy |
| 6810 | STX4 | LZE4T | Human | Esophagus | ESCC | 1.03e-09 | 2.64e-01 | 0.0811 |
| 6810 | STX4 | LZE7T | Human | Esophagus | ESCC | 3.13e-05 | 2.18e-01 | 0.0667 |
| 6810 | STX4 | LZE8T | Human | Esophagus | ESCC | 1.58e-10 | 2.91e-01 | 0.067 |
| 6810 | STX4 | LZE20T | Human | Esophagus | ESCC | 5.46e-04 | 8.54e-02 | 0.0662 |
| 6810 | STX4 | LZE24T | Human | Esophagus | ESCC | 2.57e-24 | 8.71e-01 | 0.0596 |
| 6810 | STX4 | LZE21T | Human | Esophagus | ESCC | 1.67e-02 | 3.76e-01 | 0.0655 |
| 6810 | STX4 | LZE6T | Human | Esophagus | ESCC | 9.25e-08 | 3.04e-01 | 0.0845 |
| 6810 | STX4 | P1T-E | Human | Esophagus | ESCC | 9.20e-16 | 6.80e-01 | 0.0875 |
| 6810 | STX4 | P2T-E | Human | Esophagus | ESCC | 5.67e-33 | 6.18e-01 | 0.1177 |
| 6810 | STX4 | P4T-E | Human | Esophagus | ESCC | 1.41e-14 | 3.31e-01 | 0.1323 |
| 6810 | STX4 | P5T-E | Human | Esophagus | ESCC | 4.49e-12 | 1.63e-01 | 0.1327 |
| 6810 | STX4 | P8T-E | Human | Esophagus | ESCC | 7.80e-25 | 4.71e-01 | 0.0889 |
| 6810 | STX4 | P9T-E | Human | Esophagus | ESCC | 8.03e-14 | 2.17e-01 | 0.1131 |
| 6810 | STX4 | P10T-E | Human | Esophagus | ESCC | 4.19e-12 | 6.06e-02 | 0.116 |
| 6810 | STX4 | P11T-E | Human | Esophagus | ESCC | 6.78e-16 | 6.54e-01 | 0.1426 |
| 6810 | STX4 | P12T-E | Human | Esophagus | ESCC | 1.22e-28 | 4.74e-01 | 0.1122 |
| 6810 | STX4 | P15T-E | Human | Esophagus | ESCC | 7.46e-22 | 3.97e-01 | 0.1149 |
| 6810 | STX4 | P16T-E | Human | Esophagus | ESCC | 1.16e-15 | 2.11e-01 | 0.1153 |
| 6810 | STX4 | P17T-E | Human | Esophagus | ESCC | 5.99e-14 | 5.24e-01 | 0.1278 |
| 6810 | STX4 | P19T-E | Human | Esophagus | ESCC | 2.02e-04 | 3.58e-01 | 0.1662 |
| Page: 1 2 3 4 5 6 |
| Tissue | Expression Dynamics | Abbreviation |
| Esophagus | 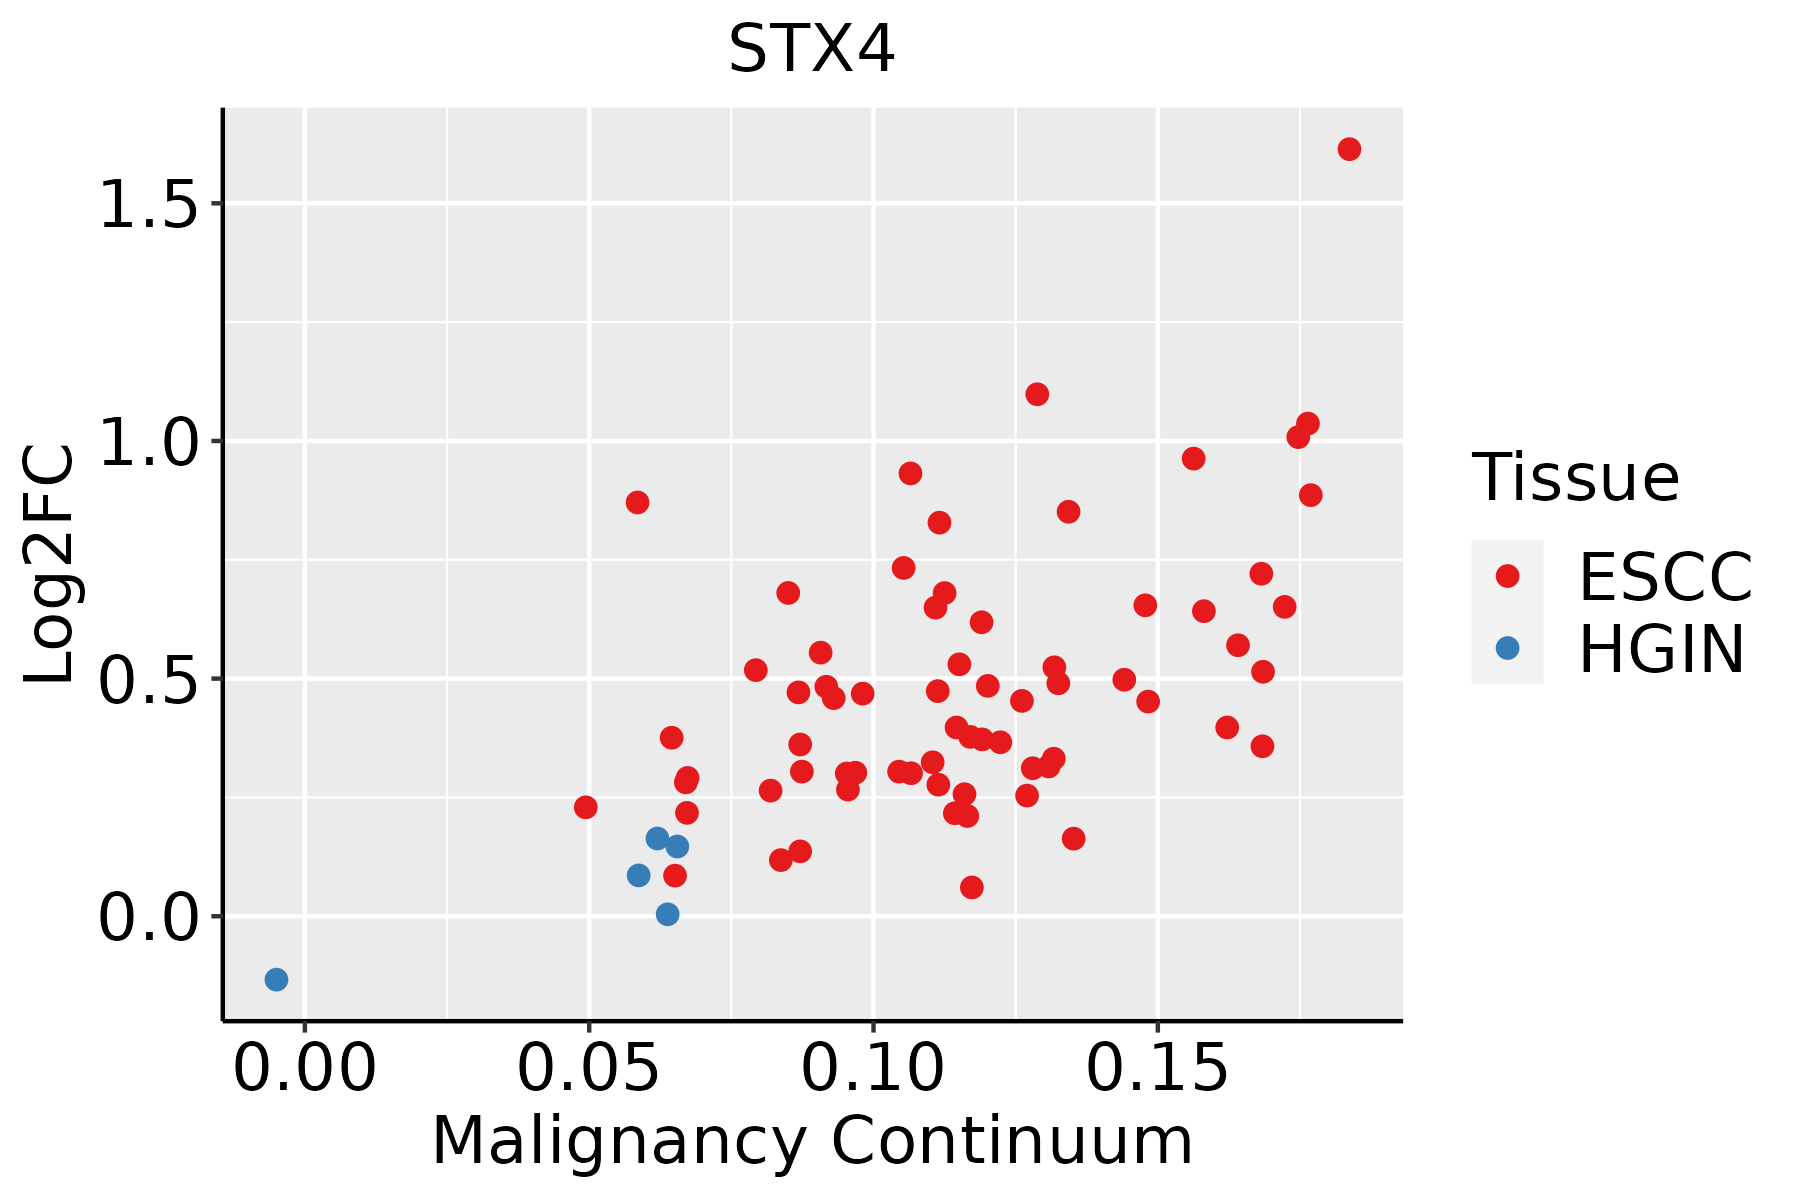 | ESCC: Esophageal squamous cell carcinoma |
| HGIN: High-grade intraepithelial neoplasias | ||
| LGIN: Low-grade intraepithelial neoplasias | ||
| Liver | 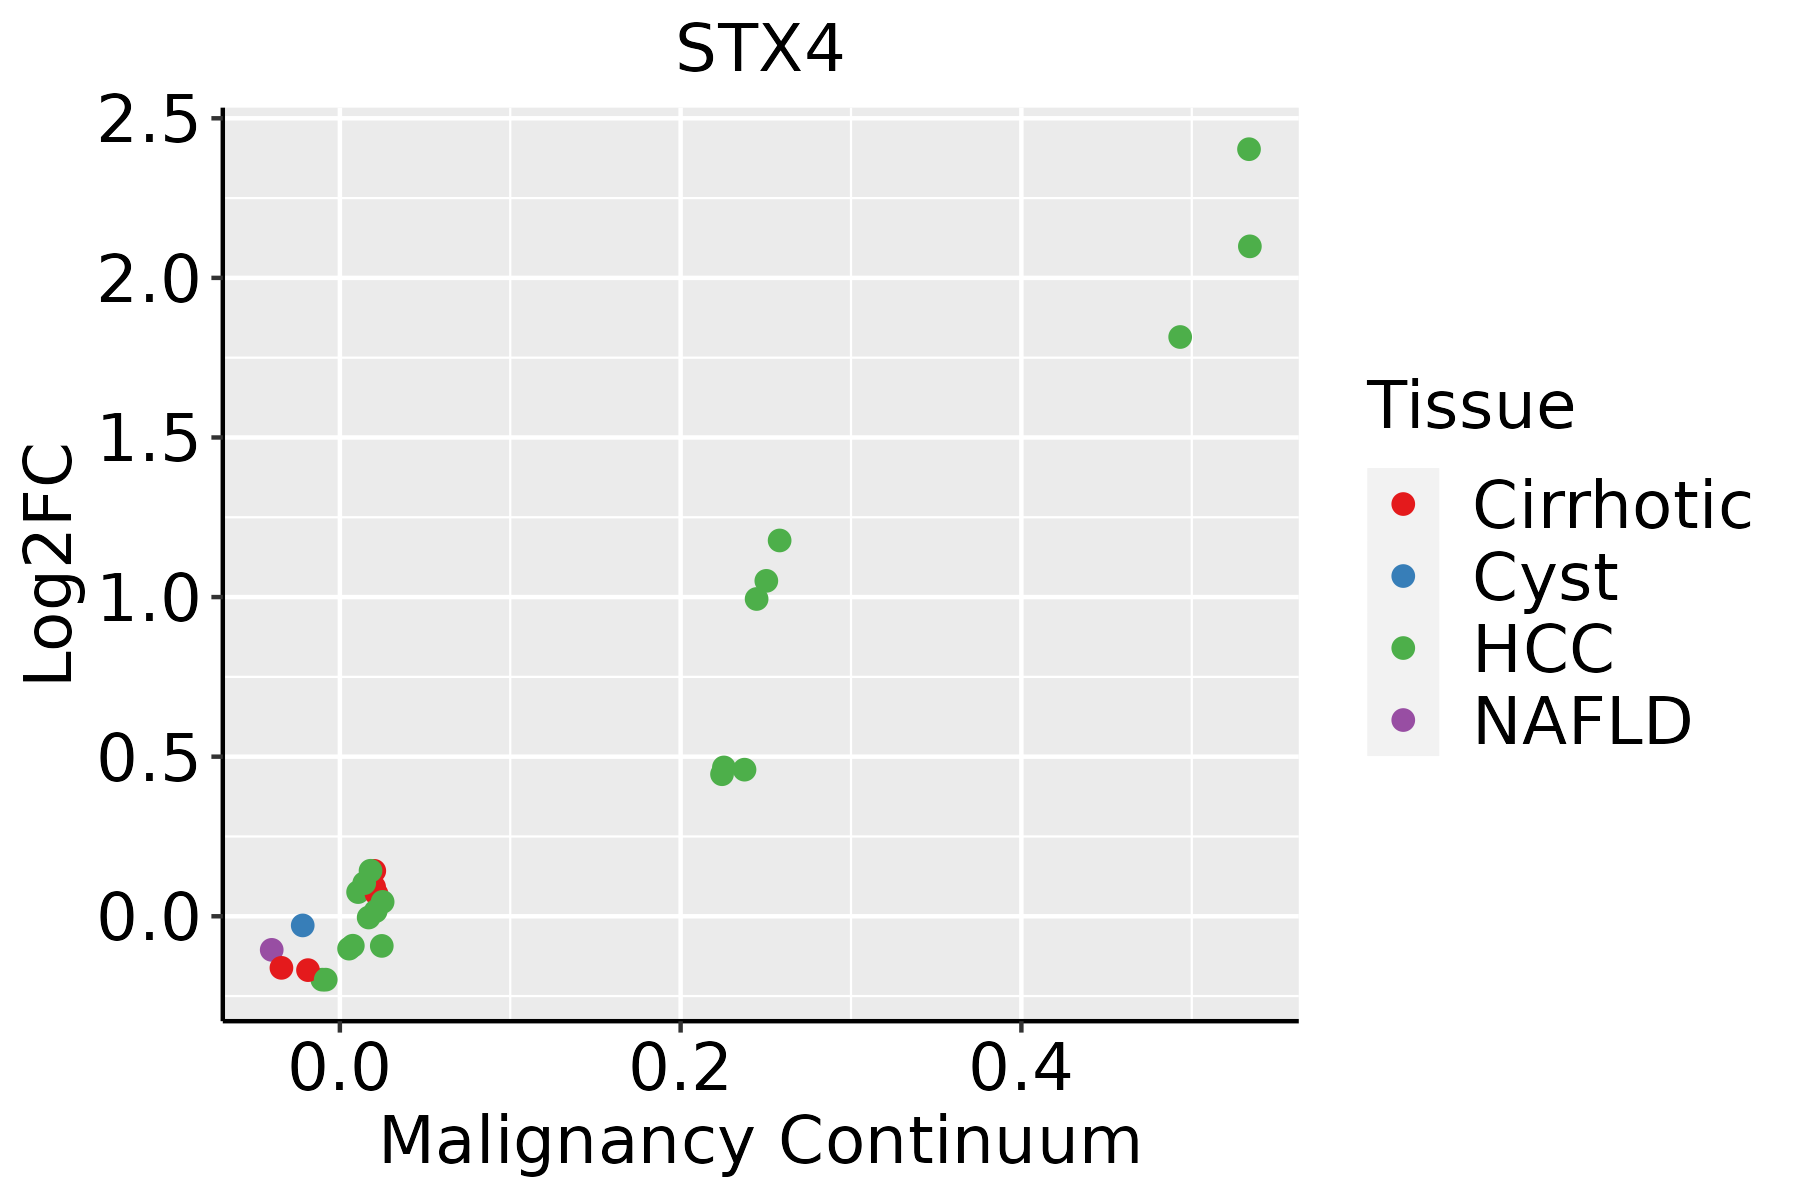 | HCC: Hepatocellular carcinoma |
| NAFLD: Non-alcoholic fatty liver disease | ||
| Oral Cavity | 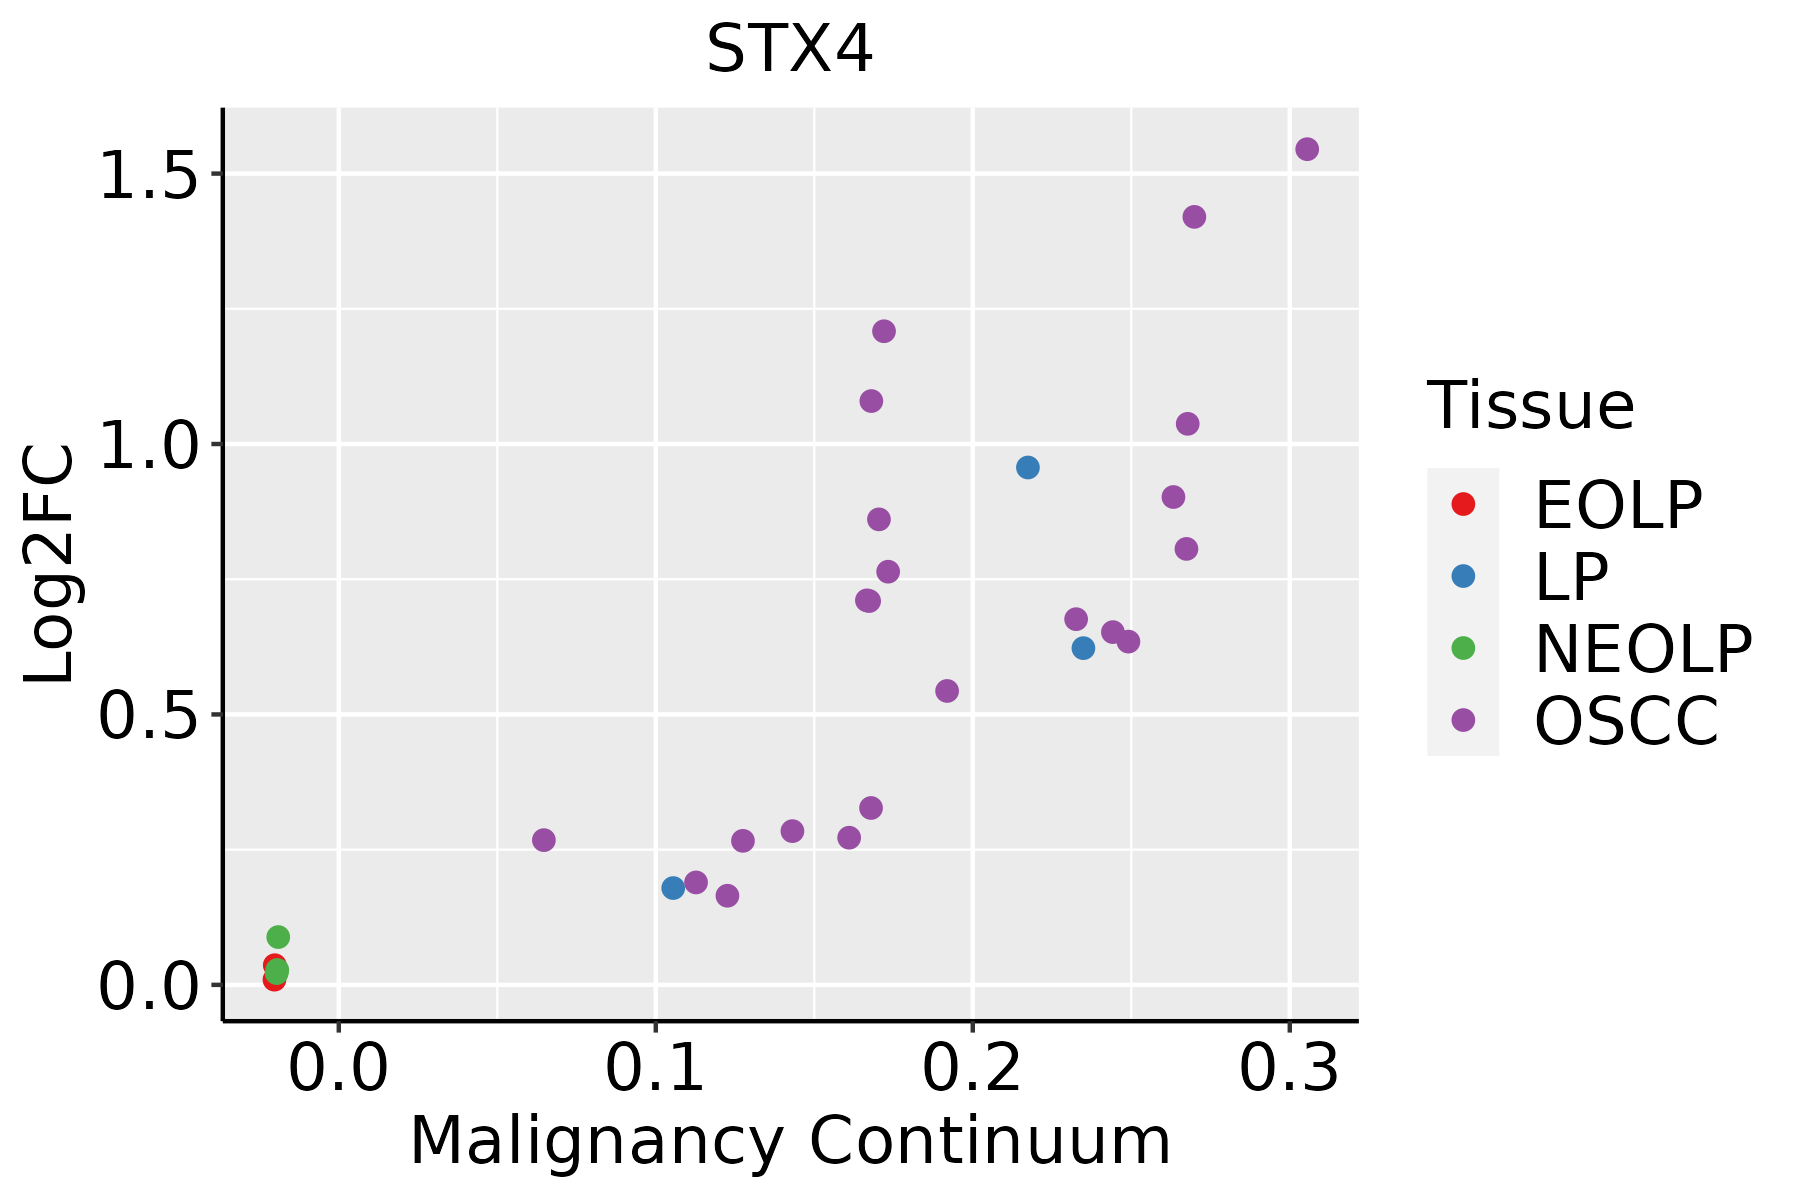 | EOLP: Erosive Oral lichen planus |
| LP: leukoplakia | ||
| NEOLP: Non-erosive oral lichen planus | ||
| OSCC: Oral squamous cell carcinoma | ||
| Skin | 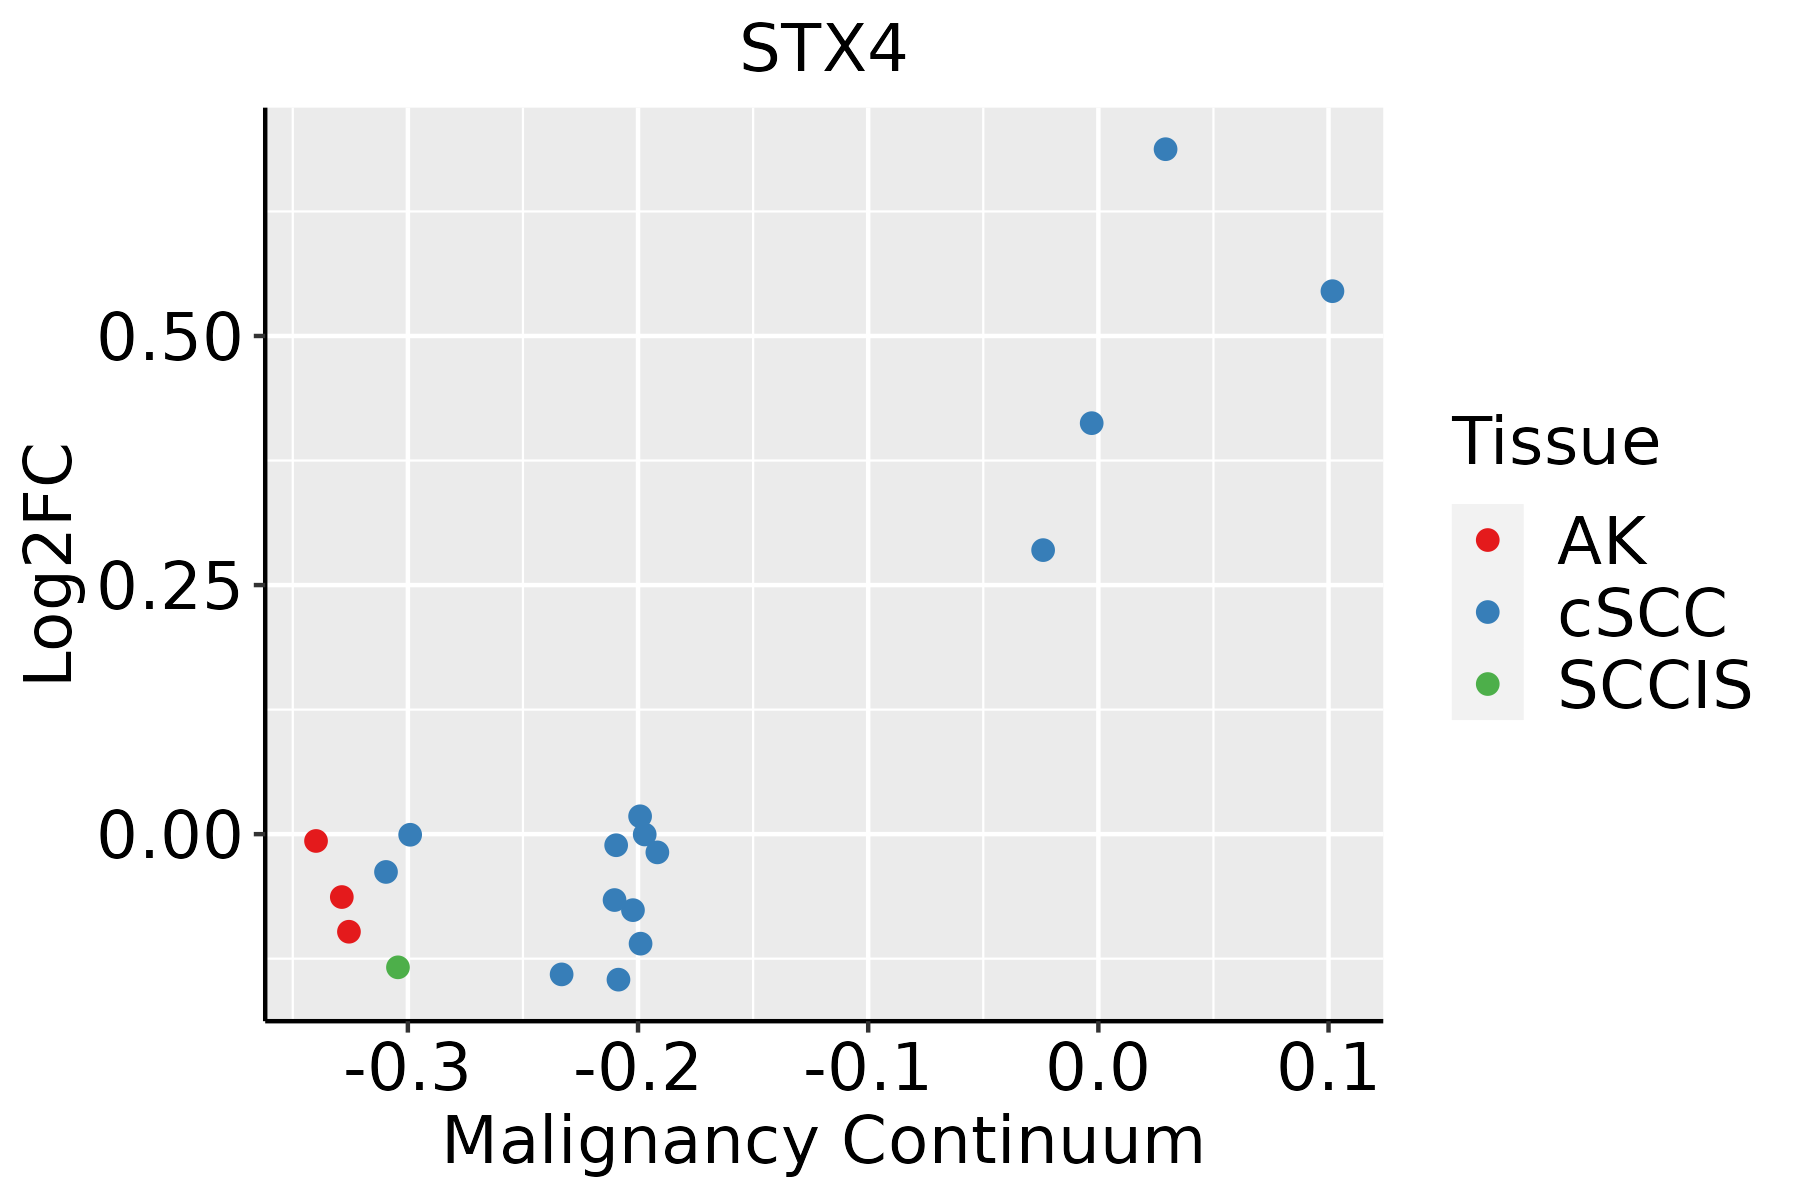 | AK: Actinic keratosis |
| cSCC: Cutaneous squamous cell carcinoma | ||
| SCCIS:squamous cell carcinoma in situ | ||
| Thyroid |  | ATC: Anaplastic thyroid cancer |
| HT: Hashimoto's thyroiditis | ||
| PTC: Papillary thyroid cancer |
| ∗log2FC in expression of this searched gene in stem-like cells from each diseased tissue sample relative to stem-like cells in normal samples in each tissue plotted against the malignancy continuum. Samples are colored based on if they are from different disease stage. |
Top |
Malignant transformation related pathway analysis |
| Find out the enriched GO biological processes and KEGG pathways involved in transition from healthy to precancer to cancer |
| Tissue | Disease Stage | Enriched GO biological Processes |
| Colorectum | AD |  |
| Colorectum | SER |  |
| Colorectum | MSS |  |
| Colorectum | MSI-H |  |
| Colorectum | FAP |  |
| ∗Top 15 enriched GO BP terms are showed in the bar plot of each disease state in each tissue. Each row represents a significant GO biological process which is colored according to the -log10(p.adjust). |
| Page: 1 2 3 4 5 6 7 8 9 |
| GO ID | Tissue | Disease Stage | Description | Gene Ratio | Bg Ratio | pvalue | p.adjust | Count |
| GO:2001233111 | Esophagus | ESCC | regulation of apoptotic signaling pathway | 256/8552 | 356/18723 | 4.11e-24 | 1.04e-21 | 256 |
| GO:0006979111 | Esophagus | ESCC | response to oxidative stress | 303/8552 | 446/18723 | 7.15e-22 | 1.30e-19 | 303 |
| GO:1903829111 | Esophagus | ESCC | positive regulation of cellular protein localization | 199/8552 | 276/18723 | 2.99e-19 | 3.45e-17 | 199 |
| GO:0062197111 | Esophagus | ESCC | cellular response to chemical stress | 234/8552 | 337/18723 | 5.37e-19 | 5.97e-17 | 234 |
| GO:001605014 | Esophagus | ESCC | vesicle organization | 211/8552 | 300/18723 | 2.85e-18 | 2.87e-16 | 211 |
| GO:0097191111 | Esophagus | ESCC | extrinsic apoptotic signaling pathway | 159/8552 | 219/18723 | 4.12e-16 | 2.94e-14 | 159 |
| GO:1904951111 | Esophagus | ESCC | positive regulation of establishment of protein localization | 216/8552 | 319/18723 | 1.01e-15 | 6.86e-14 | 216 |
| GO:0034599111 | Esophagus | ESCC | cellular response to oxidative stress | 197/8552 | 288/18723 | 3.76e-15 | 2.15e-13 | 197 |
| GO:0051222111 | Esophagus | ESCC | positive regulation of protein transport | 204/8552 | 303/18723 | 1.56e-14 | 8.38e-13 | 204 |
| GO:0072659110 | Esophagus | ESCC | protein localization to plasma membrane | 193/8552 | 284/18723 | 1.95e-14 | 1.03e-12 | 193 |
| GO:199077819 | Esophagus | ESCC | protein localization to cell periphery | 217/8552 | 333/18723 | 4.08e-13 | 1.88e-11 | 217 |
| GO:2001236111 | Esophagus | ESCC | regulation of extrinsic apoptotic signaling pathway | 111/8552 | 151/18723 | 2.97e-12 | 1.18e-10 | 111 |
| GO:190547519 | Esophagus | ESCC | regulation of protein localization to membrane | 117/8552 | 175/18723 | 1.14e-08 | 2.26e-07 | 117 |
| GO:004578527 | Esophagus | ESCC | positive regulation of cell adhesion | 255/8552 | 437/18723 | 5.07e-08 | 9.11e-07 | 255 |
| GO:190437519 | Esophagus | ESCC | regulation of protein localization to cell periphery | 85/8552 | 125/18723 | 3.63e-07 | 5.06e-06 | 85 |
| GO:00482844 | Esophagus | ESCC | organelle fusion | 94/8552 | 141/18723 | 3.72e-07 | 5.16e-06 | 94 |
| GO:00224069 | Esophagus | ESCC | membrane docking | 62/8552 | 86/18723 | 5.93e-07 | 7.79e-06 | 62 |
| GO:1903076110 | Esophagus | ESCC | regulation of protein localization to plasma membrane | 72/8552 | 104/18723 | 9.74e-07 | 1.23e-05 | 72 |
| GO:190547719 | Esophagus | ESCC | positive regulation of protein localization to membrane | 73/8552 | 106/18723 | 1.13e-06 | 1.40e-05 | 73 |
| GO:000862519 | Esophagus | ESCC | extrinsic apoptotic signaling pathway via death domain receptors | 59/8552 | 82/18723 | 1.23e-06 | 1.52e-05 | 59 |
| Page: 1 2 3 4 5 6 7 8 9 10 11 12 13 14 15 16 17 18 |
| Pathway ID | Tissue | Disease Stage | Description | Gene Ratio | Bg Ratio | pvalue | p.adjust | qvalue | Count |
| hsa041305 | Esophagus | ESCC | SNARE interactions in vesicular transport | 28/4205 | 33/8465 | 2.75e-05 | 1.32e-04 | 6.75e-05 | 28 |
| hsa0496223 | Esophagus | ESCC | Vasopressin-regulated water reabsorption | 33/4205 | 44/8465 | 5.27e-04 | 1.78e-03 | 9.13e-04 | 33 |
| hsa0413012 | Esophagus | ESCC | SNARE interactions in vesicular transport | 28/4205 | 33/8465 | 2.75e-05 | 1.32e-04 | 6.75e-05 | 28 |
| hsa0496233 | Esophagus | ESCC | Vasopressin-regulated water reabsorption | 33/4205 | 44/8465 | 5.27e-04 | 1.78e-03 | 9.13e-04 | 33 |
| hsa04130 | Liver | Cirrhotic | SNARE interactions in vesicular transport | 18/2530 | 33/8465 | 2.64e-03 | 1.10e-02 | 6.76e-03 | 18 |
| hsa041301 | Liver | Cirrhotic | SNARE interactions in vesicular transport | 18/2530 | 33/8465 | 2.64e-03 | 1.10e-02 | 6.76e-03 | 18 |
| hsa041302 | Liver | HCC | SNARE interactions in vesicular transport | 25/4020 | 33/8465 | 8.78e-04 | 3.38e-03 | 1.88e-03 | 25 |
| hsa049624 | Liver | HCC | Vasopressin-regulated water reabsorption | 30/4020 | 44/8465 | 4.41e-03 | 1.32e-02 | 7.34e-03 | 30 |
| hsa041303 | Liver | HCC | SNARE interactions in vesicular transport | 25/4020 | 33/8465 | 8.78e-04 | 3.38e-03 | 1.88e-03 | 25 |
| hsa0496211 | Liver | HCC | Vasopressin-regulated water reabsorption | 30/4020 | 44/8465 | 4.41e-03 | 1.32e-02 | 7.34e-03 | 30 |
| hsa041304 | Oral cavity | OSCC | SNARE interactions in vesicular transport | 28/3704 | 33/8465 | 1.31e-06 | 7.18e-06 | 3.66e-06 | 28 |
| hsa049626 | Oral cavity | OSCC | Vasopressin-regulated water reabsorption | 29/3704 | 44/8465 | 2.47e-03 | 6.52e-03 | 3.32e-03 | 29 |
| hsa0413011 | Oral cavity | OSCC | SNARE interactions in vesicular transport | 28/3704 | 33/8465 | 1.31e-06 | 7.18e-06 | 3.66e-06 | 28 |
| hsa0496213 | Oral cavity | OSCC | Vasopressin-regulated water reabsorption | 29/3704 | 44/8465 | 2.47e-03 | 6.52e-03 | 3.32e-03 | 29 |
| hsa0413021 | Oral cavity | LP | SNARE interactions in vesicular transport | 22/2418 | 33/8465 | 6.00e-06 | 4.76e-05 | 3.07e-05 | 22 |
| hsa0496222 | Oral cavity | LP | Vasopressin-regulated water reabsorption | 20/2418 | 44/8465 | 1.24e-02 | 4.10e-02 | 2.64e-02 | 20 |
| hsa0413031 | Oral cavity | LP | SNARE interactions in vesicular transport | 22/2418 | 33/8465 | 6.00e-06 | 4.76e-05 | 3.07e-05 | 22 |
| hsa0496232 | Oral cavity | LP | Vasopressin-regulated water reabsorption | 20/2418 | 44/8465 | 1.24e-02 | 4.10e-02 | 2.64e-02 | 20 |
| Page: 1 |
Top |
Cell-cell communication analysis |
| Identification of potential cell-cell interactions between two cell types and their ligand-receptor pairs for different disease states |
| Ligand | Receptor | LRpair | Pathway | Tissue | Disease Stage |
| Page: 1 |
Top |
Single-cell gene regulatory network inference analysis |
| Find out the significant the regulons (TFs) and the target genes of each regulon across cell types for different disease states |
| TF | Cell Type | Tissue | Disease Stage | Target Gene | RSS | Regulon Activity |
| ∗The dot plots of a searched regulon are shown for all cell subpopulations in each disease state of each tissue based on the regulon specific score inferred using pySCENIC and by calculating the average expression. |
| Page: 1 |
Top |
Somatic mutation of malignant transformation related genes |
| Annotation of somatic variants for genes involved in malignant transformation |
| Hugo Symbol | Variant Class | Variant Classification | dbSNP RS | HGVSc | HGVSp | HGVSp Short | SWISSPROT | BIOTYPE | SIFT | PolyPhen | Tumor Sample Barcode | Tissue | Histology | Sex | Age | Stage | Therapy Types | Drugs | Outcome |
| STX4 | SNV | Missense_Mutation | c.37N>A | p.Asp13Asn | p.D13N | Q12846 | protein_coding | tolerated(0.24) | benign(0) | TCGA-AC-A23H-01 | Breast | breast invasive carcinoma | Female | >=65 | I/II | Unknown | Unknown | PD | |
| STX4 | SNV | Missense_Mutation | c.115N>A | p.Glu39Lys | p.E39K | Q12846 | protein_coding | deleterious(0.02) | benign(0.01) | TCGA-C8-A26Y-01 | Breast | breast invasive carcinoma | Female | >=65 | I/II | Unknown | Unknown | SD | |
| STX4 | SNV | Missense_Mutation | rs376316073 | c.806N>T | p.Ala269Val | p.A269V | Q12846 | protein_coding | deleterious(0.01) | benign(0.314) | TCGA-D8-A1XJ-01 | Breast | breast invasive carcinoma | Female | >=65 | III/IV | Hormone Therapy | tamoxiphen | SD |
| STX4 | insertion | Frame_Shift_Ins | novel | c.689_690insATGCTCATTCCCAGCAAACACCTTT | p.Val231CysfsTer20 | p.V231Cfs*20 | Q12846 | protein_coding | TCGA-A8-A06U-01 | Breast | breast invasive carcinoma | Female | >=65 | I/II | Unknown | Unknown | SD | ||
| STX4 | SNV | Missense_Mutation | rs751532816 | c.664G>A | p.Asp222Asn | p.D222N | Q12846 | protein_coding | deleterious(0) | benign(0.055) | TCGA-EA-A410-01 | Cervix | cervical & endocervical cancer | Female | <65 | I/II | Unknown | Unknown | SD |
| STX4 | SNV | Missense_Mutation | c.810N>T | p.Arg270Ser | p.R270S | Q12846 | protein_coding | deleterious(0) | possibly_damaging(0.885) | TCGA-AA-3679-01 | Colorectum | colon adenocarcinoma | Male | <65 | III/IV | Chemotherapy | folinic | SD | |
| STX4 | SNV | Missense_Mutation | c.43N>C | p.Ser15Pro | p.S15P | Q12846 | protein_coding | tolerated(0.05) | possibly_damaging(0.768) | TCGA-AA-A022-01 | Colorectum | colon adenocarcinoma | Female | >=65 | I/II | Unknown | Unknown | SD | |
| STX4 | SNV | Missense_Mutation | c.416N>G | p.Asn139Ser | p.N139S | Q12846 | protein_coding | tolerated(0.34) | benign(0.079) | TCGA-G4-6295-01 | Colorectum | colon adenocarcinoma | Female | >=65 | I/II | Unknown | Unknown | SD | |
| STX4 | SNV | Missense_Mutation | c.614N>T | p.Ala205Val | p.A205V | Q12846 | protein_coding | deleterious(0) | benign(0.272) | TCGA-G4-6304-01 | Colorectum | colon adenocarcinoma | Female | >=65 | I/II | Chemotherapy | fluorouracil | PD | |
| STX4 | SNV | Missense_Mutation | c.836N>A | p.Cys279Tyr | p.C279Y | Q12846 | protein_coding | deleterious(0) | probably_damaging(0.998) | TCGA-AG-4021-01 | Colorectum | rectum adenocarcinoma | Female | >=65 | III/IV | Unknown | Unknown | PD |
| Page: 1 2 3 4 |
Top |
Related drugs of malignant transformation related genes |
| Identification of chemicals and drugs interact with genes involved in malignant transfromation |
| (DGIdb 4.0) |
| Entrez ID | Symbol | Category | Interaction Types | Drug Claim Name | Drug Name | PMIDs |
| 6810 | STX4 | CELL SURFACE | phenprocoumon | PHENPROCOUMON | 21063236 | |
| 6810 | STX4 | CELL SURFACE | warfarin | WARFARIN |
| Page: 1 |

Copyright 2023-Present -The University of Texas Health Science Center at Houston |