
|
|||||
|
 | |
| |
| |
| |
| |
| |
|
Gene: STX1A |
Gene summary for STX1A |
| Gene information | Species | Human | Gene symbol | STX1A | Gene ID | 6804 |
| Gene name | syntaxin 1A | |
| Gene Alias | HPC-1 | |
| Cytomap | 7q11.23 | |
| Gene Type | protein-coding | GO ID | GO:0001505 | UniProtAcc | Q16623 |
Top |
Malignant transformation analysis |
| Identification of the aberrant gene expression in precancerous and cancerous lesions by comparing the gene expression of stem-like cells in diseased tissues with normal stem cells |
| Entrez ID | Symbol | Replicates | Species | Organ | Tissue | Adj P-value | Log2FC | Malignancy |
| 6804 | STX1A | LZE24T | Human | Esophagus | ESCC | 1.23e-07 | 2.70e-01 | 0.0596 |
| 6804 | STX1A | P4T-E | Human | Esophagus | ESCC | 8.26e-03 | 9.52e-02 | 0.1323 |
| 6804 | STX1A | P8T-E | Human | Esophagus | ESCC | 1.03e-13 | 2.81e-01 | 0.0889 |
| 6804 | STX1A | P10T-E | Human | Esophagus | ESCC | 5.96e-06 | 1.51e-01 | 0.116 |
| 6804 | STX1A | P11T-E | Human | Esophagus | ESCC | 1.21e-02 | 9.72e-02 | 0.1426 |
| 6804 | STX1A | P12T-E | Human | Esophagus | ESCC | 2.25e-07 | 1.85e-01 | 0.1122 |
| 6804 | STX1A | P15T-E | Human | Esophagus | ESCC | 1.16e-06 | 8.88e-02 | 0.1149 |
| 6804 | STX1A | P16T-E | Human | Esophagus | ESCC | 5.14e-03 | 8.41e-02 | 0.1153 |
| 6804 | STX1A | P20T-E | Human | Esophagus | ESCC | 4.36e-08 | 8.03e-02 | 0.1124 |
| 6804 | STX1A | P21T-E | Human | Esophagus | ESCC | 4.48e-07 | 6.93e-02 | 0.1617 |
| 6804 | STX1A | P23T-E | Human | Esophagus | ESCC | 8.93e-04 | 1.51e-01 | 0.108 |
| 6804 | STX1A | P24T-E | Human | Esophagus | ESCC | 6.10e-03 | 8.87e-02 | 0.1287 |
| 6804 | STX1A | P26T-E | Human | Esophagus | ESCC | 2.42e-07 | 1.74e-01 | 0.1276 |
| 6804 | STX1A | P27T-E | Human | Esophagus | ESCC | 6.31e-06 | 1.38e-01 | 0.1055 |
| 6804 | STX1A | P28T-E | Human | Esophagus | ESCC | 7.33e-10 | 1.93e-01 | 0.1149 |
| 6804 | STX1A | P30T-E | Human | Esophagus | ESCC | 3.59e-03 | 1.27e-01 | 0.137 |
| 6804 | STX1A | P31T-E | Human | Esophagus | ESCC | 1.61e-02 | 8.26e-02 | 0.1251 |
| 6804 | STX1A | P32T-E | Human | Esophagus | ESCC | 3.55e-03 | 1.05e-01 | 0.1666 |
| 6804 | STX1A | P37T-E | Human | Esophagus | ESCC | 1.48e-07 | 1.35e-01 | 0.1371 |
| 6804 | STX1A | P40T-E | Human | Esophagus | ESCC | 1.61e-05 | 1.08e-01 | 0.109 |
| Page: 1 2 3 |
| Tissue | Expression Dynamics | Abbreviation |
| Esophagus | 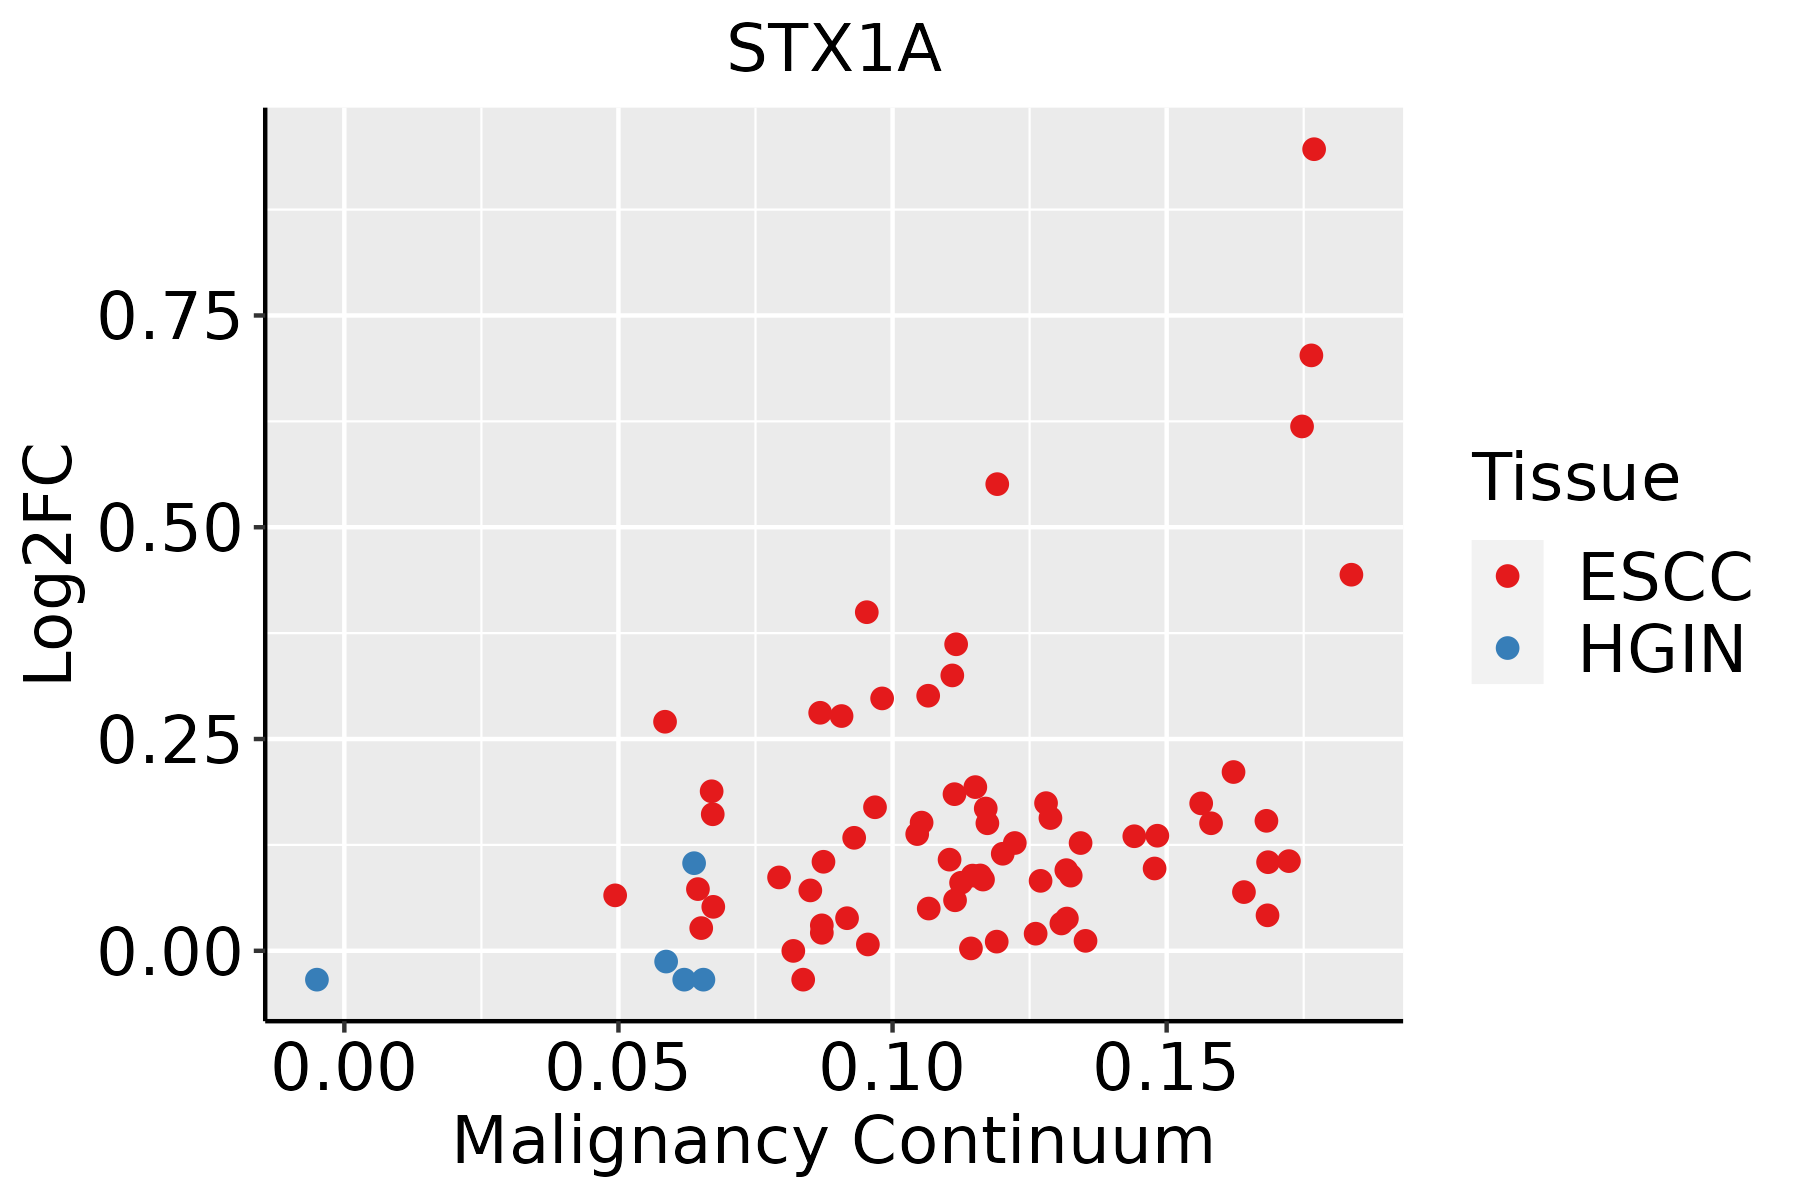 | ESCC: Esophageal squamous cell carcinoma |
| HGIN: High-grade intraepithelial neoplasias | ||
| LGIN: Low-grade intraepithelial neoplasias | ||
| Liver | 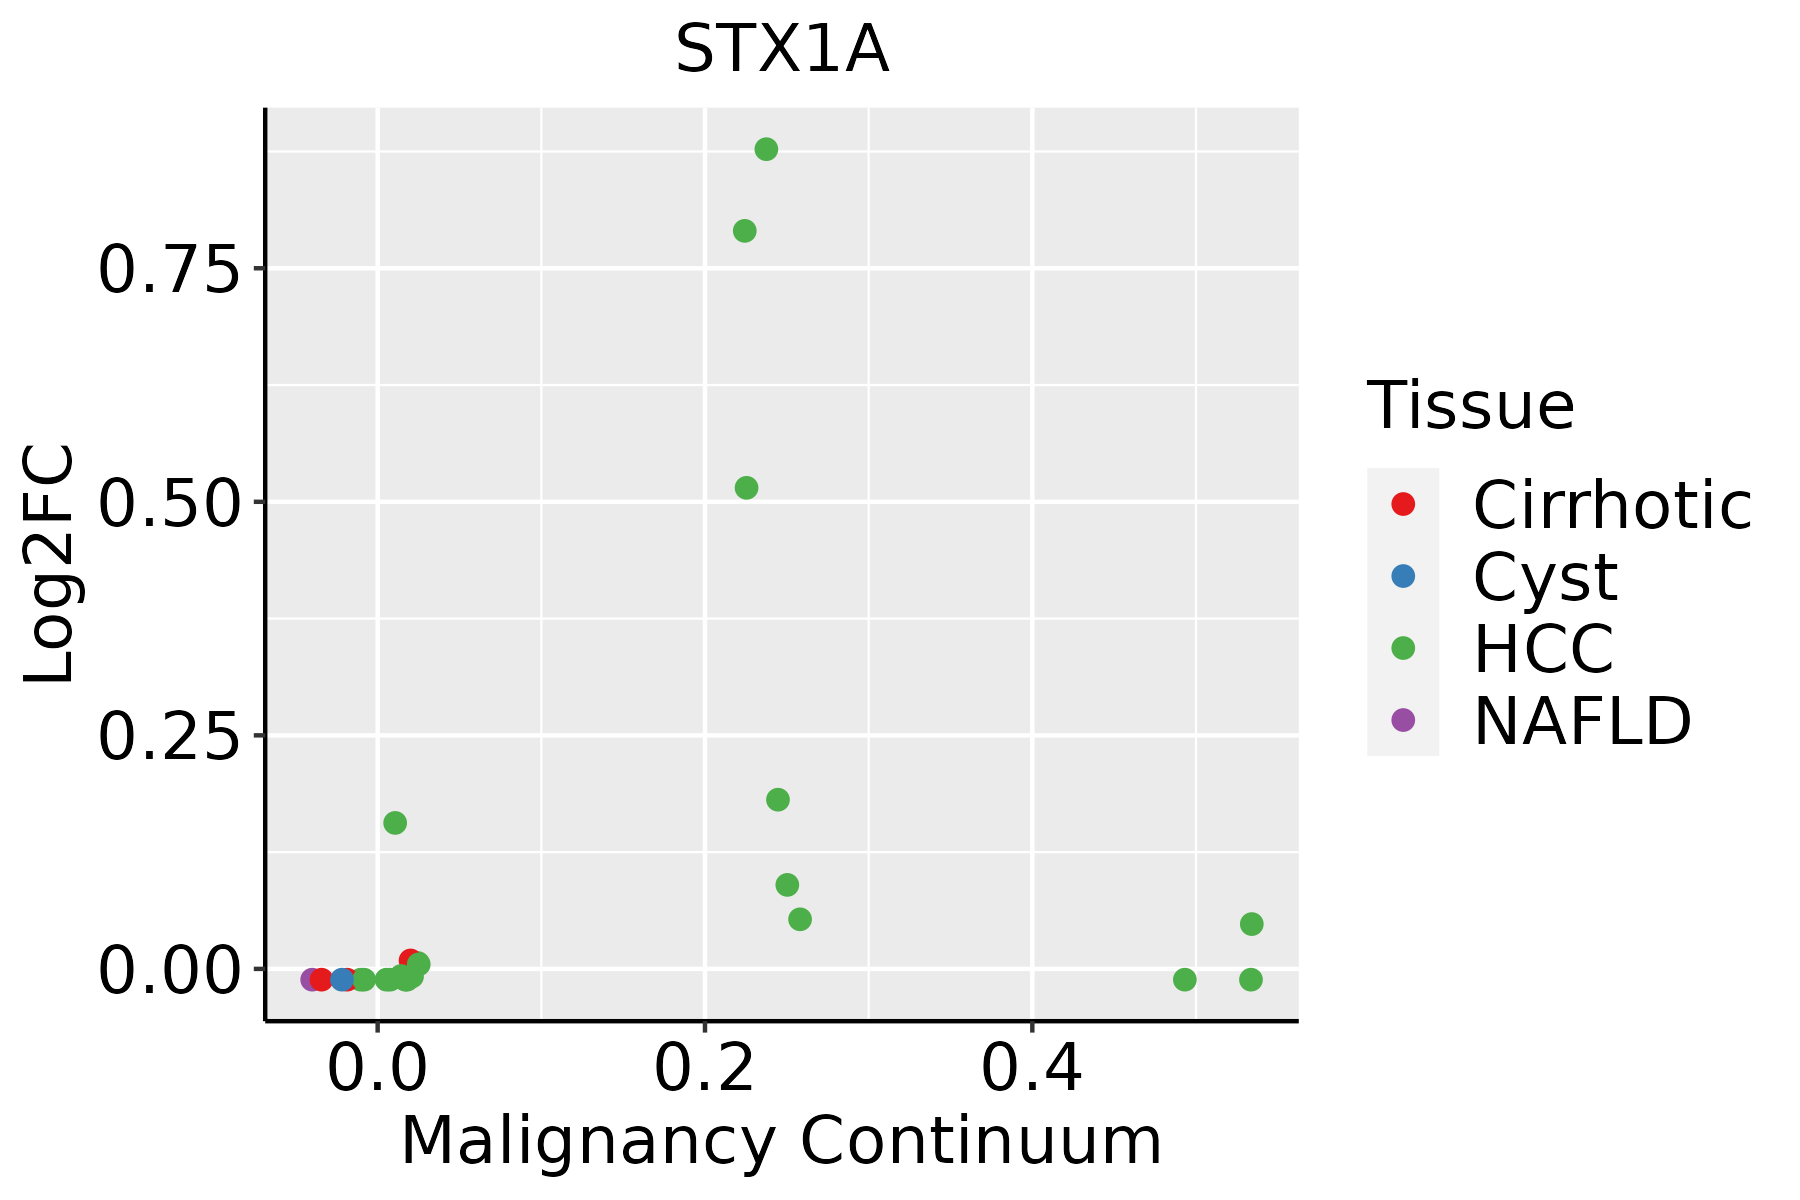 | HCC: Hepatocellular carcinoma |
| NAFLD: Non-alcoholic fatty liver disease |
| ∗log2FC in expression of this searched gene in stem-like cells from each diseased tissue sample relative to stem-like cells in normal samples in each tissue plotted against the malignancy continuum. Samples are colored based on if they are from different disease stage. |
Top |
Malignant transformation related pathway analysis |
| Find out the enriched GO biological processes and KEGG pathways involved in transition from healthy to precancer to cancer |
| Tissue | Disease Stage | Enriched GO biological Processes |
| Colorectum | AD |  |
| Colorectum | SER |  |
| Colorectum | MSS |  |
| Colorectum | MSI-H |  |
| Colorectum | FAP |  |
| ∗Top 15 enriched GO BP terms are showed in the bar plot of each disease state in each tissue. Each row represents a significant GO biological process which is colored according to the -log10(p.adjust). |
| Page: 1 2 3 4 5 6 7 8 9 |
| GO ID | Tissue | Disease Stage | Description | Gene Ratio | Bg Ratio | pvalue | p.adjust | Count |
| GO:001820514 | Esophagus | ESCC | peptidyl-lysine modification | 259/8552 | 376/18723 | 3.90e-20 | 5.26e-18 | 259 |
| GO:001605014 | Esophagus | ESCC | vesicle organization | 211/8552 | 300/18723 | 2.85e-18 | 2.87e-16 | 211 |
| GO:0043254111 | Esophagus | ESCC | regulation of protein-containing complex assembly | 278/8552 | 428/18723 | 3.81e-16 | 2.77e-14 | 278 |
| GO:00482844 | Esophagus | ESCC | organelle fusion | 94/8552 | 141/18723 | 3.72e-07 | 5.16e-06 | 94 |
| GO:00224069 | Esophagus | ESCC | membrane docking | 62/8552 | 86/18723 | 5.93e-07 | 7.79e-06 | 62 |
| GO:001692512 | Esophagus | ESCC | protein sumoylation | 41/8552 | 53/18723 | 2.49e-06 | 2.86e-05 | 41 |
| GO:00901743 | Esophagus | ESCC | organelle membrane fusion | 73/8552 | 110/18723 | 9.29e-06 | 8.88e-05 | 73 |
| GO:00069063 | Esophagus | ESCC | vesicle fusion | 70/8552 | 106/18723 | 1.82e-05 | 1.60e-04 | 70 |
| GO:01400567 | Esophagus | ESCC | organelle localization by membrane tethering | 53/8552 | 77/18723 | 3.33e-05 | 2.74e-04 | 53 |
| GO:00610254 | Esophagus | ESCC | membrane fusion | 98/8552 | 163/18723 | 1.39e-04 | 9.41e-04 | 98 |
| GO:00482781 | Esophagus | ESCC | vesicle docking | 38/8552 | 59/18723 | 2.86e-03 | 1.21e-02 | 38 |
| GO:000930617 | Esophagus | ESCC | protein secretion | 190/8552 | 359/18723 | 3.22e-03 | 1.34e-02 | 190 |
| GO:003559217 | Esophagus | ESCC | establishment of protein localization to extracellular region | 190/8552 | 360/18723 | 3.77e-03 | 1.53e-02 | 190 |
| GO:007169210 | Esophagus | ESCC | protein localization to extracellular region | 193/8552 | 368/18723 | 5.01e-03 | 1.92e-02 | 193 |
| GO:005070810 | Esophagus | ESCC | regulation of protein secretion | 142/8552 | 268/18723 | 9.31e-03 | 3.24e-02 | 142 |
| GO:004325422 | Liver | HCC | regulation of protein-containing complex assembly | 264/7958 | 428/18723 | 5.47e-16 | 4.39e-14 | 264 |
| GO:001605021 | Liver | HCC | vesicle organization | 194/7958 | 300/18723 | 5.58e-15 | 3.97e-13 | 194 |
| GO:00182052 | Liver | HCC | peptidyl-lysine modification | 230/7958 | 376/18723 | 1.51e-13 | 8.32e-12 | 230 |
| GO:002240611 | Liver | HCC | membrane docking | 57/7958 | 86/18723 | 7.14e-06 | 8.47e-05 | 57 |
| GO:004828411 | Liver | HCC | organelle fusion | 84/7958 | 141/18723 | 3.13e-05 | 3.20e-04 | 84 |
| Page: 1 2 |
| Pathway ID | Tissue | Disease Stage | Description | Gene Ratio | Bg Ratio | pvalue | p.adjust | qvalue | Count |
| hsa05016210 | Esophagus | ESCC | Huntington disease | 226/4205 | 306/8465 | 1.38e-18 | 8.72e-17 | 4.46e-17 | 226 |
| hsa05022210 | Esophagus | ESCC | Pathways of neurodegeneration - multiple diseases | 318/4205 | 476/8465 | 6.10e-15 | 2.04e-13 | 1.05e-13 | 318 |
| hsa0501638 | Esophagus | ESCC | Huntington disease | 226/4205 | 306/8465 | 1.38e-18 | 8.72e-17 | 4.46e-17 | 226 |
| hsa0502238 | Esophagus | ESCC | Pathways of neurodegeneration - multiple diseases | 318/4205 | 476/8465 | 6.10e-15 | 2.04e-13 | 1.05e-13 | 318 |
| hsa0501622 | Liver | HCC | Huntington disease | 219/4020 | 306/8465 | 3.06e-18 | 3.42e-16 | 1.90e-16 | 219 |
| hsa0502222 | Liver | HCC | Pathways of neurodegeneration - multiple diseases | 298/4020 | 476/8465 | 6.59e-12 | 1.30e-10 | 7.22e-11 | 298 |
| hsa0501632 | Liver | HCC | Huntington disease | 219/4020 | 306/8465 | 3.06e-18 | 3.42e-16 | 1.90e-16 | 219 |
| hsa0502232 | Liver | HCC | Pathways of neurodegeneration - multiple diseases | 298/4020 | 476/8465 | 6.59e-12 | 1.30e-10 | 7.22e-11 | 298 |
| Page: 1 |
Top |
Cell-cell communication analysis |
| Identification of potential cell-cell interactions between two cell types and their ligand-receptor pairs for different disease states |
| Ligand | Receptor | LRpair | Pathway | Tissue | Disease Stage |
| Page: 1 |
Top |
Single-cell gene regulatory network inference analysis |
| Find out the significant the regulons (TFs) and the target genes of each regulon across cell types for different disease states |
| TF | Cell Type | Tissue | Disease Stage | Target Gene | RSS | Regulon Activity |
| ∗The dot plots of a searched regulon are shown for all cell subpopulations in each disease state of each tissue based on the regulon specific score inferred using pySCENIC and by calculating the average expression. |
| Page: 1 |
Top |
Somatic mutation of malignant transformation related genes |
| Annotation of somatic variants for genes involved in malignant transformation |
| Hugo Symbol | Variant Class | Variant Classification | dbSNP RS | HGVSc | HGVSp | HGVSp Short | SWISSPROT | BIOTYPE | SIFT | PolyPhen | Tumor Sample Barcode | Tissue | Histology | Sex | Age | Stage | Therapy Types | Drugs | Outcome |
| STX1A | SNV | Missense_Mutation | c.99N>G | p.Phe33Leu | p.F33L | Q16623 | protein_coding | deleterious(0.01) | probably_damaging(0.979) | TCGA-AC-A23H-01 | Breast | breast invasive carcinoma | Female | >=65 | I/II | Unknown | Unknown | PD | |
| STX1A | SNV | Missense_Mutation | novel | c.122G>A | p.Arg41Gln | p.R41Q | Q16623 | protein_coding | tolerated(0.05) | benign(0.34) | TCGA-AN-A046-01 | Breast | breast invasive carcinoma | Female | >=65 | I/II | Unknown | Unknown | SD |
| STX1A | SNV | Missense_Mutation | novel | c.31N>T | p.Ala11Ser | p.A11S | Q16623 | protein_coding | deleterious(0.04) | benign(0.115) | TCGA-AO-A0J5-01 | Breast | breast invasive carcinoma | Female | <65 | III/IV | Other, specify in notesBisphosphonate | zoledronic | PD |
| STX1A | SNV | Missense_Mutation | c.367N>G | p.Leu123Val | p.L123V | Q16623 | protein_coding | deleterious(0) | probably_damaging(0.923) | TCGA-AR-A251-01 | Breast | breast invasive carcinoma | Female | <65 | III/IV | Chemotherapy | doxorubicin | SD | |
| STX1A | SNV | Missense_Mutation | novel | c.858N>G | p.Ile286Met | p.I286M | Q16623 | protein_coding | tolerated_low_confidence(0.06) | possibly_damaging(0.553) | TCGA-Z7-A8R6-01 | Breast | breast invasive carcinoma | Female | <65 | I/II | Chemotherapy | taxol | CR |
| STX1A | insertion | Nonsense_Mutation | novel | c.32_33insTTGATCTCCTGACCTCGTGATCCA | p.Ala11_Lys12insTer | p.A11_K12ins* | Q16623 | protein_coding | TCGA-AO-A0J5-01 | Breast | breast invasive carcinoma | Female | <65 | III/IV | Other, specify in notesBisphosphonate | zoledronic | PD | ||
| STX1A | SNV | Missense_Mutation | novel | c.37G>A | p.Asp13Asn | p.D13N | Q16623 | protein_coding | tolerated(0.22) | benign(0.205) | TCGA-2W-A8YY-01 | Cervix | cervical & endocervical cancer | Female | <65 | I/II | Chemotherapy | cisplatin | CR |
| STX1A | SNV | Missense_Mutation | novel | c.580G>A | p.Glu194Lys | p.E194K | Q16623 | protein_coding | deleterious(0) | probably_damaging(0.919) | TCGA-AA-3977-01 | Colorectum | colon adenocarcinoma | Male | >=65 | I/II | Unknown | Unknown | SD |
| STX1A | SNV | Missense_Mutation | novel | c.169A>G | p.Lys57Glu | p.K57E | Q16623 | protein_coding | tolerated(0.09) | benign(0.203) | TCGA-CM-5860-01 | Colorectum | colon adenocarcinoma | Male | <65 | I/II | Ancillary | leucovorin | SD |
| STX1A | SNV | Missense_Mutation | c.658G>A | p.Ala220Thr | p.A220T | Q16623 | protein_coding | deleterious(0) | probably_damaging(0.99) | TCGA-CM-6674-01 | Colorectum | colon adenocarcinoma | Male | <65 | I/II | Unknown | Unknown | SD |
| Page: 1 2 3 4 |
Top |
Related drugs of malignant transformation related genes |
| Identification of chemicals and drugs interact with genes involved in malignant transfromation |
| (DGIdb 4.0) |
| Entrez ID | Symbol | Category | Interaction Types | Drug Claim Name | Drug Name | PMIDs |
| Page: 1 |

Copyright 2023-Present -The University of Texas Health Science Center at Houston |