
|
|||||
|
 | |
| |
| |
| |
| |
| |
|
Gene: STX18 |
Gene summary for STX18 |
| Gene information | Species | Human | Gene symbol | STX18 | Gene ID | 53407 |
| Gene name | syntaxin 18 | |
| Gene Alias | Ufe1 | |
| Cytomap | 4p16.3-p16.2 | |
| Gene Type | protein-coding | GO ID | GO:0006810 | UniProtAcc | Q9P2W9 |
Top |
Malignant transformation analysis |
| Identification of the aberrant gene expression in precancerous and cancerous lesions by comparing the gene expression of stem-like cells in diseased tissues with normal stem cells |
| Entrez ID | Symbol | Replicates | Species | Organ | Tissue | Adj P-value | Log2FC | Malignancy |
| 53407 | STX18 | sample3 | Human | Cervix | CC | 4.66e-02 | -1.25e-01 | 0.1387 |
| 53407 | STX18 | H2 | Human | Cervix | HSIL_HPV | 9.18e-16 | 5.42e-01 | 0.0632 |
| 53407 | STX18 | T1 | Human | Cervix | CC | 4.20e-02 | -1.33e-01 | 0.0918 |
| 53407 | STX18 | AEH-subject1 | Human | Endometrium | AEH | 1.90e-11 | 4.63e-01 | -0.3059 |
| 53407 | STX18 | AEH-subject2 | Human | Endometrium | AEH | 3.61e-03 | 1.74e-01 | -0.2525 |
| 53407 | STX18 | AEH-subject3 | Human | Endometrium | AEH | 1.43e-42 | 7.98e-01 | -0.2576 |
| 53407 | STX18 | AEH-subject4 | Human | Endometrium | AEH | 6.19e-07 | 3.91e-01 | -0.2657 |
| 53407 | STX18 | AEH-subject5 | Human | Endometrium | AEH | 6.96e-12 | 5.73e-01 | -0.2953 |
| 53407 | STX18 | EEC-subject1 | Human | Endometrium | EEC | 2.68e-11 | 3.80e-01 | -0.2682 |
| 53407 | STX18 | EEC-subject3 | Human | Endometrium | EEC | 8.10e-12 | -3.02e-01 | -0.2525 |
| 53407 | STX18 | EEC-subject4 | Human | Endometrium | EEC | 5.28e-09 | 4.15e-01 | -0.2571 |
| 53407 | STX18 | EEC-subject5 | Human | Endometrium | EEC | 3.05e-08 | 4.50e-01 | -0.249 |
| 53407 | STX18 | GSM5276934 | Human | Endometrium | EEC | 1.37e-27 | -6.24e-01 | -0.0913 |
| 53407 | STX18 | GSM5276937 | Human | Endometrium | EEC | 7.38e-03 | -3.41e-01 | -0.0897 |
| 53407 | STX18 | GSM6177620_NYU_UCEC1_lib1_lib1 | Human | Endometrium | EEC | 1.09e-14 | -2.30e-01 | -0.1869 |
| 53407 | STX18 | GSM6177620_NYU_UCEC1_lib2_lib2 | Human | Endometrium | EEC | 7.30e-15 | -2.17e-01 | -0.1875 |
| 53407 | STX18 | GSM6177620_NYU_UCEC1_lib3_lib3 | Human | Endometrium | EEC | 2.71e-14 | -1.97e-01 | -0.1883 |
| 53407 | STX18 | GSM6177621_NYU_UCEC2_lib1_lib1 | Human | Endometrium | EEC | 3.20e-05 | 1.26e-02 | -0.1934 |
| 53407 | STX18 | GSM6177622_NYU_UCEC3_lib1_lib1 | Human | Endometrium | EEC | 2.91e-27 | -9.64e-02 | -0.1917 |
| 53407 | STX18 | GSM6177622_NYU_UCEC3_lib2_lib2 | Human | Endometrium | EEC | 4.56e-22 | -3.72e-02 | -0.1916 |
| Page: 1 2 3 4 5 6 |
| Tissue | Expression Dynamics | Abbreviation |
| Cervix | 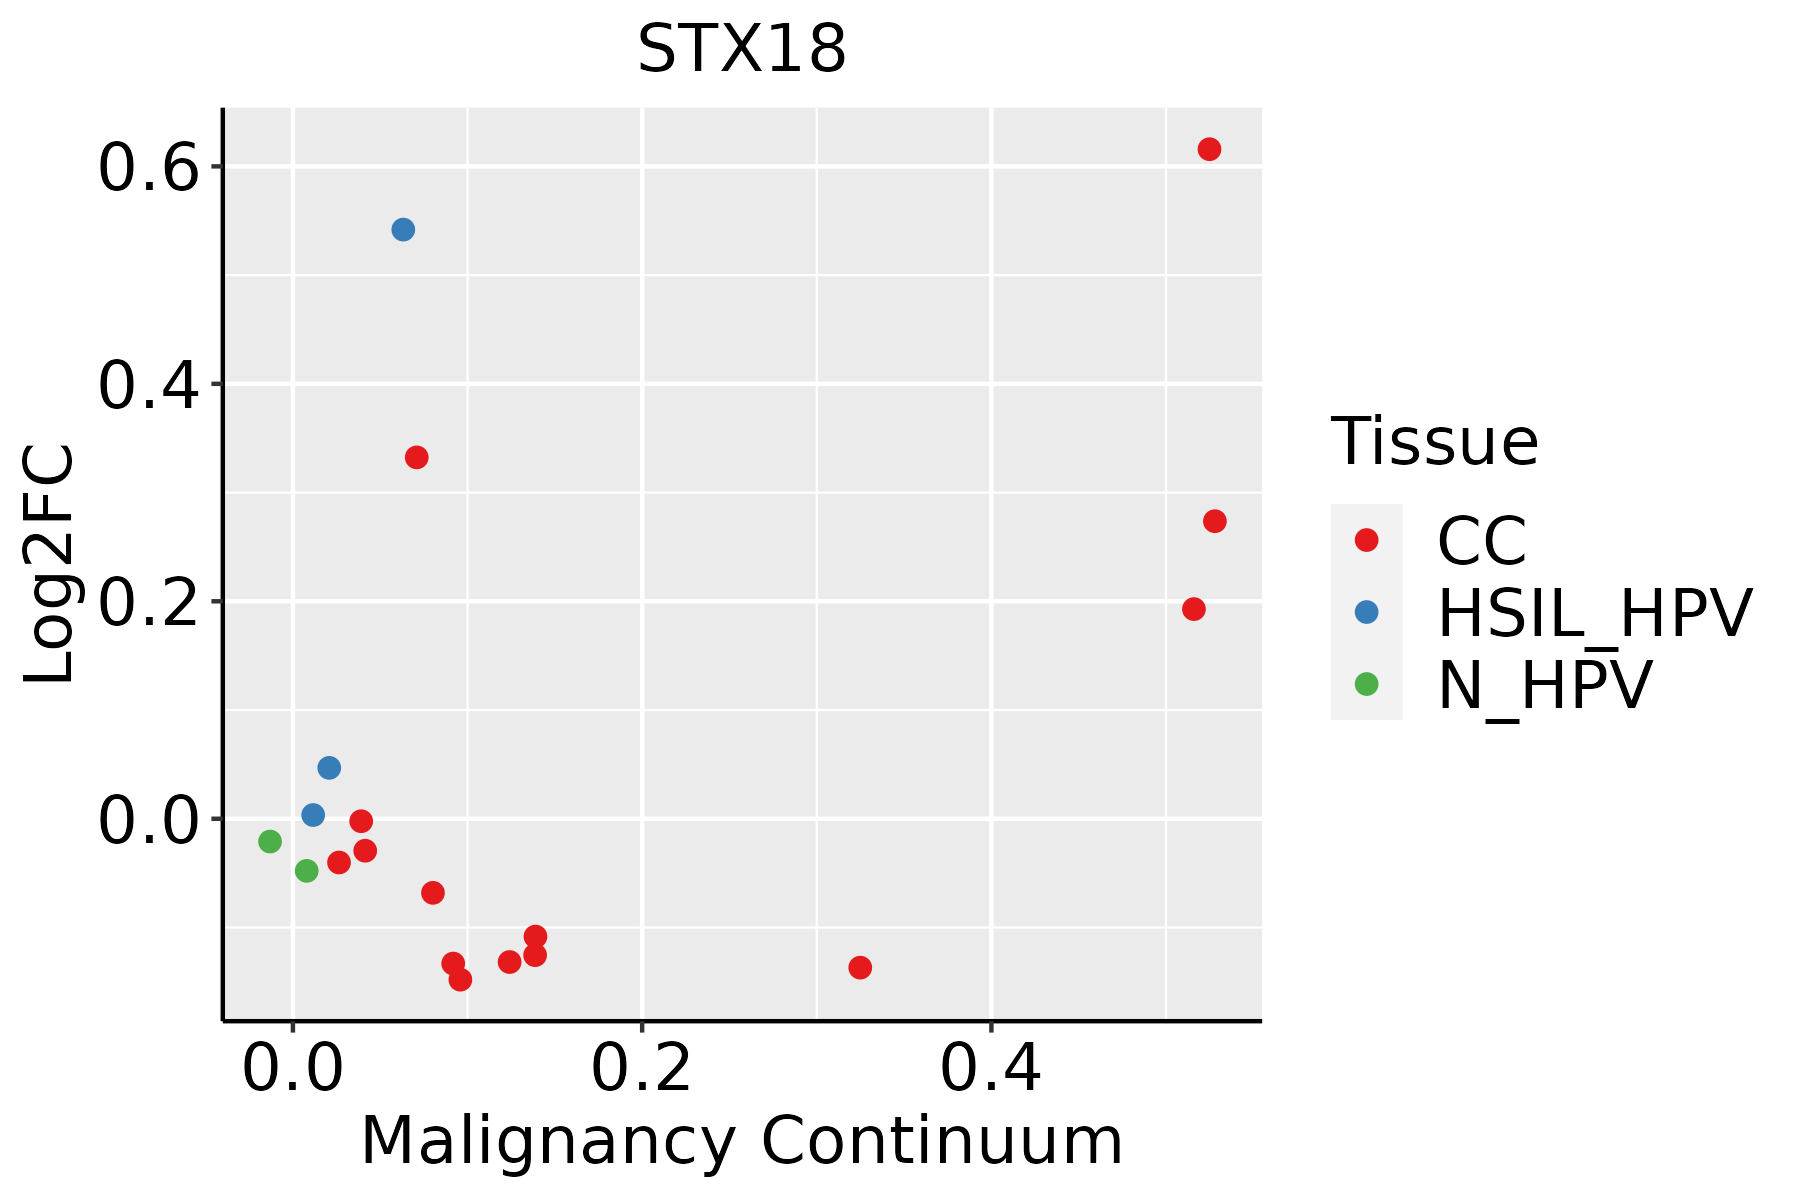 | CC: Cervix cancer |
| HSIL_HPV: HPV-infected high-grade squamous intraepithelial lesions | ||
| N_HPV: HPV-infected normal cervix | ||
| Endometrium | 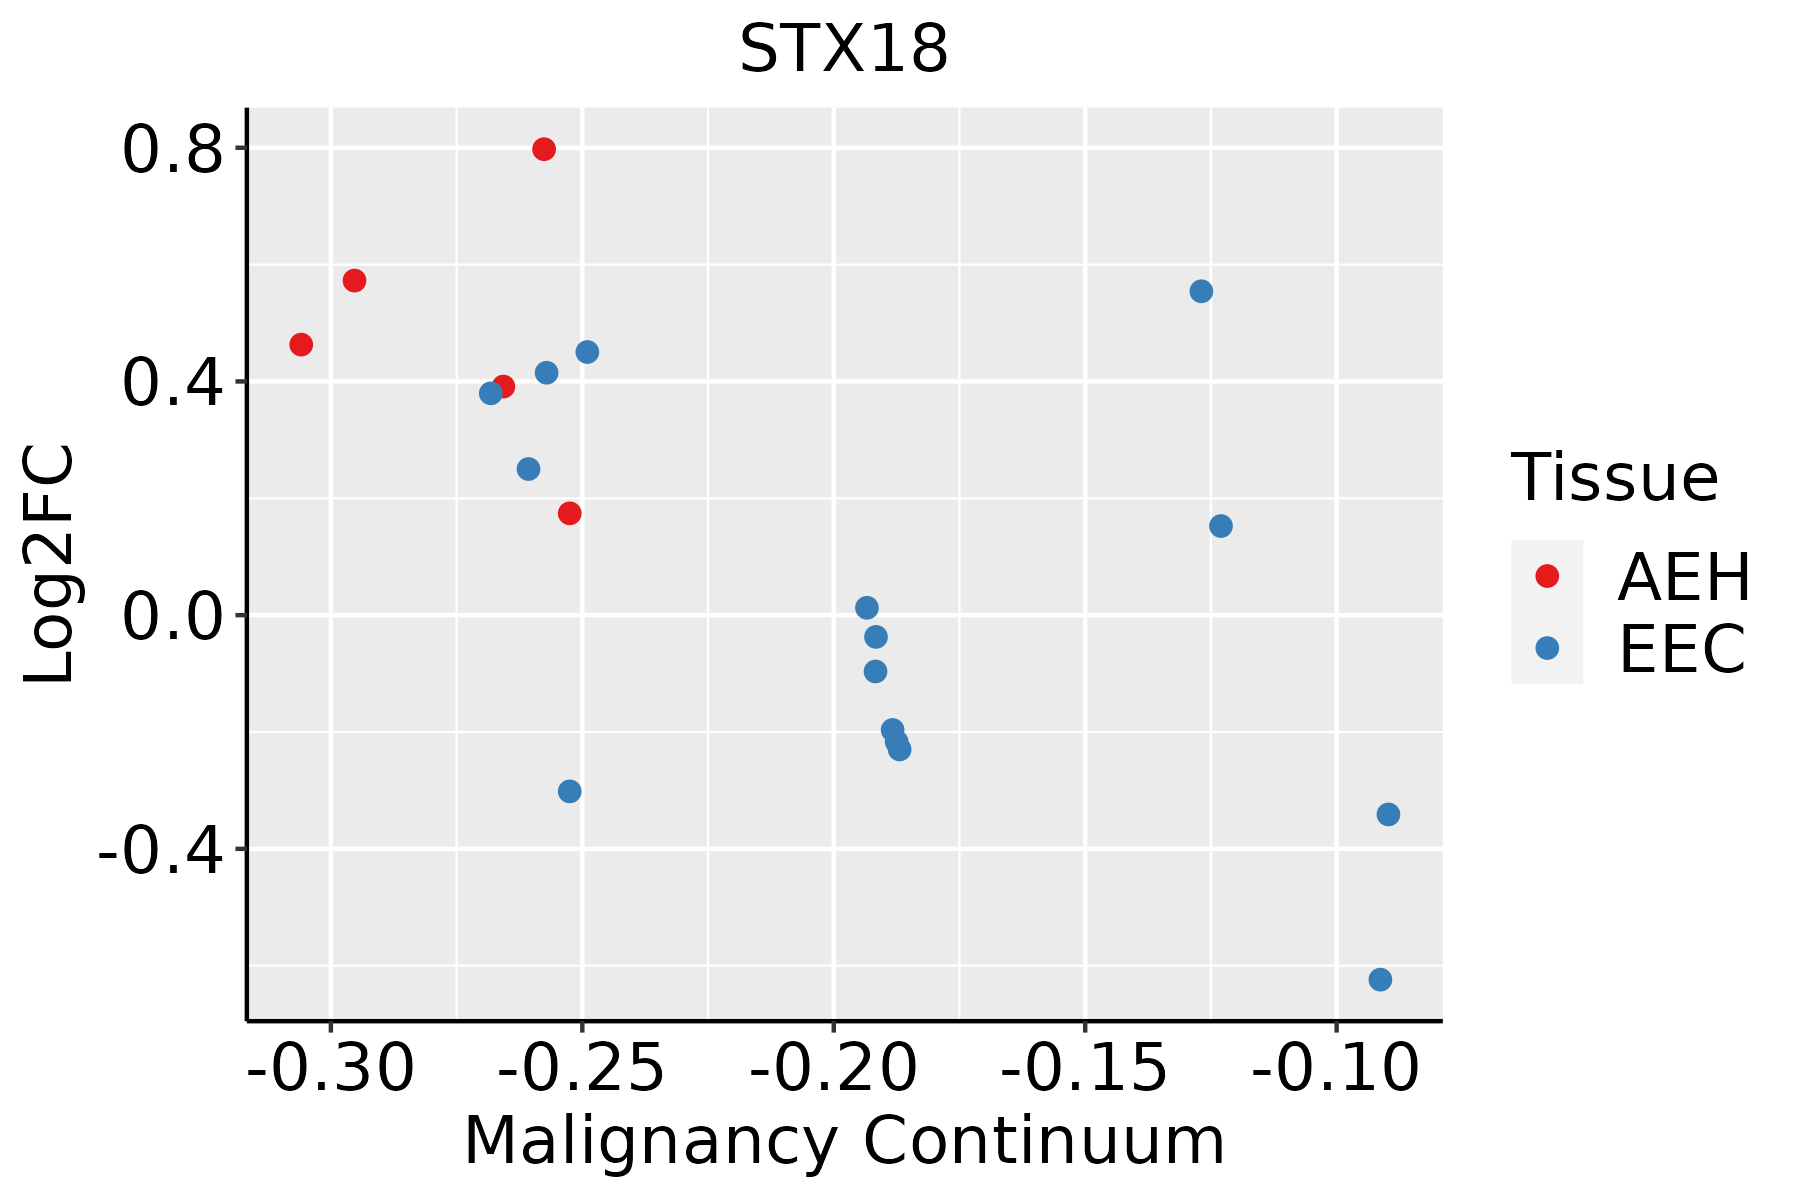 | AEH: Atypical endometrial hyperplasia |
| EEC: Endometrioid Cancer | ||
| Esophagus | 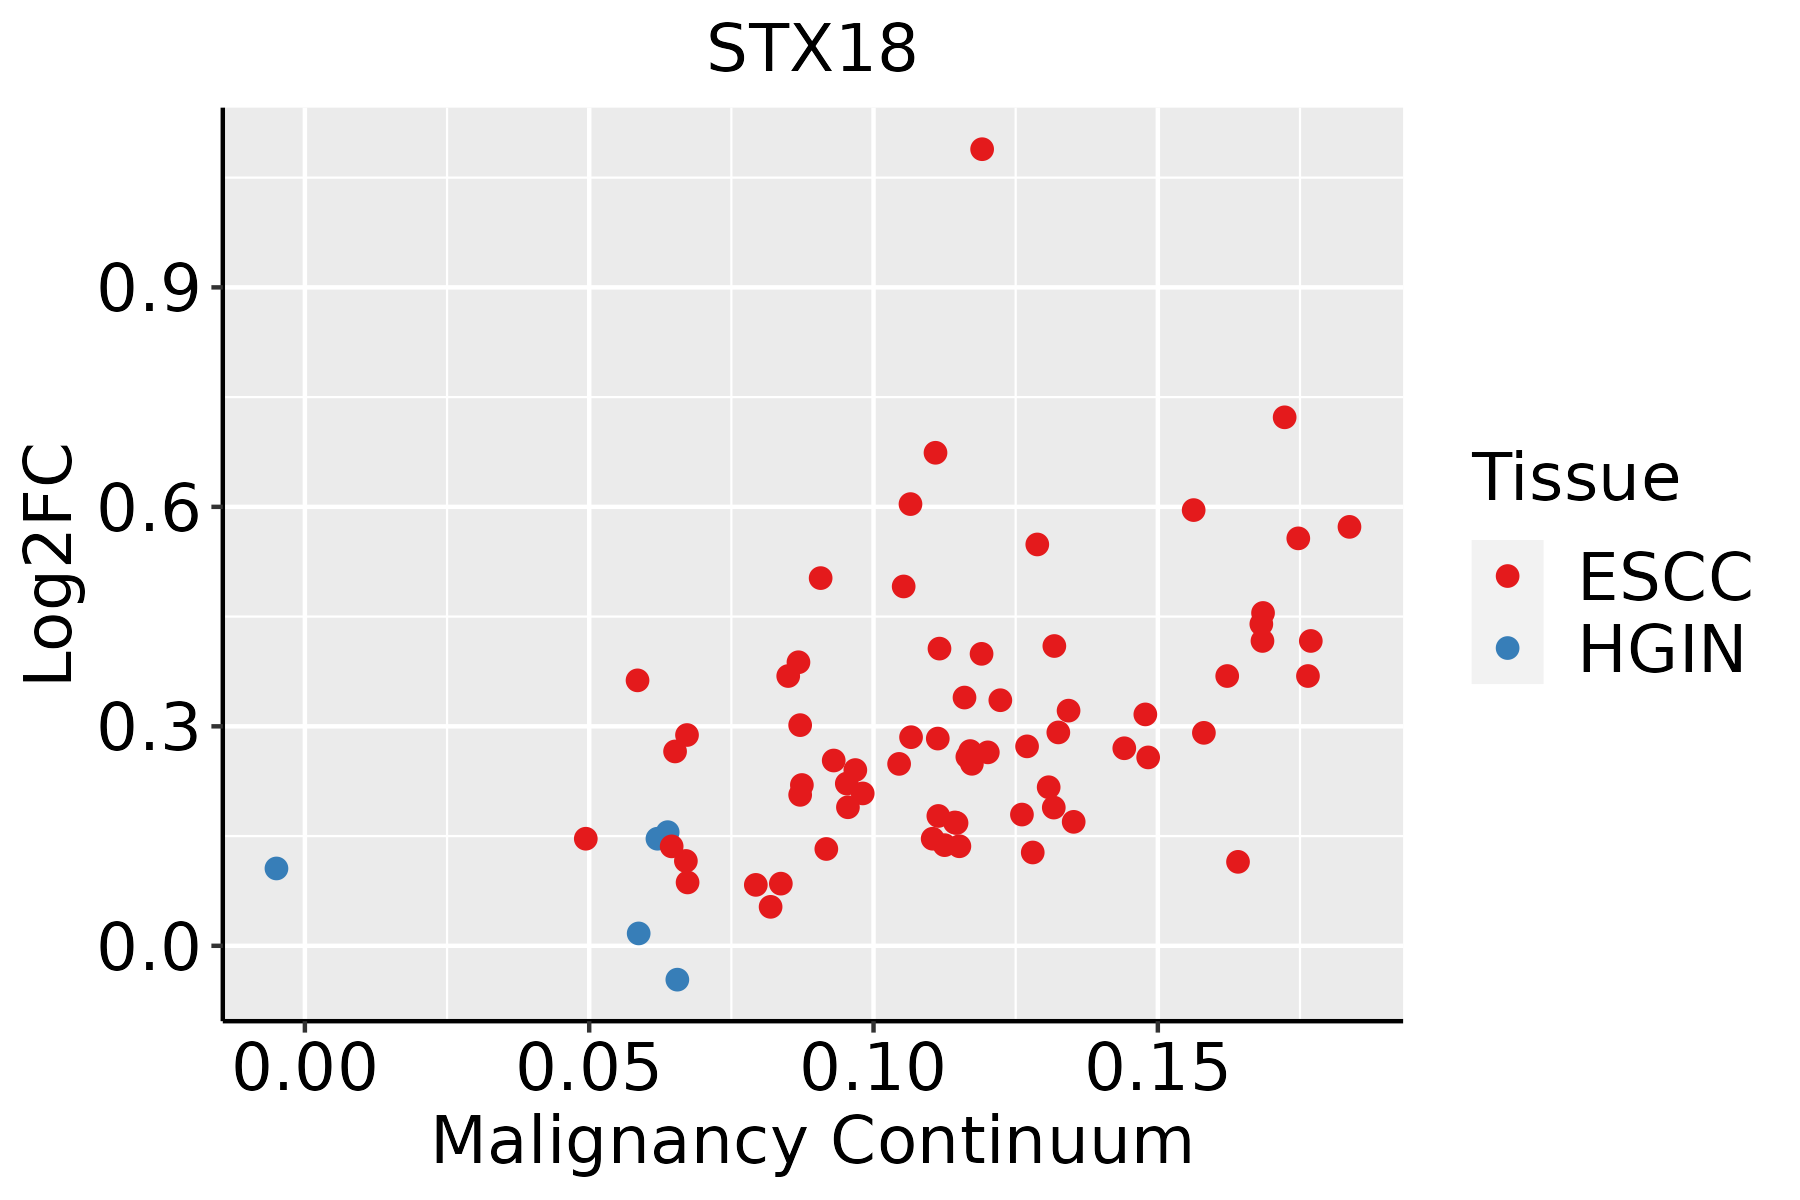 | ESCC: Esophageal squamous cell carcinoma |
| HGIN: High-grade intraepithelial neoplasias | ||
| LGIN: Low-grade intraepithelial neoplasias | ||
| Liver | 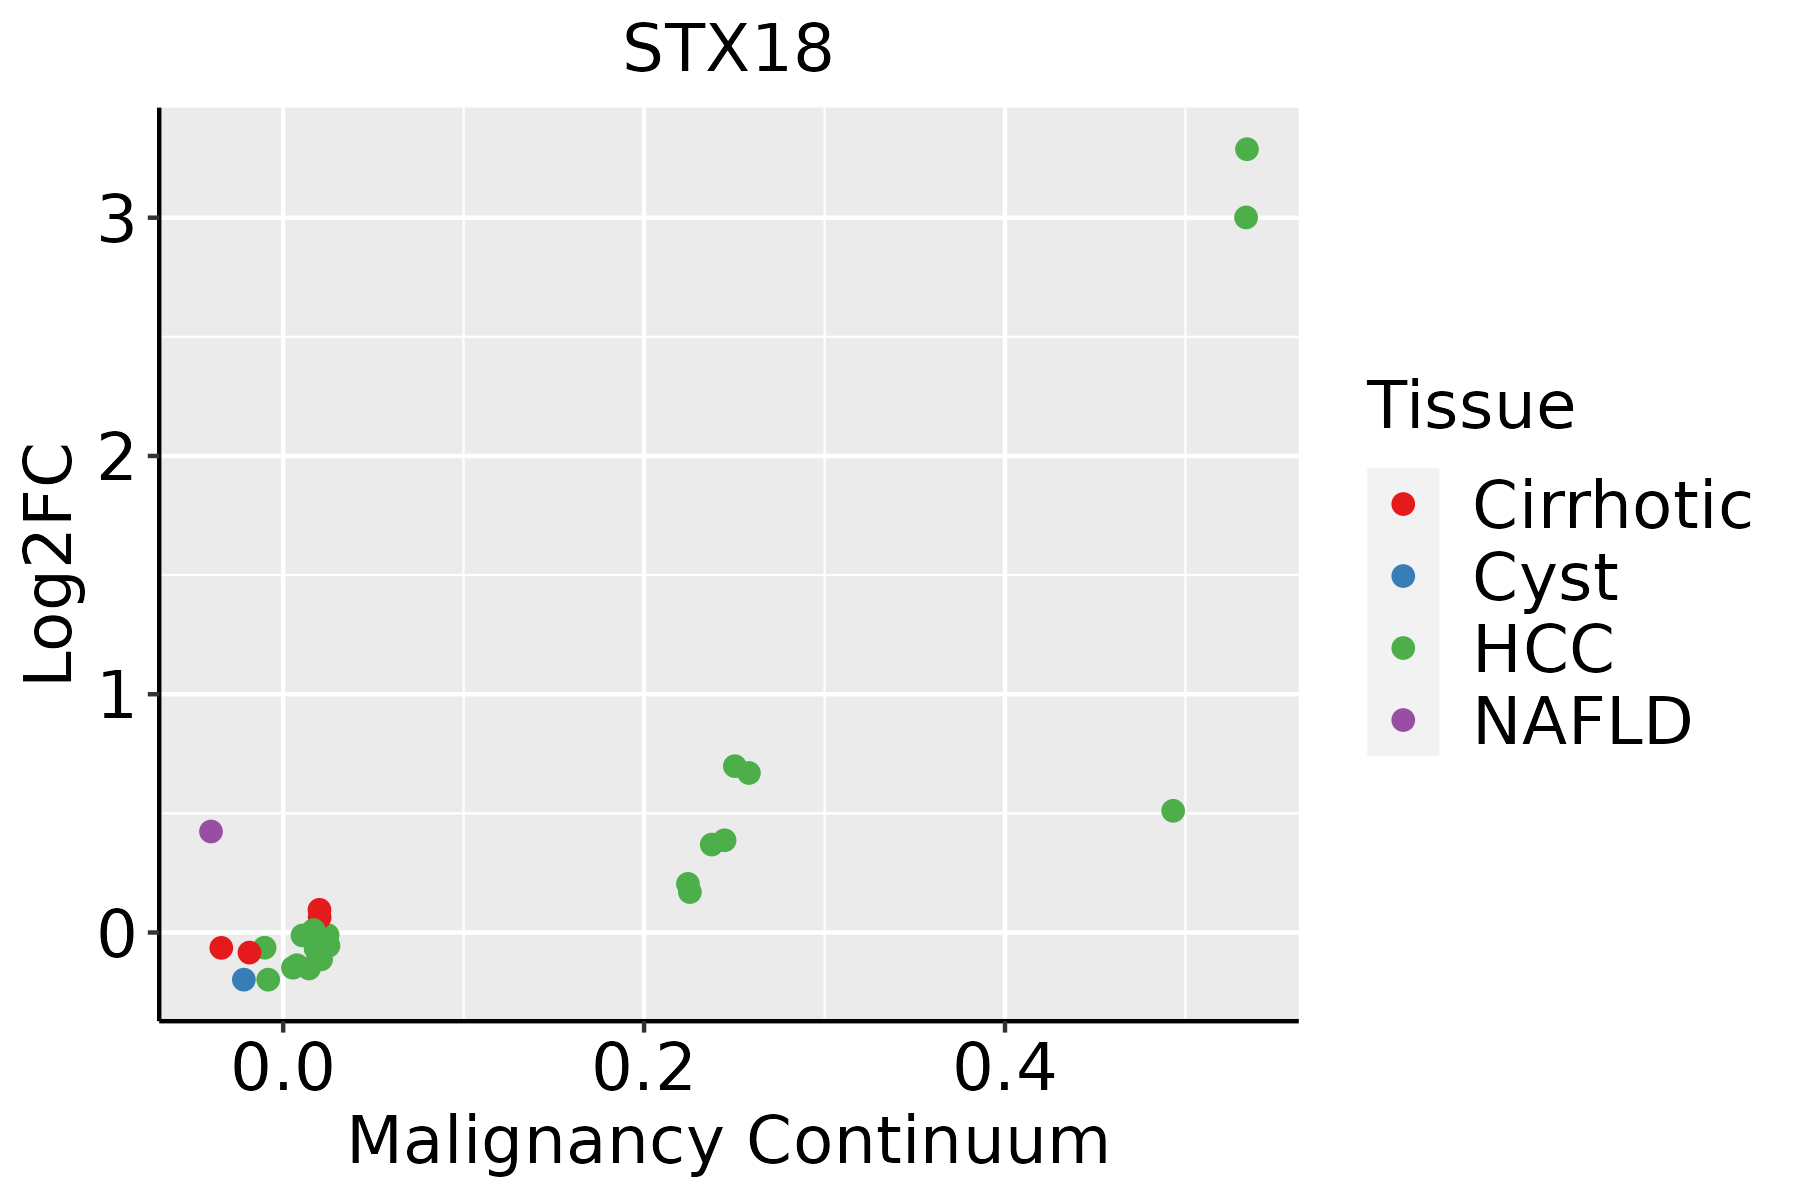 | HCC: Hepatocellular carcinoma |
| NAFLD: Non-alcoholic fatty liver disease | ||
| Oral Cavity | 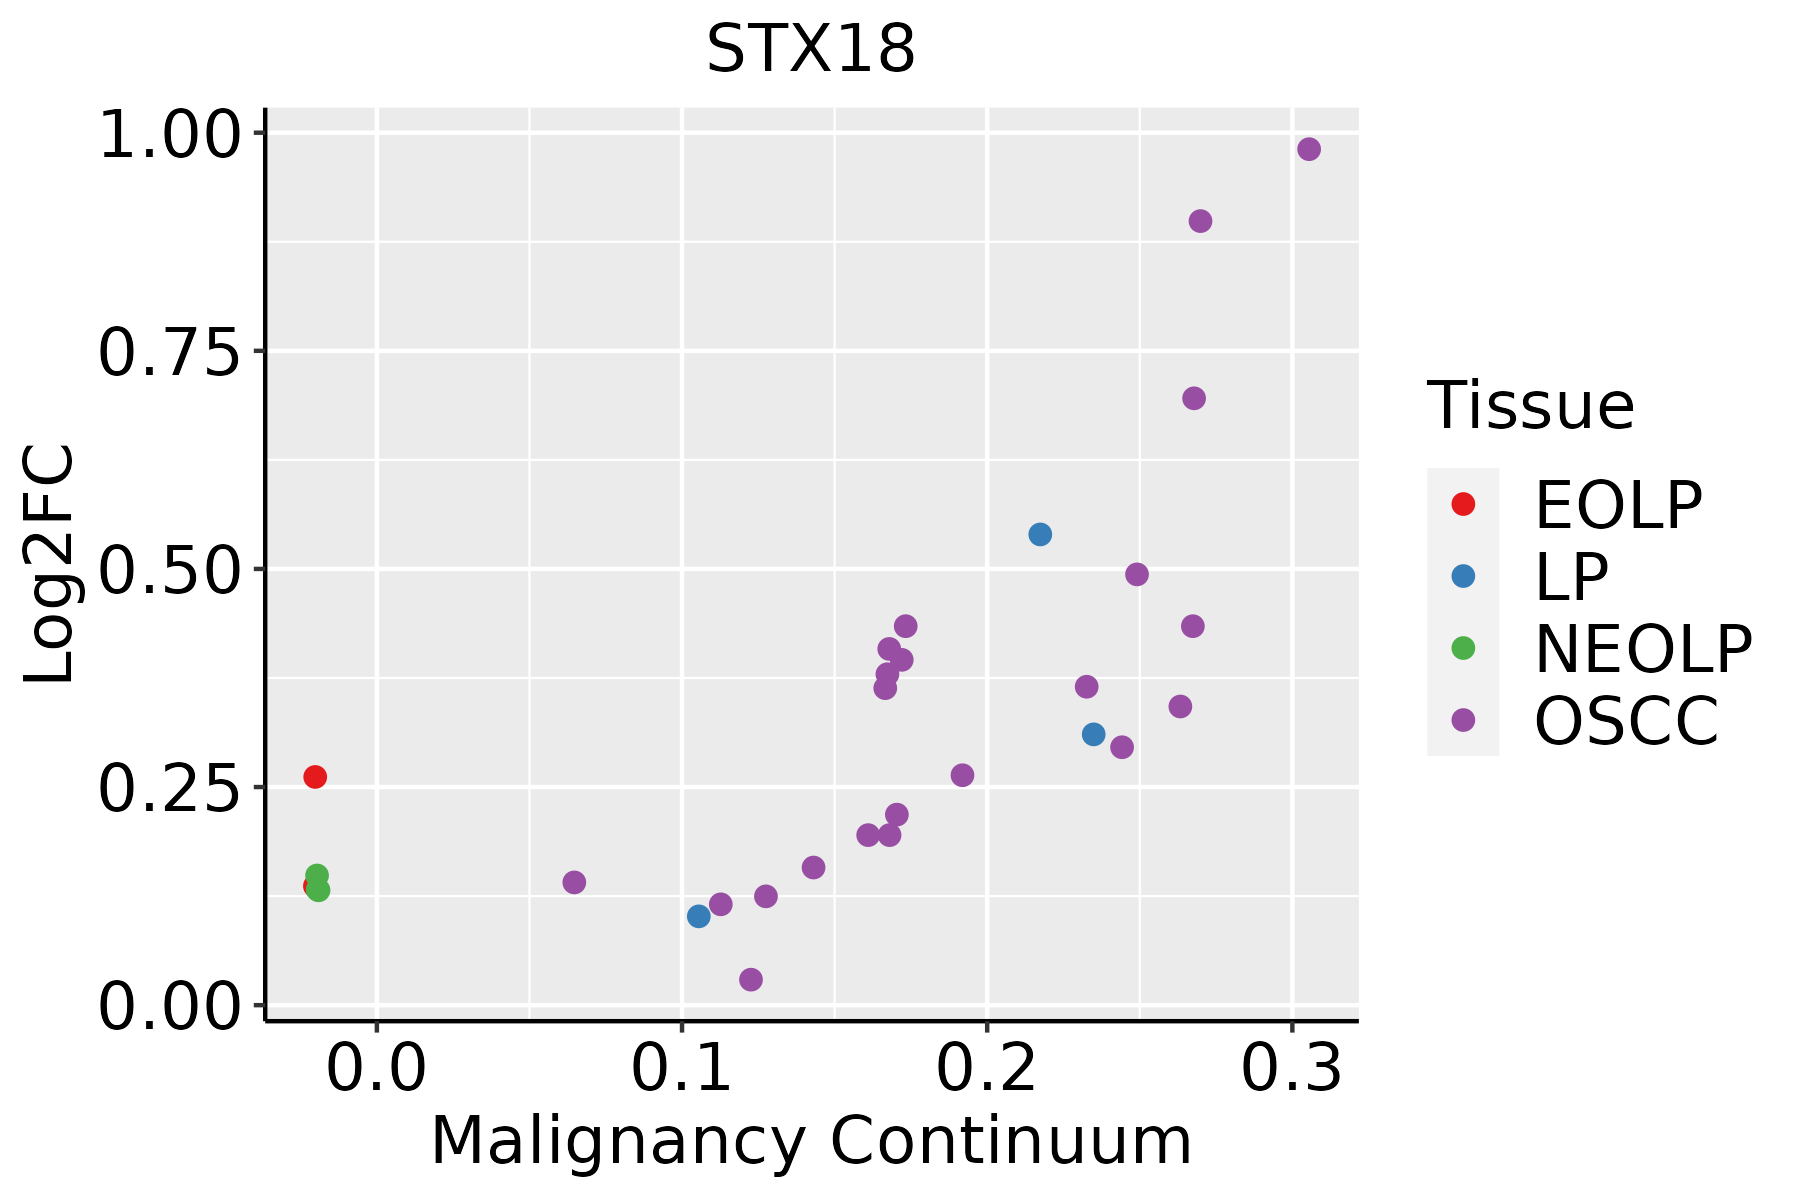 | EOLP: Erosive Oral lichen planus |
| LP: leukoplakia | ||
| NEOLP: Non-erosive oral lichen planus | ||
| OSCC: Oral squamous cell carcinoma | ||
| Thyroid | 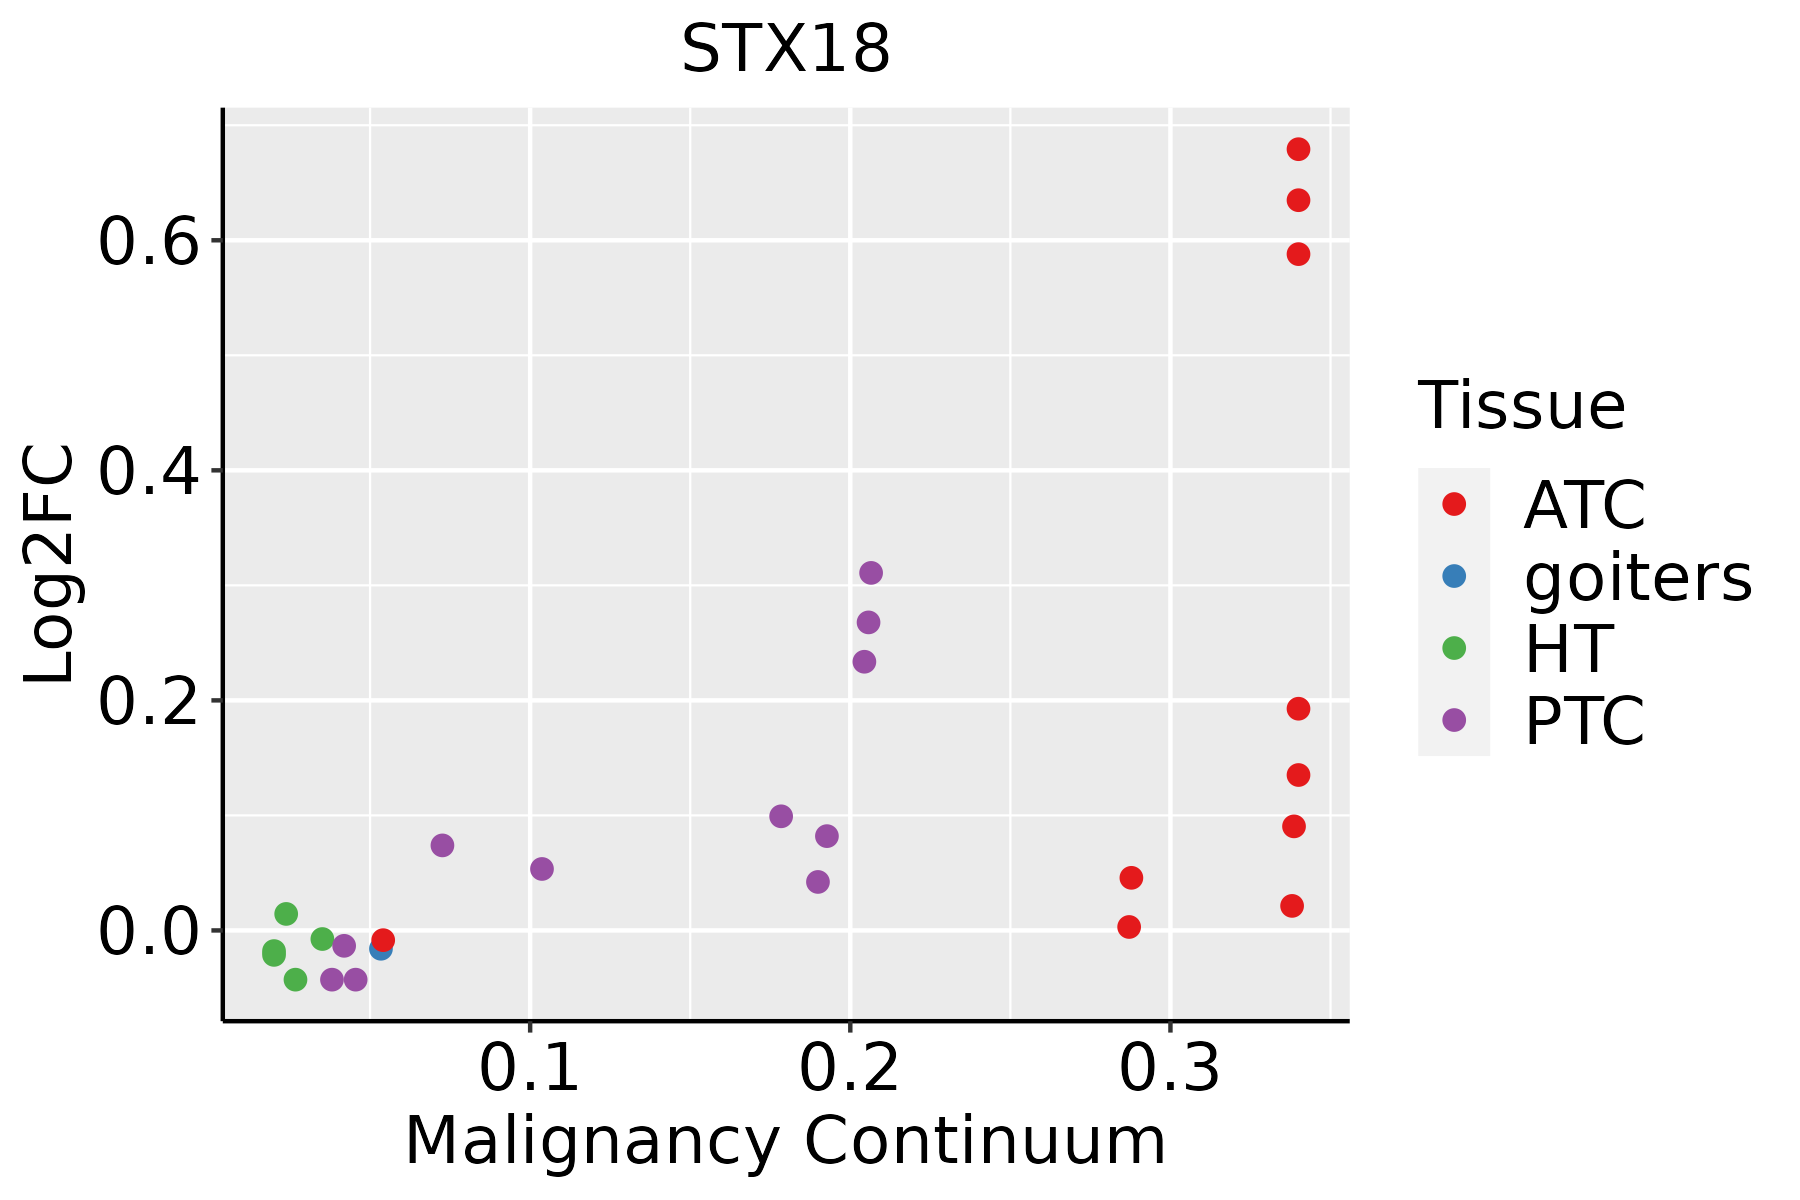 | ATC: Anaplastic thyroid cancer |
| HT: Hashimoto's thyroiditis | ||
| PTC: Papillary thyroid cancer |
| ∗log2FC in expression of this searched gene in stem-like cells from each diseased tissue sample relative to stem-like cells in normal samples in each tissue plotted against the malignancy continuum. Samples are colored based on if they are from different disease stage. |
Top |
Malignant transformation related pathway analysis |
| Find out the enriched GO biological processes and KEGG pathways involved in transition from healthy to precancer to cancer |
| Tissue | Disease Stage | Enriched GO biological Processes |
| Colorectum | AD |  |
| Colorectum | SER |  |
| Colorectum | MSS |  |
| Colorectum | MSI-H |  |
| Colorectum | FAP |  |
| ∗Top 15 enriched GO BP terms are showed in the bar plot of each disease state in each tissue. Each row represents a significant GO biological process which is colored according to the -log10(p.adjust). |
| Page: 1 2 3 4 5 6 7 8 9 |
| GO ID | Tissue | Disease Stage | Description | Gene Ratio | Bg Ratio | pvalue | p.adjust | Count |
| GO:00323868 | Cervix | CC | regulation of intracellular transport | 71/2311 | 337/18723 | 3.70e-06 | 9.74e-05 | 71 |
| GO:00323889 | Cervix | CC | positive regulation of intracellular transport | 46/2311 | 202/18723 | 2.45e-05 | 4.24e-04 | 46 |
| GO:00481938 | Cervix | CC | Golgi vesicle transport | 58/2311 | 296/18723 | 2.24e-04 | 2.54e-03 | 58 |
| GO:19021153 | Cervix | CC | regulation of organelle assembly | 40/2311 | 186/18723 | 2.92e-04 | 3.15e-03 | 40 |
| GO:19021171 | Cervix | CC | positive regulation of organelle assembly | 19/2311 | 67/18723 | 3.42e-04 | 3.58e-03 | 19 |
| GO:00068907 | Cervix | CC | retrograde vesicle-mediated transport, Golgi to endoplasmic reticulum | 15/2311 | 52/18723 | 1.15e-03 | 9.39e-03 | 15 |
| GO:19033583 | Cervix | CC | regulation of Golgi organization | 7/2311 | 17/18723 | 2.72e-03 | 1.85e-02 | 7 |
| GO:00070304 | Cervix | CC | Golgi organization | 32/2311 | 157/18723 | 2.78e-03 | 1.87e-02 | 32 |
| GO:003238810 | Endometrium | AEH | positive regulation of intracellular transport | 46/2100 | 202/18723 | 1.96e-06 | 5.93e-05 | 46 |
| GO:00481939 | Endometrium | AEH | Golgi vesicle transport | 60/2100 | 296/18723 | 3.65e-06 | 9.79e-05 | 60 |
| GO:00323869 | Endometrium | AEH | regulation of intracellular transport | 66/2100 | 337/18723 | 4.18e-06 | 1.10e-04 | 66 |
| GO:00068886 | Endometrium | AEH | endoplasmic reticulum to Golgi vesicle-mediated transport | 29/2100 | 130/18723 | 2.11e-04 | 2.59e-03 | 29 |
| GO:00068908 | Endometrium | AEH | retrograde vesicle-mediated transport, Golgi to endoplasmic reticulum | 15/2100 | 52/18723 | 4.20e-04 | 4.46e-03 | 15 |
| GO:00070305 | Endometrium | AEH | Golgi organization | 32/2100 | 157/18723 | 5.73e-04 | 5.69e-03 | 32 |
| GO:003238815 | Endometrium | EEC | positive regulation of intracellular transport | 46/2168 | 202/18723 | 4.64e-06 | 1.16e-04 | 46 |
| GO:003238613 | Endometrium | EEC | regulation of intracellular transport | 67/2168 | 337/18723 | 6.13e-06 | 1.48e-04 | 67 |
| GO:004819313 | Endometrium | EEC | Golgi vesicle transport | 60/2168 | 296/18723 | 9.91e-06 | 2.17e-04 | 60 |
| GO:000688812 | Endometrium | EEC | endoplasmic reticulum to Golgi vesicle-mediated transport | 29/2168 | 130/18723 | 3.63e-04 | 3.95e-03 | 29 |
| GO:000689013 | Endometrium | EEC | retrograde vesicle-mediated transport, Golgi to endoplasmic reticulum | 15/2168 | 52/18723 | 5.90e-04 | 5.87e-03 | 15 |
| GO:000703012 | Endometrium | EEC | Golgi organization | 32/2168 | 157/18723 | 9.87e-04 | 8.76e-03 | 32 |
| Page: 1 2 3 4 5 6 |
| Pathway ID | Tissue | Disease Stage | Description | Gene Ratio | Bg Ratio | pvalue | p.adjust | qvalue | Count |
| hsa0414523 | Cervix | HSIL_HPV | Phagosome | 27/459 | 152/8465 | 3.58e-08 | 1.50e-06 | 1.21e-06 | 27 |
| hsa0414533 | Cervix | HSIL_HPV | Phagosome | 27/459 | 152/8465 | 3.58e-08 | 1.50e-06 | 1.21e-06 | 27 |
| hsa0414524 | Endometrium | AEH | Phagosome | 41/1197 | 152/8465 | 2.12e-05 | 2.22e-04 | 1.63e-04 | 41 |
| hsa04145111 | Endometrium | AEH | Phagosome | 41/1197 | 152/8465 | 2.12e-05 | 2.22e-04 | 1.63e-04 | 41 |
| hsa0414525 | Endometrium | EEC | Phagosome | 42/1237 | 152/8465 | 2.01e-05 | 2.28e-04 | 1.70e-04 | 42 |
| hsa0414534 | Endometrium | EEC | Phagosome | 42/1237 | 152/8465 | 2.01e-05 | 2.28e-04 | 1.70e-04 | 42 |
| hsa041305 | Esophagus | ESCC | SNARE interactions in vesicular transport | 28/4205 | 33/8465 | 2.75e-05 | 1.32e-04 | 6.75e-05 | 28 |
| hsa0414530 | Esophagus | ESCC | Phagosome | 100/4205 | 152/8465 | 3.81e-05 | 1.72e-04 | 8.82e-05 | 100 |
| hsa0413012 | Esophagus | ESCC | SNARE interactions in vesicular transport | 28/4205 | 33/8465 | 2.75e-05 | 1.32e-04 | 6.75e-05 | 28 |
| hsa04145114 | Esophagus | ESCC | Phagosome | 100/4205 | 152/8465 | 3.81e-05 | 1.72e-04 | 8.82e-05 | 100 |
| hsa0414514 | Liver | Cirrhotic | Phagosome | 73/2530 | 152/8465 | 1.61e-06 | 1.78e-05 | 1.10e-05 | 73 |
| hsa04130 | Liver | Cirrhotic | SNARE interactions in vesicular transport | 18/2530 | 33/8465 | 2.64e-03 | 1.10e-02 | 6.76e-03 | 18 |
| hsa0414515 | Liver | Cirrhotic | Phagosome | 73/2530 | 152/8465 | 1.61e-06 | 1.78e-05 | 1.10e-05 | 73 |
| hsa041301 | Liver | Cirrhotic | SNARE interactions in vesicular transport | 18/2530 | 33/8465 | 2.64e-03 | 1.10e-02 | 6.76e-03 | 18 |
| hsa0414521 | Liver | HCC | Phagosome | 93/4020 | 152/8465 | 4.27e-04 | 1.88e-03 | 1.05e-03 | 93 |
| hsa041302 | Liver | HCC | SNARE interactions in vesicular transport | 25/4020 | 33/8465 | 8.78e-04 | 3.38e-03 | 1.88e-03 | 25 |
| hsa0414531 | Liver | HCC | Phagosome | 93/4020 | 152/8465 | 4.27e-04 | 1.88e-03 | 1.05e-03 | 93 |
| hsa041303 | Liver | HCC | SNARE interactions in vesicular transport | 25/4020 | 33/8465 | 8.78e-04 | 3.38e-03 | 1.88e-03 | 25 |
| hsa041304 | Oral cavity | OSCC | SNARE interactions in vesicular transport | 28/3704 | 33/8465 | 1.31e-06 | 7.18e-06 | 3.66e-06 | 28 |
| hsa0414528 | Oral cavity | OSCC | Phagosome | 88/3704 | 152/8465 | 2.83e-04 | 9.13e-04 | 4.65e-04 | 88 |
| Page: 1 2 |
Top |
Cell-cell communication analysis |
| Identification of potential cell-cell interactions between two cell types and their ligand-receptor pairs for different disease states |
| Ligand | Receptor | LRpair | Pathway | Tissue | Disease Stage |
| Page: 1 |
Top |
Single-cell gene regulatory network inference analysis |
| Find out the significant the regulons (TFs) and the target genes of each regulon across cell types for different disease states |
| TF | Cell Type | Tissue | Disease Stage | Target Gene | RSS | Regulon Activity |
| ∗The dot plots of a searched regulon are shown for all cell subpopulations in each disease state of each tissue based on the regulon specific score inferred using pySCENIC and by calculating the average expression. |
| Page: 1 |
Top |
Somatic mutation of malignant transformation related genes |
| Annotation of somatic variants for genes involved in malignant transformation |
| Hugo Symbol | Variant Class | Variant Classification | dbSNP RS | HGVSc | HGVSp | HGVSp Short | SWISSPROT | BIOTYPE | SIFT | PolyPhen | Tumor Sample Barcode | Tissue | Histology | Sex | Age | Stage | Therapy Types | Drugs | Outcome |
| STX18 | SNV | Missense_Mutation | novel | c.191N>A | p.Arg64Lys | p.R64K | Q9P2W9 | protein_coding | tolerated(0.59) | benign(0.003) | TCGA-5L-AAT1-01 | Breast | breast invasive carcinoma | Female | <65 | III/IV | Hormone Therapy | letrozol | SD |
| STX18 | SNV | Missense_Mutation | rs141662322 | c.670N>A | p.Glu224Lys | p.E224K | Q9P2W9 | protein_coding | deleterious(0) | benign(0.238) | TCGA-D8-A1XK-01 | Breast | breast invasive carcinoma | Female | <65 | I/II | Chemotherapy | doxorubicine+cyclophosphamide | SD |
| STX18 | SNV | Missense_Mutation | c.542N>T | p.Thr181Ile | p.T181I | Q9P2W9 | protein_coding | tolerated(0.22) | benign(0) | TCGA-AA-3844-01 | Colorectum | colon adenocarcinoma | Female | >=65 | III/IV | Chemotherapy | capecitabine | PD | |
| STX18 | SNV | Missense_Mutation | novel | c.649N>T | p.Thr217Ser | p.T217S | Q9P2W9 | protein_coding | tolerated(0.79) | benign(0) | TCGA-AA-A01K-01 | Colorectum | colon adenocarcinoma | Female | >=65 | III/IV | Chemotherapy | folinic | CR |
| STX18 | SNV | Missense_Mutation | c.35G>A | p.Ser12Asn | p.S12N | Q9P2W9 | protein_coding | tolerated(0.12) | probably_damaging(0.983) | TCGA-AZ-4615-01 | Colorectum | colon adenocarcinoma | Male | >=65 | III/IV | Chemotherapy | xeloda | PD | |
| STX18 | SNV | Missense_Mutation | c.460G>A | p.Ala154Thr | p.A154T | Q9P2W9 | protein_coding | deleterious(0) | possibly_damaging(0.804) | TCGA-D5-5537-01 | Colorectum | colon adenocarcinoma | Male | >=65 | I/II | Unknown | Unknown | PD | |
| STX18 | SNV | Missense_Mutation | rs570534465 | c.938N>A | p.Arg313His | p.R313H | Q9P2W9 | protein_coding | deleterious(0) | probably_damaging(0.958) | TCGA-G4-6586-01 | Colorectum | colon adenocarcinoma | Female | >=65 | I/II | Unknown | Unknown | SD |
| STX18 | SNV | Missense_Mutation | rs375534518 | c.278N>A | p.Arg93Gln | p.R93Q | Q9P2W9 | protein_coding | deleterious(0) | possibly_damaging(0.736) | TCGA-AG-A01N-01 | Colorectum | rectum adenocarcinoma | Female | >=65 | III/IV | Chemotherapy | capecitabine | SD |
| STX18 | SNV | Missense_Mutation | novel | c.280N>T | p.Asp94Tyr | p.D94Y | Q9P2W9 | protein_coding | deleterious(0.02) | probably_damaging(0.954) | TCGA-AJ-A3EK-01 | Endometrium | uterine corpus endometrioid carcinoma | Female | <65 | I/II | Chemotherapy | carboplatin | CR |
| STX18 | SNV | Missense_Mutation | novel | c.493N>G | p.Arg165Gly | p.R165G | Q9P2W9 | protein_coding | deleterious(0) | possibly_damaging(0.503) | TCGA-AJ-A3EL-01 | Endometrium | uterine corpus endometrioid carcinoma | Female | <65 | I/II | Unknown | Unknown | SD |
| Page: 1 2 3 4 |
Top |
Related drugs of malignant transformation related genes |
| Identification of chemicals and drugs interact with genes involved in malignant transfromation |
| (DGIdb 4.0) |
| Entrez ID | Symbol | Category | Interaction Types | Drug Claim Name | Drug Name | PMIDs |
| Page: 1 |

Copyright 2023-Present -The University of Texas Health Science Center at Houston |