
|
|||||
|
 | |
| |
| |
| |
| |
| |
|
Gene: STX17 |
Gene summary for STX17 |
| Gene information | Species | Human | Gene symbol | STX17 | Gene ID | 55014 |
| Gene name | syntaxin 17 | |
| Gene Alias | STX17 | |
| Cytomap | 9q31.1 | |
| Gene Type | protein-coding | GO ID | GO:0000045 | UniProtAcc | P56962 |
Top |
Malignant transformation analysis |
| Identification of the aberrant gene expression in precancerous and cancerous lesions by comparing the gene expression of stem-like cells in diseased tissues with normal stem cells |
| Entrez ID | Symbol | Replicates | Species | Organ | Tissue | Adj P-value | Log2FC | Malignancy |
| 55014 | STX17 | LZE2T | Human | Esophagus | ESCC | 6.27e-04 | 5.76e-01 | 0.082 |
| 55014 | STX17 | LZE4T | Human | Esophagus | ESCC | 3.11e-14 | 4.17e-01 | 0.0811 |
| 55014 | STX17 | LZE5T | Human | Esophagus | ESCC | 1.07e-04 | 3.83e-01 | 0.0514 |
| 55014 | STX17 | LZE7T | Human | Esophagus | ESCC | 9.45e-10 | 4.60e-01 | 0.0667 |
| 55014 | STX17 | LZE8T | Human | Esophagus | ESCC | 3.23e-16 | 4.57e-01 | 0.067 |
| 55014 | STX17 | LZE20T | Human | Esophagus | ESCC | 2.68e-05 | 1.66e-01 | 0.0662 |
| 55014 | STX17 | LZE22T | Human | Esophagus | ESCC | 3.59e-03 | 2.48e-01 | 0.068 |
| 55014 | STX17 | LZE24T | Human | Esophagus | ESCC | 4.85e-24 | 5.24e-01 | 0.0596 |
| 55014 | STX17 | LZE21T | Human | Esophagus | ESCC | 1.06e-05 | 3.34e-01 | 0.0655 |
| 55014 | STX17 | LZE6T | Human | Esophagus | ESCC | 2.04e-13 | 4.85e-01 | 0.0845 |
| 55014 | STX17 | P1T-E | Human | Esophagus | ESCC | 9.69e-06 | 2.64e-01 | 0.0875 |
| 55014 | STX17 | P2T-E | Human | Esophagus | ESCC | 2.85e-50 | 8.95e-01 | 0.1177 |
| 55014 | STX17 | P4T-E | Human | Esophagus | ESCC | 6.55e-20 | 4.55e-01 | 0.1323 |
| 55014 | STX17 | P5T-E | Human | Esophagus | ESCC | 1.28e-10 | 1.72e-01 | 0.1327 |
| 55014 | STX17 | P8T-E | Human | Esophagus | ESCC | 1.10e-15 | 3.34e-01 | 0.0889 |
| 55014 | STX17 | P9T-E | Human | Esophagus | ESCC | 4.97e-14 | 3.01e-01 | 0.1131 |
| 55014 | STX17 | P10T-E | Human | Esophagus | ESCC | 7.24e-16 | 3.06e-01 | 0.116 |
| 55014 | STX17 | P11T-E | Human | Esophagus | ESCC | 3.60e-23 | 7.05e-01 | 0.1426 |
| 55014 | STX17 | P12T-E | Human | Esophagus | ESCC | 4.22e-24 | 3.93e-01 | 0.1122 |
| 55014 | STX17 | P15T-E | Human | Esophagus | ESCC | 2.23e-20 | 4.26e-01 | 0.1149 |
| Page: 1 2 3 4 5 6 |
| Tissue | Expression Dynamics | Abbreviation |
| Esophagus | 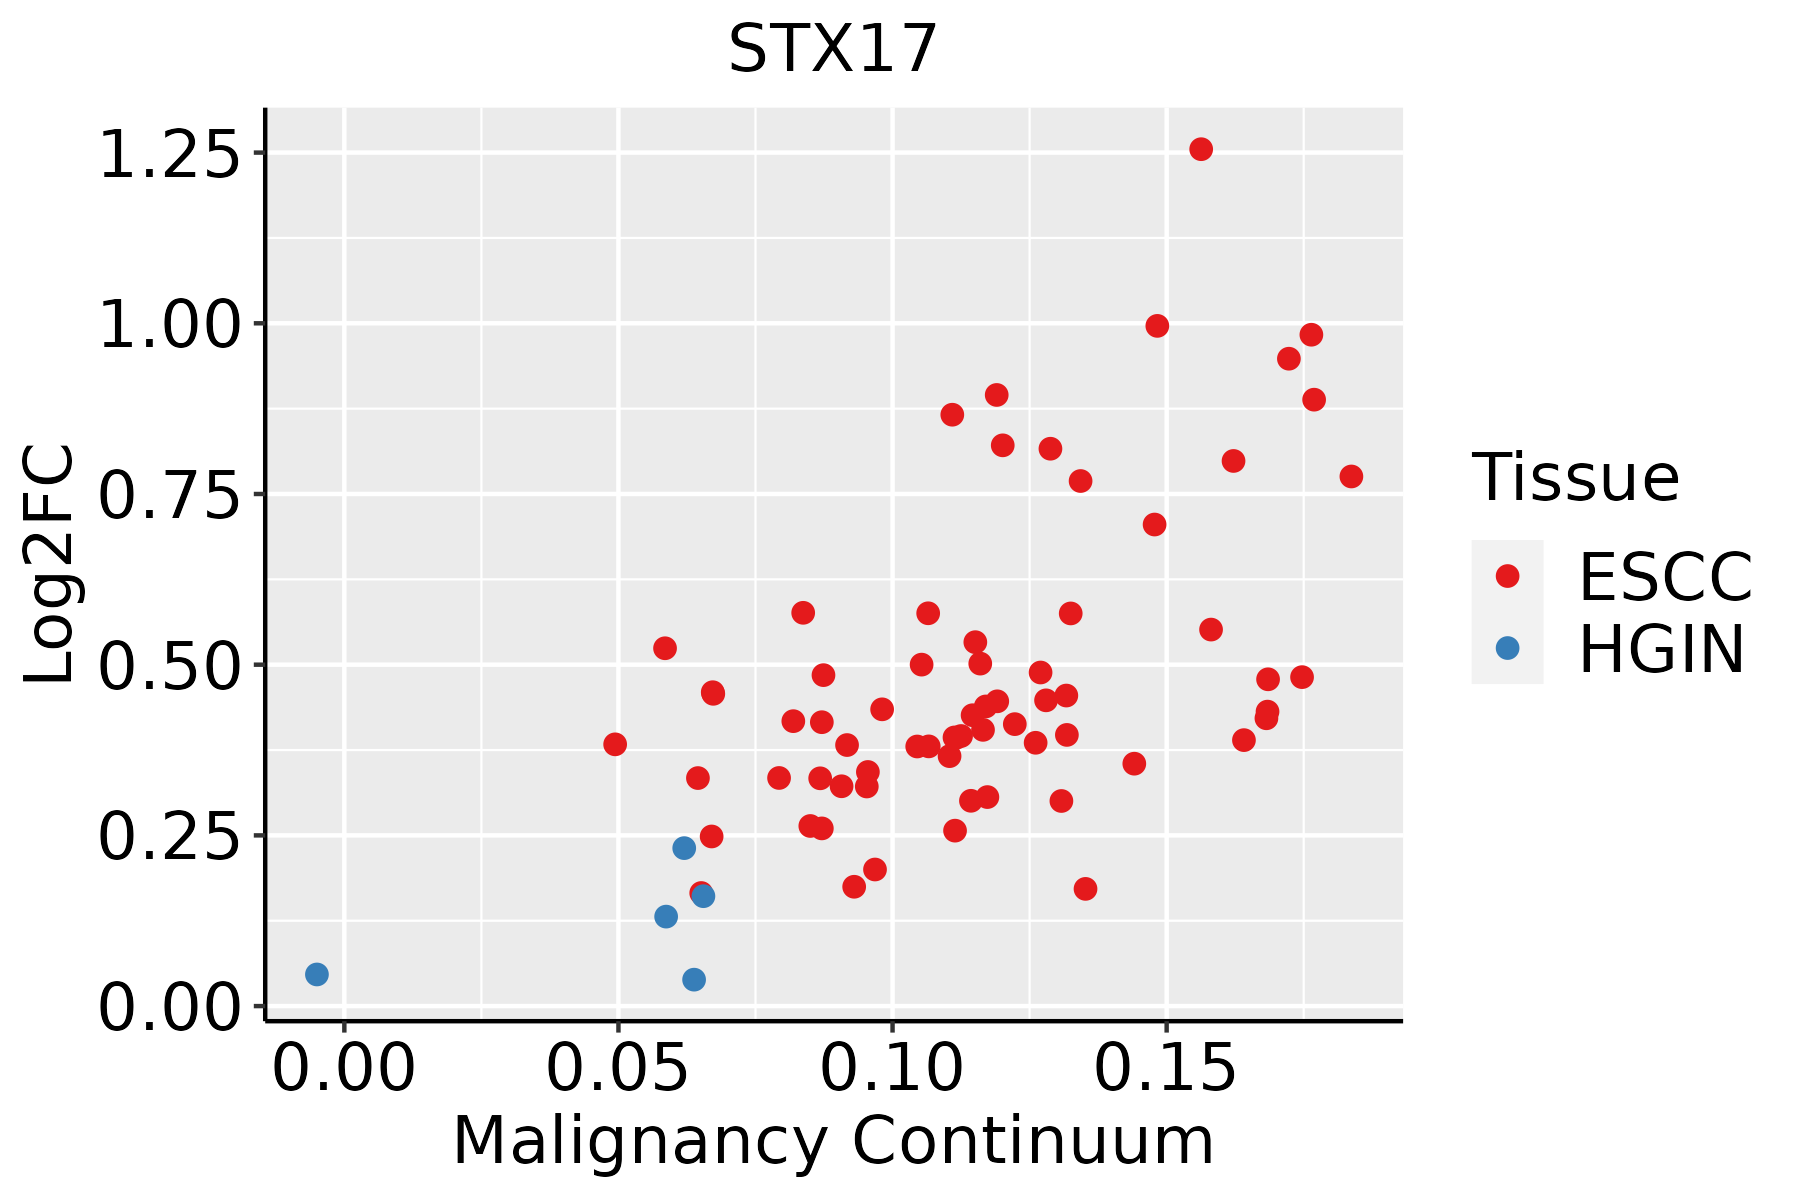 | ESCC: Esophageal squamous cell carcinoma |
| HGIN: High-grade intraepithelial neoplasias | ||
| LGIN: Low-grade intraepithelial neoplasias | ||
| Liver | 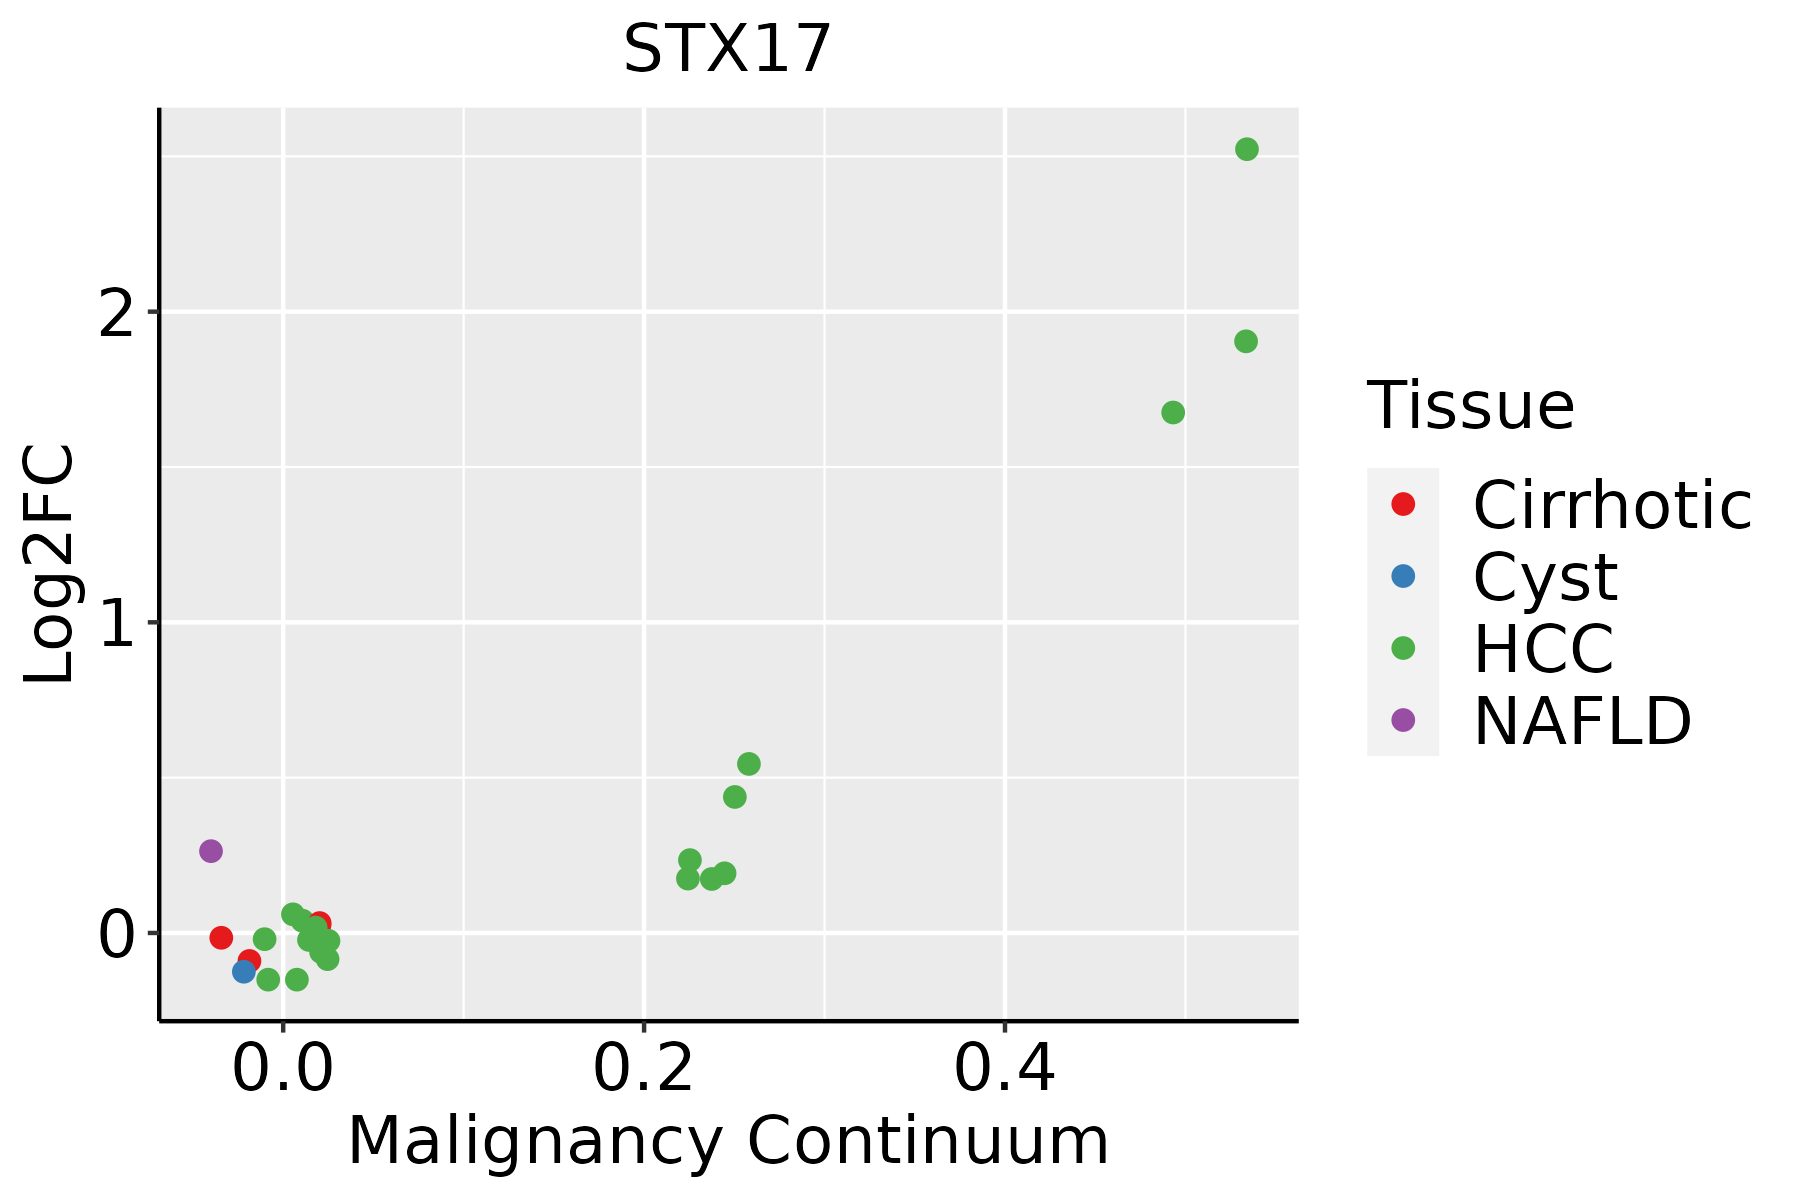 | HCC: Hepatocellular carcinoma |
| NAFLD: Non-alcoholic fatty liver disease | ||
| Oral Cavity |  | EOLP: Erosive Oral lichen planus |
| LP: leukoplakia | ||
| NEOLP: Non-erosive oral lichen planus | ||
| OSCC: Oral squamous cell carcinoma | ||
| Skin | 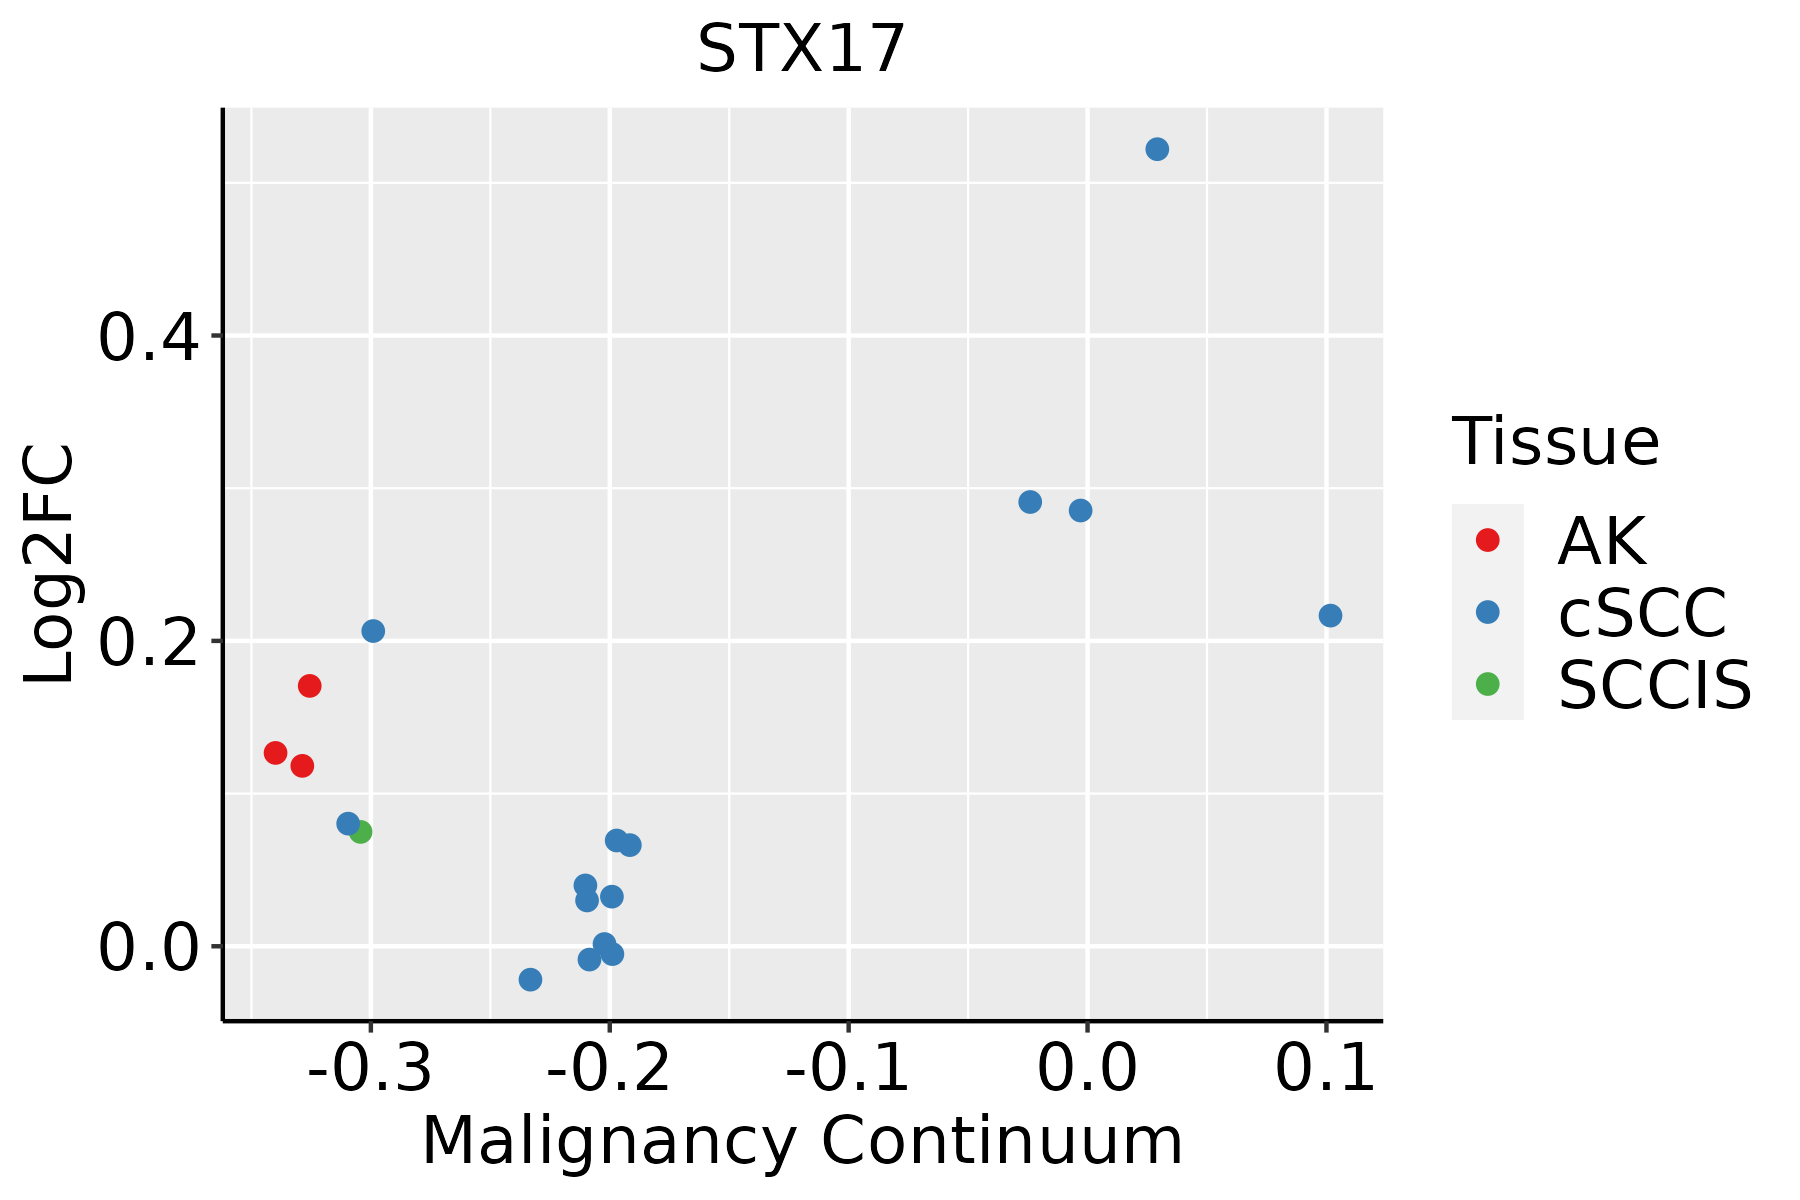 | AK: Actinic keratosis |
| cSCC: Cutaneous squamous cell carcinoma | ||
| SCCIS:squamous cell carcinoma in situ | ||
| Thyroid | 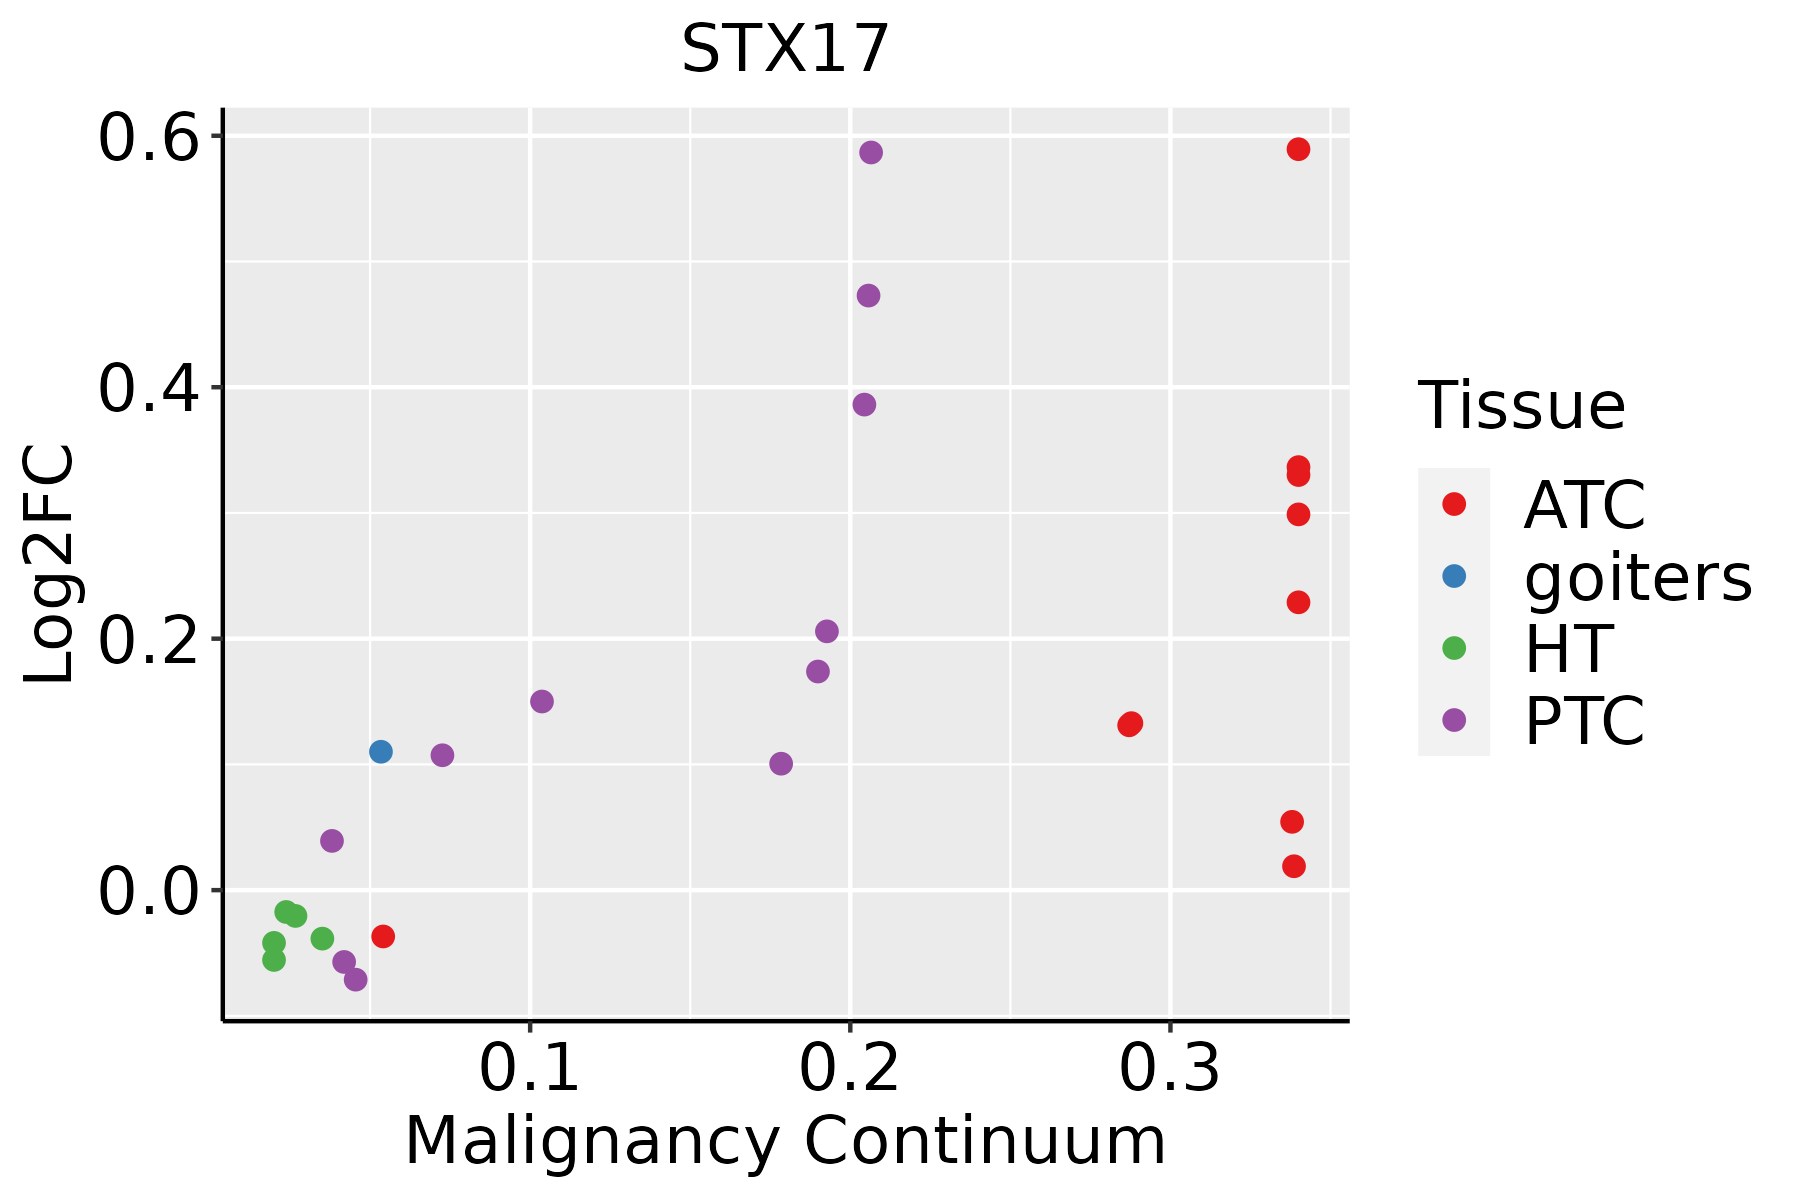 | ATC: Anaplastic thyroid cancer |
| HT: Hashimoto's thyroiditis | ||
| PTC: Papillary thyroid cancer |
| ∗log2FC in expression of this searched gene in stem-like cells from each diseased tissue sample relative to stem-like cells in normal samples in each tissue plotted against the malignancy continuum. Samples are colored based on if they are from different disease stage. |
Top |
Malignant transformation related pathway analysis |
| Find out the enriched GO biological processes and KEGG pathways involved in transition from healthy to precancer to cancer |
| Tissue | Disease Stage | Enriched GO biological Processes |
| Colorectum | AD |  |
| Colorectum | SER |  |
| Colorectum | MSS |  |
| Colorectum | MSI-H |  |
| Colorectum | FAP |  |
| ∗Top 15 enriched GO BP terms are showed in the bar plot of each disease state in each tissue. Each row represents a significant GO biological process which is colored according to the -log10(p.adjust). |
| Page: 1 2 3 4 5 6 7 8 9 |
| GO ID | Tissue | Disease Stage | Description | Gene Ratio | Bg Ratio | pvalue | p.adjust | Count |
| GO:004819318 | Esophagus | ESCC | Golgi vesicle transport | 231/8552 | 296/18723 | 1.82e-30 | 9.63e-28 | 231 |
| GO:001623617 | Esophagus | ESCC | macroautophagy | 216/8552 | 291/18723 | 1.94e-23 | 4.57e-21 | 216 |
| GO:0022411111 | Esophagus | ESCC | cellular component disassembly | 305/8552 | 443/18723 | 1.94e-23 | 4.57e-21 | 305 |
| GO:001605014 | Esophagus | ESCC | vesicle organization | 211/8552 | 300/18723 | 2.85e-18 | 2.87e-16 | 211 |
| GO:000688815 | Esophagus | ESCC | endoplasmic reticulum to Golgi vesicle-mediated transport | 102/8552 | 130/18723 | 1.73e-14 | 9.22e-13 | 102 |
| GO:000703314 | Esophagus | ESCC | vacuole organization | 127/8552 | 180/18723 | 1.04e-11 | 3.85e-10 | 127 |
| GO:003298416 | Esophagus | ESCC | protein-containing complex disassembly | 151/8552 | 224/18723 | 3.45e-11 | 1.15e-09 | 151 |
| GO:190503712 | Esophagus | ESCC | autophagosome organization | 73/8552 | 103/18723 | 1.88e-07 | 2.93e-06 | 73 |
| GO:00482844 | Esophagus | ESCC | organelle fusion | 94/8552 | 141/18723 | 3.72e-07 | 5.16e-06 | 94 |
| GO:00224069 | Esophagus | ESCC | membrane docking | 62/8552 | 86/18723 | 5.93e-07 | 7.79e-06 | 62 |
| GO:000004513 | Esophagus | ESCC | autophagosome assembly | 69/8552 | 99/18723 | 1.10e-06 | 1.38e-05 | 69 |
| GO:00070308 | Esophagus | ESCC | Golgi organization | 101/8552 | 157/18723 | 1.78e-06 | 2.10e-05 | 101 |
| GO:00901743 | Esophagus | ESCC | organelle membrane fusion | 73/8552 | 110/18723 | 9.29e-06 | 8.88e-05 | 73 |
| GO:00069063 | Esophagus | ESCC | vesicle fusion | 70/8552 | 106/18723 | 1.82e-05 | 1.60e-04 | 70 |
| GO:01400567 | Esophagus | ESCC | organelle localization by membrane tethering | 53/8552 | 77/18723 | 3.33e-05 | 2.74e-04 | 53 |
| GO:00973523 | Esophagus | ESCC | autophagosome maturation | 31/8552 | 40/18723 | 4.04e-05 | 3.26e-04 | 31 |
| GO:00610254 | Esophagus | ESCC | membrane fusion | 98/8552 | 163/18723 | 1.39e-04 | 9.41e-04 | 98 |
| GO:00482781 | Esophagus | ESCC | vesicle docking | 38/8552 | 59/18723 | 2.86e-03 | 1.21e-02 | 38 |
| GO:004819321 | Liver | HCC | Golgi vesicle transport | 217/7958 | 296/18723 | 2.58e-27 | 1.02e-24 | 217 |
| GO:001623621 | Liver | HCC | macroautophagy | 204/7958 | 291/18723 | 8.66e-22 | 1.41e-19 | 204 |
| Page: 1 2 3 4 5 6 |
| Pathway ID | Tissue | Disease Stage | Description | Gene Ratio | Bg Ratio | pvalue | p.adjust | qvalue | Count |
| hsa0414010 | Esophagus | ESCC | Autophagy - animal | 101/4205 | 141/8465 | 7.60e-08 | 6.21e-07 | 3.18e-07 | 101 |
| hsa041305 | Esophagus | ESCC | SNARE interactions in vesicular transport | 28/4205 | 33/8465 | 2.75e-05 | 1.32e-04 | 6.75e-05 | 28 |
| hsa0414015 | Esophagus | ESCC | Autophagy - animal | 101/4205 | 141/8465 | 7.60e-08 | 6.21e-07 | 3.18e-07 | 101 |
| hsa0413012 | Esophagus | ESCC | SNARE interactions in vesicular transport | 28/4205 | 33/8465 | 2.75e-05 | 1.32e-04 | 6.75e-05 | 28 |
| hsa0414021 | Liver | HCC | Autophagy - animal | 99/4020 | 141/8465 | 3.08e-08 | 4.70e-07 | 2.61e-07 | 99 |
| hsa041302 | Liver | HCC | SNARE interactions in vesicular transport | 25/4020 | 33/8465 | 8.78e-04 | 3.38e-03 | 1.88e-03 | 25 |
| hsa0414031 | Liver | HCC | Autophagy - animal | 99/4020 | 141/8465 | 3.08e-08 | 4.70e-07 | 2.61e-07 | 99 |
| hsa041303 | Liver | HCC | SNARE interactions in vesicular transport | 25/4020 | 33/8465 | 8.78e-04 | 3.38e-03 | 1.88e-03 | 25 |
| hsa041409 | Oral cavity | OSCC | Autophagy - animal | 94/3704 | 141/8465 | 2.73e-08 | 2.38e-07 | 1.21e-07 | 94 |
| hsa041304 | Oral cavity | OSCC | SNARE interactions in vesicular transport | 28/3704 | 33/8465 | 1.31e-06 | 7.18e-06 | 3.66e-06 | 28 |
| hsa0414014 | Oral cavity | OSCC | Autophagy - animal | 94/3704 | 141/8465 | 2.73e-08 | 2.38e-07 | 1.21e-07 | 94 |
| hsa0413011 | Oral cavity | OSCC | SNARE interactions in vesicular transport | 28/3704 | 33/8465 | 1.31e-06 | 7.18e-06 | 3.66e-06 | 28 |
| Page: 1 |
Top |
Cell-cell communication analysis |
| Identification of potential cell-cell interactions between two cell types and their ligand-receptor pairs for different disease states |
| Ligand | Receptor | LRpair | Pathway | Tissue | Disease Stage |
| Page: 1 |
Top |
Single-cell gene regulatory network inference analysis |
| Find out the significant the regulons (TFs) and the target genes of each regulon across cell types for different disease states |
| TF | Cell Type | Tissue | Disease Stage | Target Gene | RSS | Regulon Activity |
| ∗The dot plots of a searched regulon are shown for all cell subpopulations in each disease state of each tissue based on the regulon specific score inferred using pySCENIC and by calculating the average expression. |
| Page: 1 |
Top |
Somatic mutation of malignant transformation related genes |
| Annotation of somatic variants for genes involved in malignant transformation |
| Hugo Symbol | Variant Class | Variant Classification | dbSNP RS | HGVSc | HGVSp | HGVSp Short | SWISSPROT | BIOTYPE | SIFT | PolyPhen | Tumor Sample Barcode | Tissue | Histology | Sex | Age | Stage | Therapy Types | Drugs | Outcome |
| STX17 | SNV | Missense_Mutation | novel | c.830N>T | p.Arg277Ile | p.R277I | P56962 | protein_coding | deleterious(0) | possibly_damaging(0.897) | TCGA-AN-A046-01 | Breast | breast invasive carcinoma | Female | >=65 | I/II | Unknown | Unknown | SD |
| STX17 | SNV | Missense_Mutation | novel | c.451N>G | p.Gln151Glu | p.Q151E | P56962 | protein_coding | tolerated(0.54) | benign(0) | TCGA-D8-A1J8-01 | Breast | breast invasive carcinoma | Female | >=65 | I/II | Hormone Therapy | nolvadex | SD |
| STX17 | SNV | Missense_Mutation | c.316N>G | p.Leu106Val | p.L106V | P56962 | protein_coding | tolerated(0.08) | benign(0.164) | TCGA-D8-A1JA-01 | Breast | breast invasive carcinoma | Female | <65 | III/IV | Chemotherapy | adriamycin | PD | |
| STX17 | SNV | Missense_Mutation | novel | c.112A>C | p.Asn38His | p.N38H | P56962 | protein_coding | deleterious(0.01) | probably_damaging(0.986) | TCGA-CA-6717-01 | Colorectum | colon adenocarcinoma | Male | <65 | I/II | Chemotherapy | oxaliplatin | CR |
| STX17 | SNV | Missense_Mutation | novel | c.760N>G | p.Lys254Glu | p.K254E | P56962 | protein_coding | deleterious(0) | probably_damaging(0.996) | TCGA-AG-A002-01 | Colorectum | rectum adenocarcinoma | Male | <65 | I/II | Unknown | Unknown | SD |
| STX17 | SNV | Missense_Mutation | novel | c.648N>T | p.Glu216Asp | p.E216D | P56962 | protein_coding | tolerated(0.07) | possibly_damaging(0.824) | TCGA-A5-A0G1-01 | Endometrium | uterine corpus endometrioid carcinoma | Female | >=65 | I/II | Unknown | Unknown | SD |
| STX17 | SNV | Missense_Mutation | novel | c.812N>A | p.Gly271Asp | p.G271D | P56962 | protein_coding | deleterious(0) | probably_damaging(0.998) | TCGA-A5-A2K5-01 | Endometrium | uterine corpus endometrioid carcinoma | Female | >=65 | I/II | Unknown | Unknown | SD |
| STX17 | SNV | Missense_Mutation | novel | c.310N>A | p.Glu104Lys | p.E104K | P56962 | protein_coding | tolerated(0.3) | benign(0.006) | TCGA-AJ-A2QO-01 | Endometrium | uterine corpus endometrioid carcinoma | Female | >=65 | I/II | Unknown | Unknown | SD |
| STX17 | SNV | Missense_Mutation | novel | c.779N>T | p.Ala260Val | p.A260V | P56962 | protein_coding | deleterious(0.01) | probably_damaging(0.991) | TCGA-AJ-A8CT-01 | Endometrium | uterine corpus endometrioid carcinoma | Female | <65 | I/II | Unknown | Unknown | SD |
| STX17 | SNV | Missense_Mutation | novel | c.605N>A | p.Ser202Asn | p.S202N | P56962 | protein_coding | deleterious(0.03) | benign(0.13) | TCGA-AX-A06F-01 | Endometrium | uterine corpus endometrioid carcinoma | Female | <65 | III/IV | Chemotherapy | carboplatin | SD |
| Page: 1 2 3 |
Top |
Related drugs of malignant transformation related genes |
| Identification of chemicals and drugs interact with genes involved in malignant transfromation |
| (DGIdb 4.0) |
| Entrez ID | Symbol | Category | Interaction Types | Drug Claim Name | Drug Name | PMIDs |
| Page: 1 |

Copyright 2023-Present -The University of Texas Health Science Center at Houston |