
|
|||||
|
 | |
| |
| |
| |
| |
| |
|
Gene: STX16 |
Gene summary for STX16 |
| Gene information | Species | Human | Gene symbol | STX16 | Gene ID | 8675 |
| Gene name | syntaxin 16 | |
| Gene Alias | SYN16 | |
| Cytomap | 20q13.32 | |
| Gene Type | protein-coding | GO ID | GO:0006810 | UniProtAcc | O14662 |
Top |
Malignant transformation analysis |
| Identification of the aberrant gene expression in precancerous and cancerous lesions by comparing the gene expression of stem-like cells in diseased tissues with normal stem cells |
| Entrez ID | Symbol | Replicates | Species | Organ | Tissue | Adj P-value | Log2FC | Malignancy |
| 8675 | STX16 | HTA11_3410_2000001011 | Human | Colorectum | AD | 3.21e-08 | 2.17e-01 | 0.0155 |
| 8675 | STX16 | HTA11_2487_2000001011 | Human | Colorectum | SER | 2.63e-05 | 2.40e-01 | -0.1808 |
| 8675 | STX16 | HTA11_1938_2000001011 | Human | Colorectum | AD | 1.04e-13 | 4.40e-01 | -0.0811 |
| 8675 | STX16 | HTA11_78_2000001011 | Human | Colorectum | AD | 1.94e-14 | 3.77e-01 | -0.1088 |
| 8675 | STX16 | HTA11_347_2000001011 | Human | Colorectum | AD | 3.92e-26 | 5.00e-01 | -0.1954 |
| 8675 | STX16 | HTA11_411_2000001011 | Human | Colorectum | SER | 1.96e-03 | 3.67e-01 | -0.2602 |
| 8675 | STX16 | HTA11_3361_2000001011 | Human | Colorectum | AD | 3.20e-05 | 2.56e-01 | -0.1207 |
| 8675 | STX16 | HTA11_83_2000001011 | Human | Colorectum | SER | 6.91e-08 | 3.21e-01 | -0.1526 |
| 8675 | STX16 | HTA11_696_2000001011 | Human | Colorectum | AD | 8.44e-12 | 2.53e-01 | -0.1464 |
| 8675 | STX16 | HTA11_866_2000001011 | Human | Colorectum | AD | 4.02e-18 | 3.18e-01 | -0.1001 |
| 8675 | STX16 | HTA11_1391_2000001011 | Human | Colorectum | AD | 2.12e-15 | 4.72e-01 | -0.059 |
| 8675 | STX16 | HTA11_546_2000001011 | Human | Colorectum | AD | 2.18e-07 | 3.32e-01 | -0.0842 |
| 8675 | STX16 | HTA11_866_3004761011 | Human | Colorectum | AD | 9.26e-08 | 2.65e-01 | 0.096 |
| 8675 | STX16 | HTA11_4255_2000001011 | Human | Colorectum | SER | 2.52e-03 | 3.62e-01 | 0.0446 |
| 8675 | STX16 | HTA11_7663_2000001011 | Human | Colorectum | SER | 7.66e-05 | 3.58e-01 | 0.0131 |
| 8675 | STX16 | HTA11_10623_2000001011 | Human | Colorectum | AD | 1.41e-11 | 5.16e-01 | -0.0177 |
| 8675 | STX16 | HTA11_6801_2000001011 | Human | Colorectum | SER | 1.41e-02 | 2.68e-01 | 0.0171 |
| 8675 | STX16 | HTA11_10711_2000001011 | Human | Colorectum | AD | 3.46e-09 | 3.10e-01 | 0.0338 |
| 8675 | STX16 | HTA11_7696_3000711011 | Human | Colorectum | AD | 2.10e-17 | 3.27e-01 | 0.0674 |
| 8675 | STX16 | HTA11_99999970781_79442 | Human | Colorectum | MSS | 1.29e-28 | 5.29e-01 | 0.294 |
| Page: 1 2 3 4 5 6 7 8 |
| Tissue | Expression Dynamics | Abbreviation |
| Colorectum (GSE201348) |  | FAP: Familial adenomatous polyposis |
| CRC: Colorectal cancer | ||
| Colorectum (HTA11) |  | AD: Adenomas |
| SER: Sessile serrated lesions | ||
| MSI-H: Microsatellite-high colorectal cancer | ||
| MSS: Microsatellite stable colorectal cancer | ||
| Esophagus | 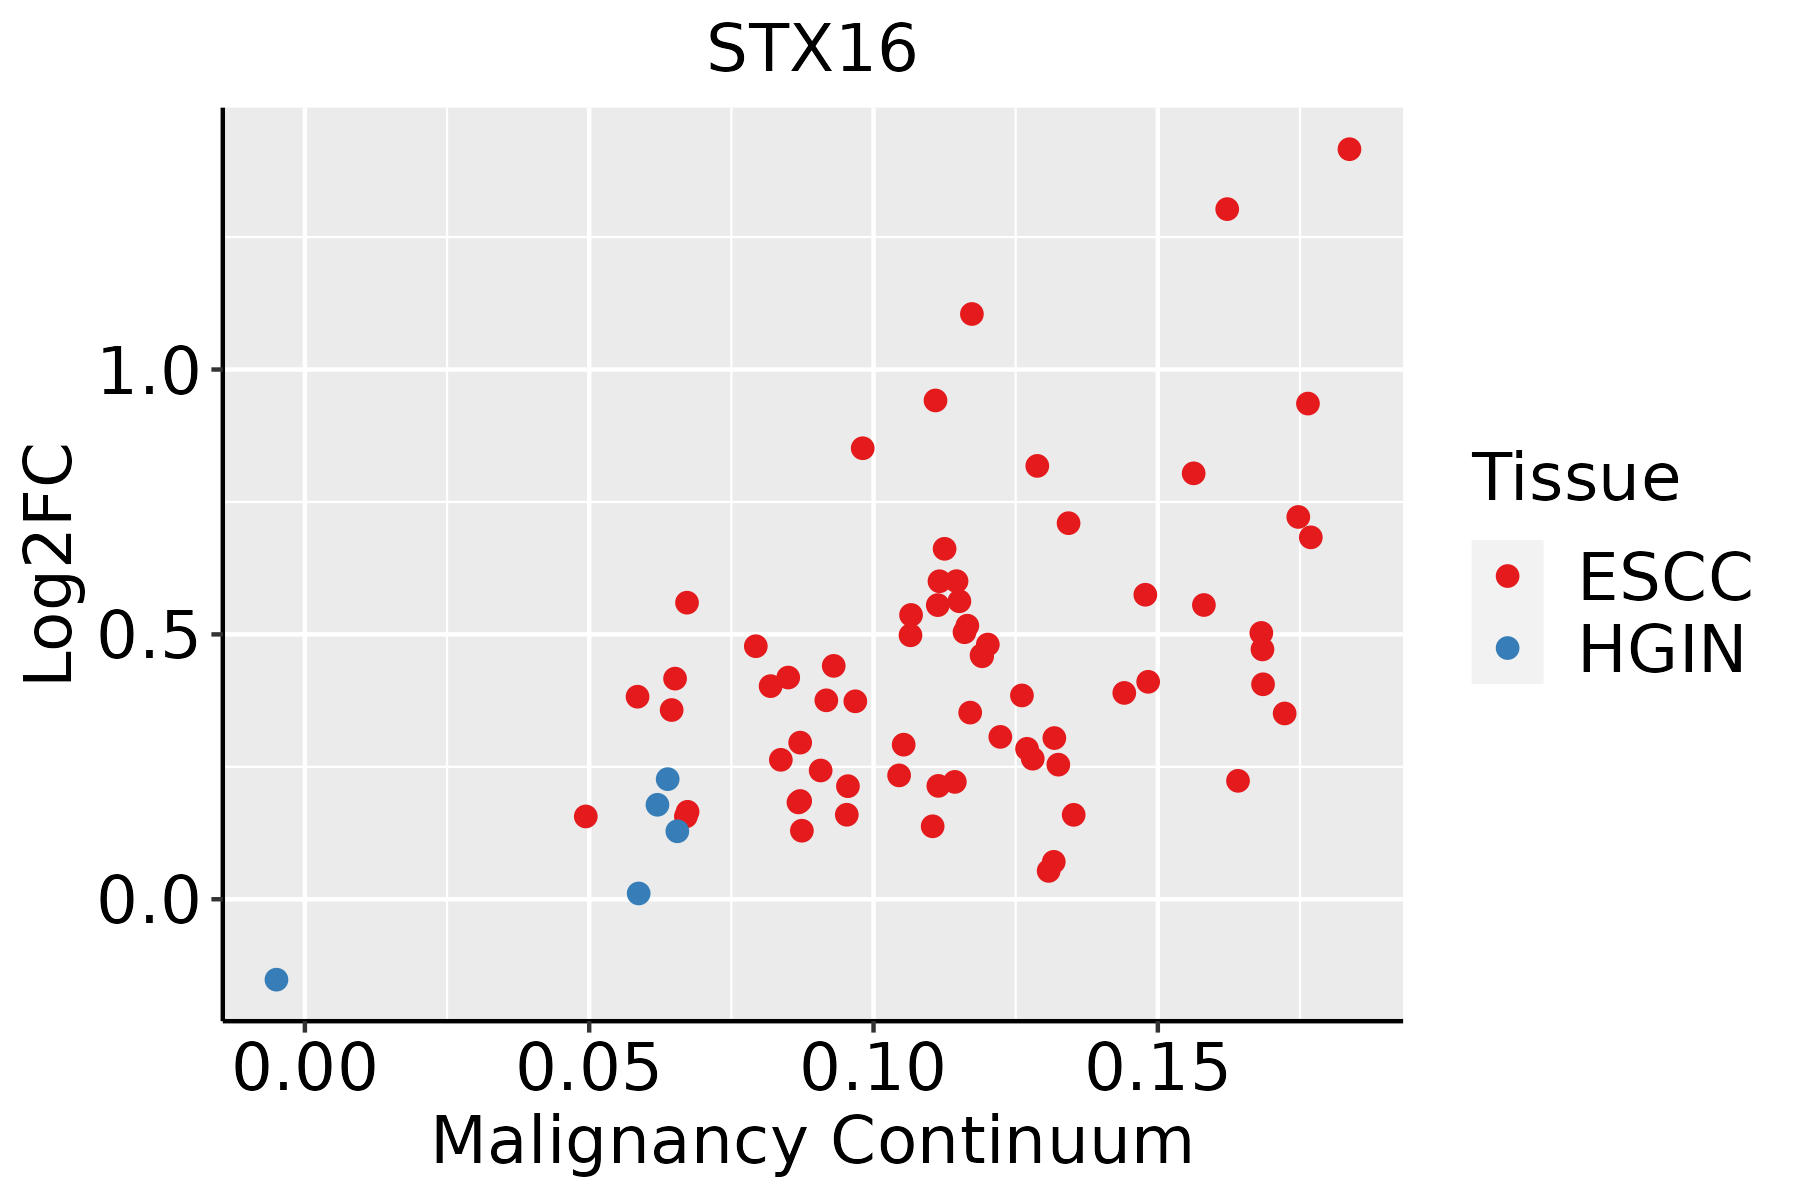 | ESCC: Esophageal squamous cell carcinoma |
| HGIN: High-grade intraepithelial neoplasias | ||
| LGIN: Low-grade intraepithelial neoplasias | ||
| Liver |  | HCC: Hepatocellular carcinoma |
| NAFLD: Non-alcoholic fatty liver disease | ||
| Oral Cavity |  | EOLP: Erosive Oral lichen planus |
| LP: leukoplakia | ||
| NEOLP: Non-erosive oral lichen planus | ||
| OSCC: Oral squamous cell carcinoma | ||
| Skin | 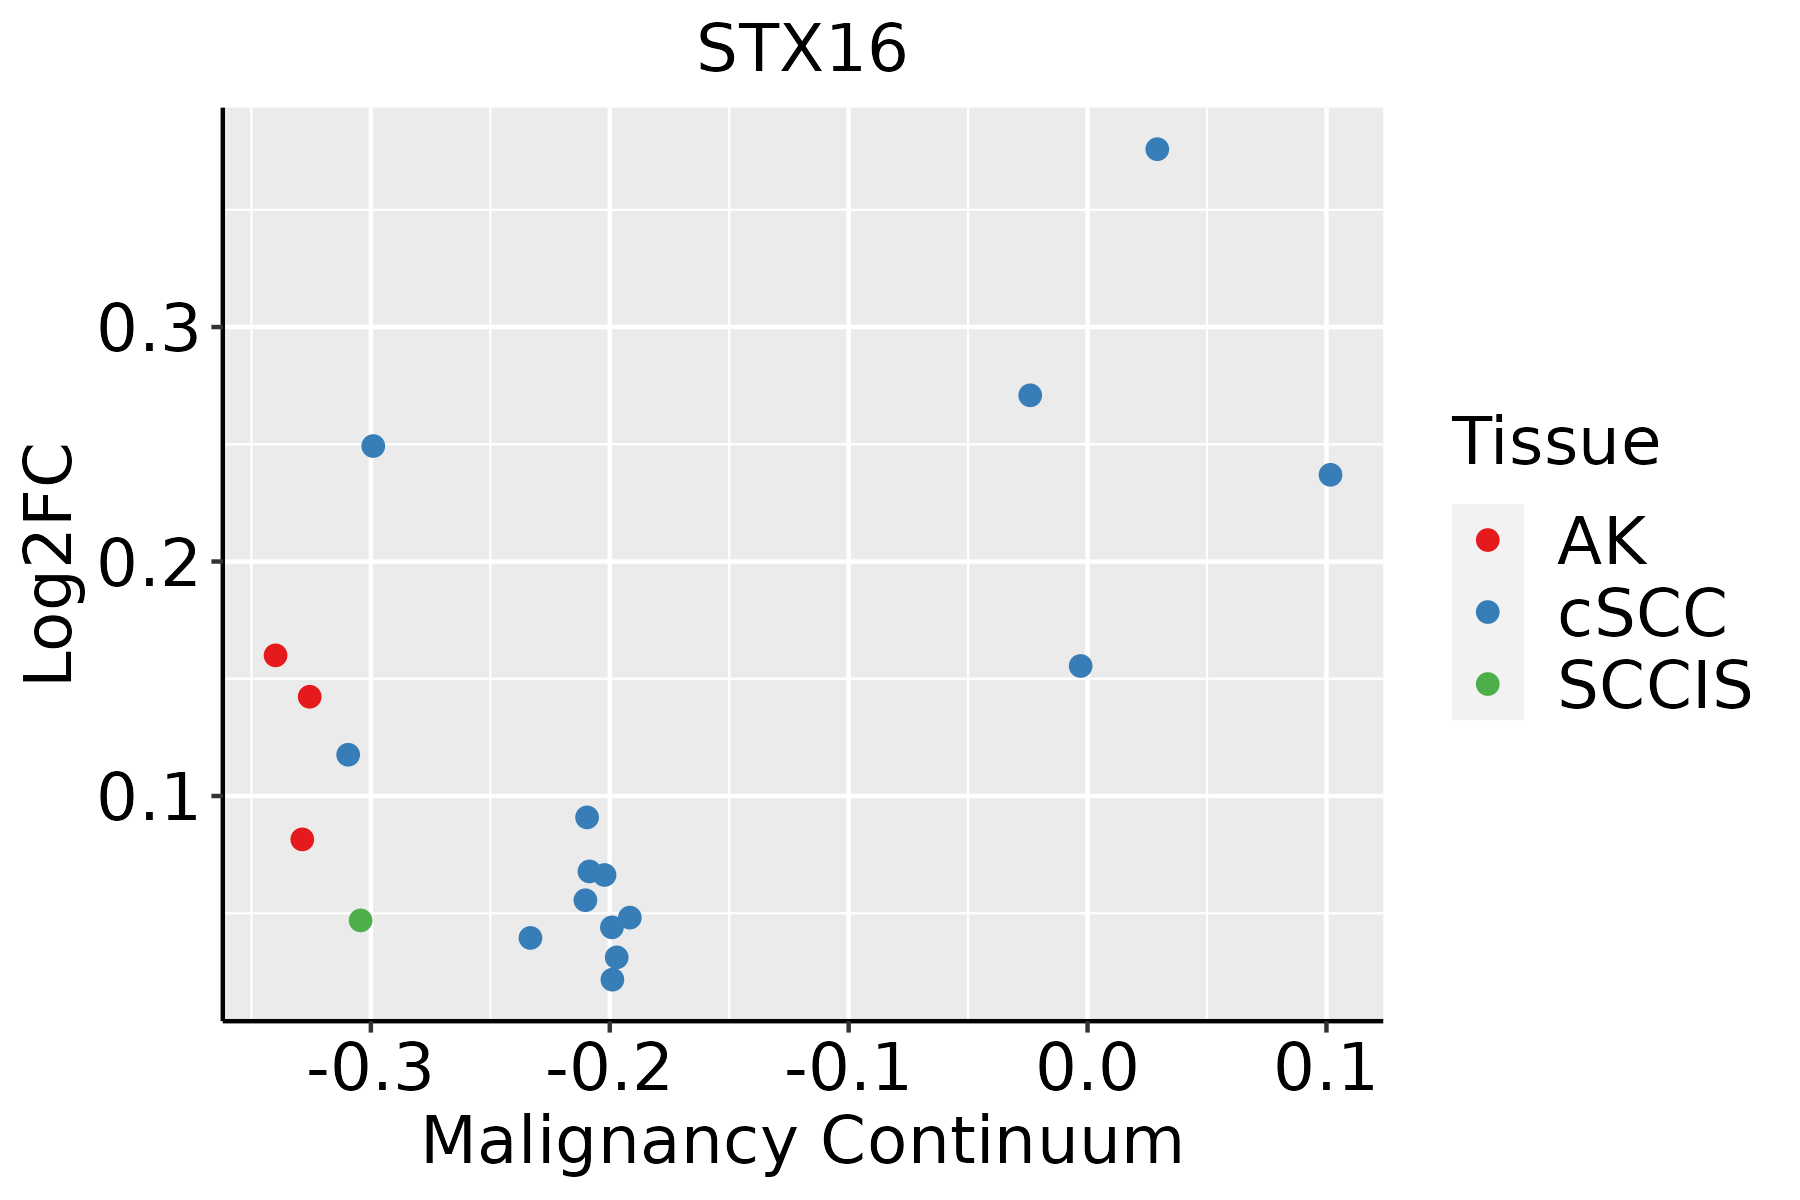 | AK: Actinic keratosis |
| cSCC: Cutaneous squamous cell carcinoma | ||
| SCCIS:squamous cell carcinoma in situ | ||
| Thyroid |  | ATC: Anaplastic thyroid cancer |
| HT: Hashimoto's thyroiditis | ||
| PTC: Papillary thyroid cancer |
| ∗log2FC in expression of this searched gene in stem-like cells from each diseased tissue sample relative to stem-like cells in normal samples in each tissue plotted against the malignancy continuum. Samples are colored based on if they are from different disease stage. |
Top |
Malignant transformation related pathway analysis |
| Find out the enriched GO biological processes and KEGG pathways involved in transition from healthy to precancer to cancer |
| Tissue | Disease Stage | Enriched GO biological Processes |
| Colorectum | AD |  |
| Colorectum | SER |  |
| Colorectum | MSS |  |
| Colorectum | MSI-H |  |
| Colorectum | FAP |  |
| ∗Top 15 enriched GO BP terms are showed in the bar plot of each disease state in each tissue. Each row represents a significant GO biological process which is colored according to the -log10(p.adjust). |
| Page: 1 2 3 4 5 6 7 8 9 |
| GO ID | Tissue | Disease Stage | Description | Gene Ratio | Bg Ratio | pvalue | p.adjust | Count |
| GO:0016197 | Colorectum | AD | endosomal transport | 90/3918 | 230/18723 | 1.88e-10 | 1.73e-08 | 90 |
| GO:0016482 | Colorectum | AD | cytosolic transport | 68/3918 | 168/18723 | 6.00e-09 | 3.72e-07 | 68 |
| GO:0016050 | Colorectum | AD | vesicle organization | 101/3918 | 300/18723 | 1.65e-07 | 7.17e-06 | 101 |
| GO:0042147 | Colorectum | AD | retrograde transport, endosome to Golgi | 37/3918 | 91/18723 | 1.46e-05 | 3.14e-04 | 37 |
| GO:0022406 | Colorectum | AD | membrane docking | 31/3918 | 86/18723 | 8.67e-04 | 8.45e-03 | 31 |
| GO:0140056 | Colorectum | AD | organelle localization by membrane tethering | 28/3918 | 77/18723 | 1.29e-03 | 1.14e-02 | 28 |
| GO:0048284 | Colorectum | AD | organelle fusion | 42/3918 | 141/18723 | 8.04e-03 | 4.73e-02 | 42 |
| GO:00161971 | Colorectum | SER | endosomal transport | 61/2897 | 230/18723 | 1.03e-05 | 3.35e-04 | 61 |
| GO:00164821 | Colorectum | SER | cytosolic transport | 46/2897 | 168/18723 | 5.20e-05 | 1.25e-03 | 46 |
| GO:00160501 | Colorectum | SER | vesicle organization | 69/2897 | 300/18723 | 3.59e-04 | 5.61e-03 | 69 |
| GO:00224061 | Colorectum | SER | membrane docking | 25/2897 | 86/18723 | 9.88e-04 | 1.17e-02 | 25 |
| GO:01400561 | Colorectum | SER | organelle localization by membrane tethering | 22/2897 | 77/18723 | 2.46e-03 | 2.32e-02 | 22 |
| GO:00161972 | Colorectum | MSS | endosomal transport | 79/3467 | 230/18723 | 7.04e-09 | 4.39e-07 | 79 |
| GO:00160502 | Colorectum | MSS | vesicle organization | 93/3467 | 300/18723 | 1.04e-07 | 4.97e-06 | 93 |
| GO:00164822 | Colorectum | MSS | cytosolic transport | 59/3467 | 168/18723 | 2.29e-07 | 9.79e-06 | 59 |
| GO:00421471 | Colorectum | MSS | retrograde transport, endosome to Golgi | 33/3467 | 91/18723 | 4.78e-05 | 8.71e-04 | 33 |
| GO:00224062 | Colorectum | MSS | membrane docking | 28/3467 | 86/18723 | 1.27e-03 | 1.21e-02 | 28 |
| GO:01400562 | Colorectum | MSS | organelle localization by membrane tethering | 25/3467 | 77/18723 | 2.34e-03 | 1.91e-02 | 25 |
| GO:00482841 | Colorectum | MSS | organelle fusion | 39/3467 | 141/18723 | 4.91e-03 | 3.42e-02 | 39 |
| GO:001619710 | Esophagus | HGIN | endosomal transport | 57/2587 | 230/18723 | 5.74e-06 | 1.81e-04 | 57 |
| Page: 1 2 3 4 5 6 |
| Pathway ID | Tissue | Disease Stage | Description | Gene Ratio | Bg Ratio | pvalue | p.adjust | qvalue | Count |
| hsa041305 | Esophagus | ESCC | SNARE interactions in vesicular transport | 28/4205 | 33/8465 | 2.75e-05 | 1.32e-04 | 6.75e-05 | 28 |
| hsa0413012 | Esophagus | ESCC | SNARE interactions in vesicular transport | 28/4205 | 33/8465 | 2.75e-05 | 1.32e-04 | 6.75e-05 | 28 |
| hsa04130 | Liver | Cirrhotic | SNARE interactions in vesicular transport | 18/2530 | 33/8465 | 2.64e-03 | 1.10e-02 | 6.76e-03 | 18 |
| hsa041301 | Liver | Cirrhotic | SNARE interactions in vesicular transport | 18/2530 | 33/8465 | 2.64e-03 | 1.10e-02 | 6.76e-03 | 18 |
| hsa041302 | Liver | HCC | SNARE interactions in vesicular transport | 25/4020 | 33/8465 | 8.78e-04 | 3.38e-03 | 1.88e-03 | 25 |
| hsa041303 | Liver | HCC | SNARE interactions in vesicular transport | 25/4020 | 33/8465 | 8.78e-04 | 3.38e-03 | 1.88e-03 | 25 |
| hsa041304 | Oral cavity | OSCC | SNARE interactions in vesicular transport | 28/3704 | 33/8465 | 1.31e-06 | 7.18e-06 | 3.66e-06 | 28 |
| hsa0413011 | Oral cavity | OSCC | SNARE interactions in vesicular transport | 28/3704 | 33/8465 | 1.31e-06 | 7.18e-06 | 3.66e-06 | 28 |
| Page: 1 |
Top |
Cell-cell communication analysis |
| Identification of potential cell-cell interactions between two cell types and their ligand-receptor pairs for different disease states |
| Ligand | Receptor | LRpair | Pathway | Tissue | Disease Stage |
| Page: 1 |
Top |
Single-cell gene regulatory network inference analysis |
| Find out the significant the regulons (TFs) and the target genes of each regulon across cell types for different disease states |
| TF | Cell Type | Tissue | Disease Stage | Target Gene | RSS | Regulon Activity |
| ∗The dot plots of a searched regulon are shown for all cell subpopulations in each disease state of each tissue based on the regulon specific score inferred using pySCENIC and by calculating the average expression. |
| Page: 1 |
Top |
Somatic mutation of malignant transformation related genes |
| Annotation of somatic variants for genes involved in malignant transformation |
| Hugo Symbol | Variant Class | Variant Classification | dbSNP RS | HGVSc | HGVSp | HGVSp Short | SWISSPROT | BIOTYPE | SIFT | PolyPhen | Tumor Sample Barcode | Tissue | Histology | Sex | Age | Stage | Therapy Types | Drugs | Outcome |
| STX16 | SNV | Missense_Mutation | c.974N>A | p.Arg325Gln | p.R325Q | O14662 | protein_coding | deleterious_low_confidence(0) | benign(0.007) | TCGA-AR-A0TX-01 | Breast | breast invasive carcinoma | Female | <65 | I/II | Unknown | Unknown | SD | |
| STX16 | SNV | Missense_Mutation | c.780G>A | p.Met260Ile | p.M260I | O14662 | protein_coding | tolerated(0.11) | benign(0.326) | TCGA-GM-A2DO-01 | Breast | breast invasive carcinoma | Female | <65 | I/II | Hormone Therapy | tamoxiphen | CR | |
| STX16 | SNV | Missense_Mutation | c.460N>C | p.Glu154Gln | p.E154Q | O14662 | protein_coding | deleterious(0.05) | possibly_damaging(0.788) | TCGA-DS-A0VN-01 | Cervix | cervical & endocervical cancer | Female | <65 | I/II | Chemotherapy | cisplatin | SD | |
| STX16 | SNV | Missense_Mutation | c.395N>G | p.Leu132Arg | p.L132R | O14662 | protein_coding | deleterious(0) | probably_damaging(0.948) | TCGA-AA-3679-01 | Colorectum | colon adenocarcinoma | Male | <65 | III/IV | Chemotherapy | folinic | SD | |
| STX16 | deletion | Frame_Shift_Del | c.593delT | p.Phe198SerfsTer7 | p.F198Sfs*7 | O14662 | protein_coding | TCGA-AA-3947-01 | Colorectum | colon adenocarcinoma | Female | <65 | I/II | Unknown | Unknown | SD | |||
| STX16 | SNV | Missense_Mutation | novel | c.742N>G | p.Ser248Ala | p.S248A | O14662 | protein_coding | tolerated(0.35) | benign(0.015) | TCGA-A5-A1OF-01 | Endometrium | uterine corpus endometrioid carcinoma | Female | <65 | I/II | Unknown | Unknown | SD |
| STX16 | SNV | Missense_Mutation | rs370017047 | c.931N>G | p.Ile311Val | p.I311V | O14662 | protein_coding | tolerated(1) | benign(0.015) | TCGA-AP-A0LS-01 | Endometrium | uterine corpus endometrioid carcinoma | Female | <65 | I/II | Unknown | Unknown | SD |
| STX16 | SNV | Missense_Mutation | c.487N>A | p.Ala163Thr | p.A163T | O14662 | protein_coding | tolerated(0.32) | benign(0.142) | TCGA-AX-A0J1-01 | Endometrium | uterine corpus endometrioid carcinoma | Female | >=65 | I/II | Unknown | Unknown | SD | |
| STX16 | SNV | Missense_Mutation | rs371863588 | c.776C>T | p.Ala259Val | p.A259V | O14662 | protein_coding | tolerated(0.35) | benign(0.073) | TCGA-AX-A1CE-01 | Endometrium | uterine corpus endometrioid carcinoma | Female | <65 | I/II | Unspecific | Paclitaxel | SD |
| STX16 | SNV | Missense_Mutation | rs761484020 | c.437N>A | p.Arg146Gln | p.R146Q | O14662 | protein_coding | tolerated(0.53) | benign(0.003) | TCGA-BK-A56F-01 | Endometrium | uterine corpus endometrioid carcinoma | Female | >=65 | I/II | Unknown | Unknown | SD |
| Page: 1 2 3 4 |
Top |
Related drugs of malignant transformation related genes |
| Identification of chemicals and drugs interact with genes involved in malignant transfromation |
| (DGIdb 4.0) |
| Entrez ID | Symbol | Category | Interaction Types | Drug Claim Name | Drug Name | PMIDs |
| Page: 1 |

Copyright 2023-Present -The University of Texas Health Science Center at Houston |