
|
|||||
|
 | |
| |
| |
| |
| |
| |
|
Gene: STX12 |
Gene summary for STX12 |
| Gene information | Species | Human | Gene symbol | STX12 | Gene ID | 23673 |
| Gene name | syntaxin 12 | |
| Gene Alias | STX13 | |
| Cytomap | 1p35.3 | |
| Gene Type | protein-coding | GO ID | GO:0000045 | UniProtAcc | Q86Y82 |
Top |
Malignant transformation analysis |
| Identification of the aberrant gene expression in precancerous and cancerous lesions by comparing the gene expression of stem-like cells in diseased tissues with normal stem cells |
| Entrez ID | Symbol | Replicates | Species | Organ | Tissue | Adj P-value | Log2FC | Malignancy |
| 23673 | STX12 | LZE4T | Human | Esophagus | ESCC | 1.59e-12 | 2.70e-01 | 0.0811 |
| 23673 | STX12 | LZE8T | Human | Esophagus | ESCC | 8.47e-10 | 1.65e-01 | 0.067 |
| 23673 | STX12 | LZE20T | Human | Esophagus | ESCC | 1.13e-09 | 3.20e-01 | 0.0662 |
| 23673 | STX12 | LZE24T | Human | Esophagus | ESCC | 1.10e-21 | 8.81e-01 | 0.0596 |
| 23673 | STX12 | LZE21T | Human | Esophagus | ESCC | 6.02e-04 | 6.85e-02 | 0.0655 |
| 23673 | STX12 | P1T-E | Human | Esophagus | ESCC | 2.37e-09 | 6.39e-01 | 0.0875 |
| 23673 | STX12 | P2T-E | Human | Esophagus | ESCC | 1.46e-22 | 3.67e-01 | 0.1177 |
| 23673 | STX12 | P4T-E | Human | Esophagus | ESCC | 1.98e-15 | 4.48e-01 | 0.1323 |
| 23673 | STX12 | P5T-E | Human | Esophagus | ESCC | 1.04e-18 | 4.05e-01 | 0.1327 |
| 23673 | STX12 | P8T-E | Human | Esophagus | ESCC | 4.74e-13 | 2.86e-01 | 0.0889 |
| 23673 | STX12 | P9T-E | Human | Esophagus | ESCC | 9.75e-12 | 3.01e-01 | 0.1131 |
| 23673 | STX12 | P10T-E | Human | Esophagus | ESCC | 2.26e-35 | 6.49e-01 | 0.116 |
| 23673 | STX12 | P11T-E | Human | Esophagus | ESCC | 3.68e-08 | 5.65e-01 | 0.1426 |
| 23673 | STX12 | P12T-E | Human | Esophagus | ESCC | 2.61e-15 | 2.16e-01 | 0.1122 |
| 23673 | STX12 | P15T-E | Human | Esophagus | ESCC | 9.17e-20 | 4.63e-01 | 0.1149 |
| 23673 | STX12 | P16T-E | Human | Esophagus | ESCC | 1.44e-15 | 2.22e-01 | 0.1153 |
| 23673 | STX12 | P17T-E | Human | Esophagus | ESCC | 3.03e-05 | 2.11e-01 | 0.1278 |
| 23673 | STX12 | P19T-E | Human | Esophagus | ESCC | 1.18e-06 | 8.38e-01 | 0.1662 |
| 23673 | STX12 | P20T-E | Human | Esophagus | ESCC | 6.13e-22 | 4.04e-01 | 0.1124 |
| 23673 | STX12 | P21T-E | Human | Esophagus | ESCC | 5.42e-39 | 6.86e-01 | 0.1617 |
| Page: 1 2 3 4 5 6 |
| Tissue | Expression Dynamics | Abbreviation |
| Esophagus |  | ESCC: Esophageal squamous cell carcinoma |
| HGIN: High-grade intraepithelial neoplasias | ||
| LGIN: Low-grade intraepithelial neoplasias | ||
| Liver | 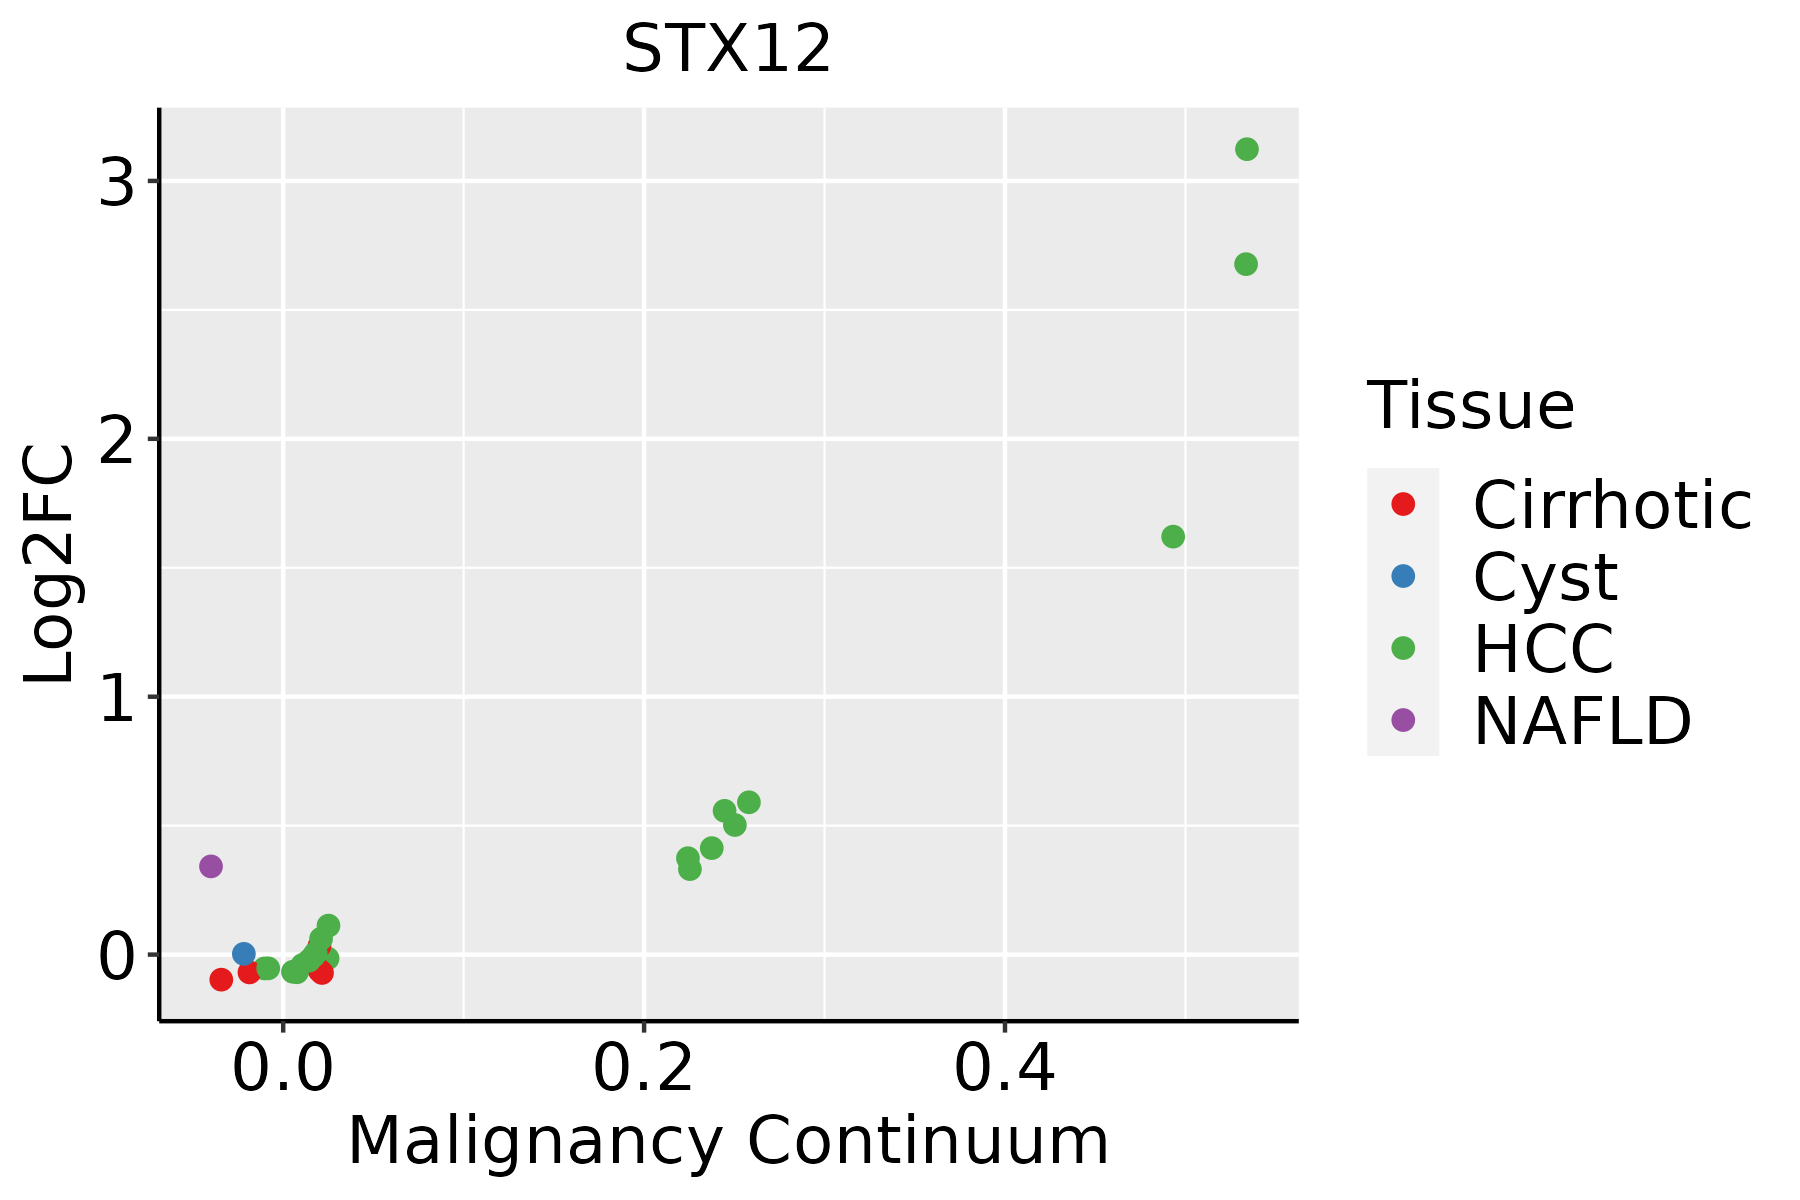 | HCC: Hepatocellular carcinoma |
| NAFLD: Non-alcoholic fatty liver disease | ||
| Oral Cavity |  | EOLP: Erosive Oral lichen planus |
| LP: leukoplakia | ||
| NEOLP: Non-erosive oral lichen planus | ||
| OSCC: Oral squamous cell carcinoma | ||
| Thyroid | 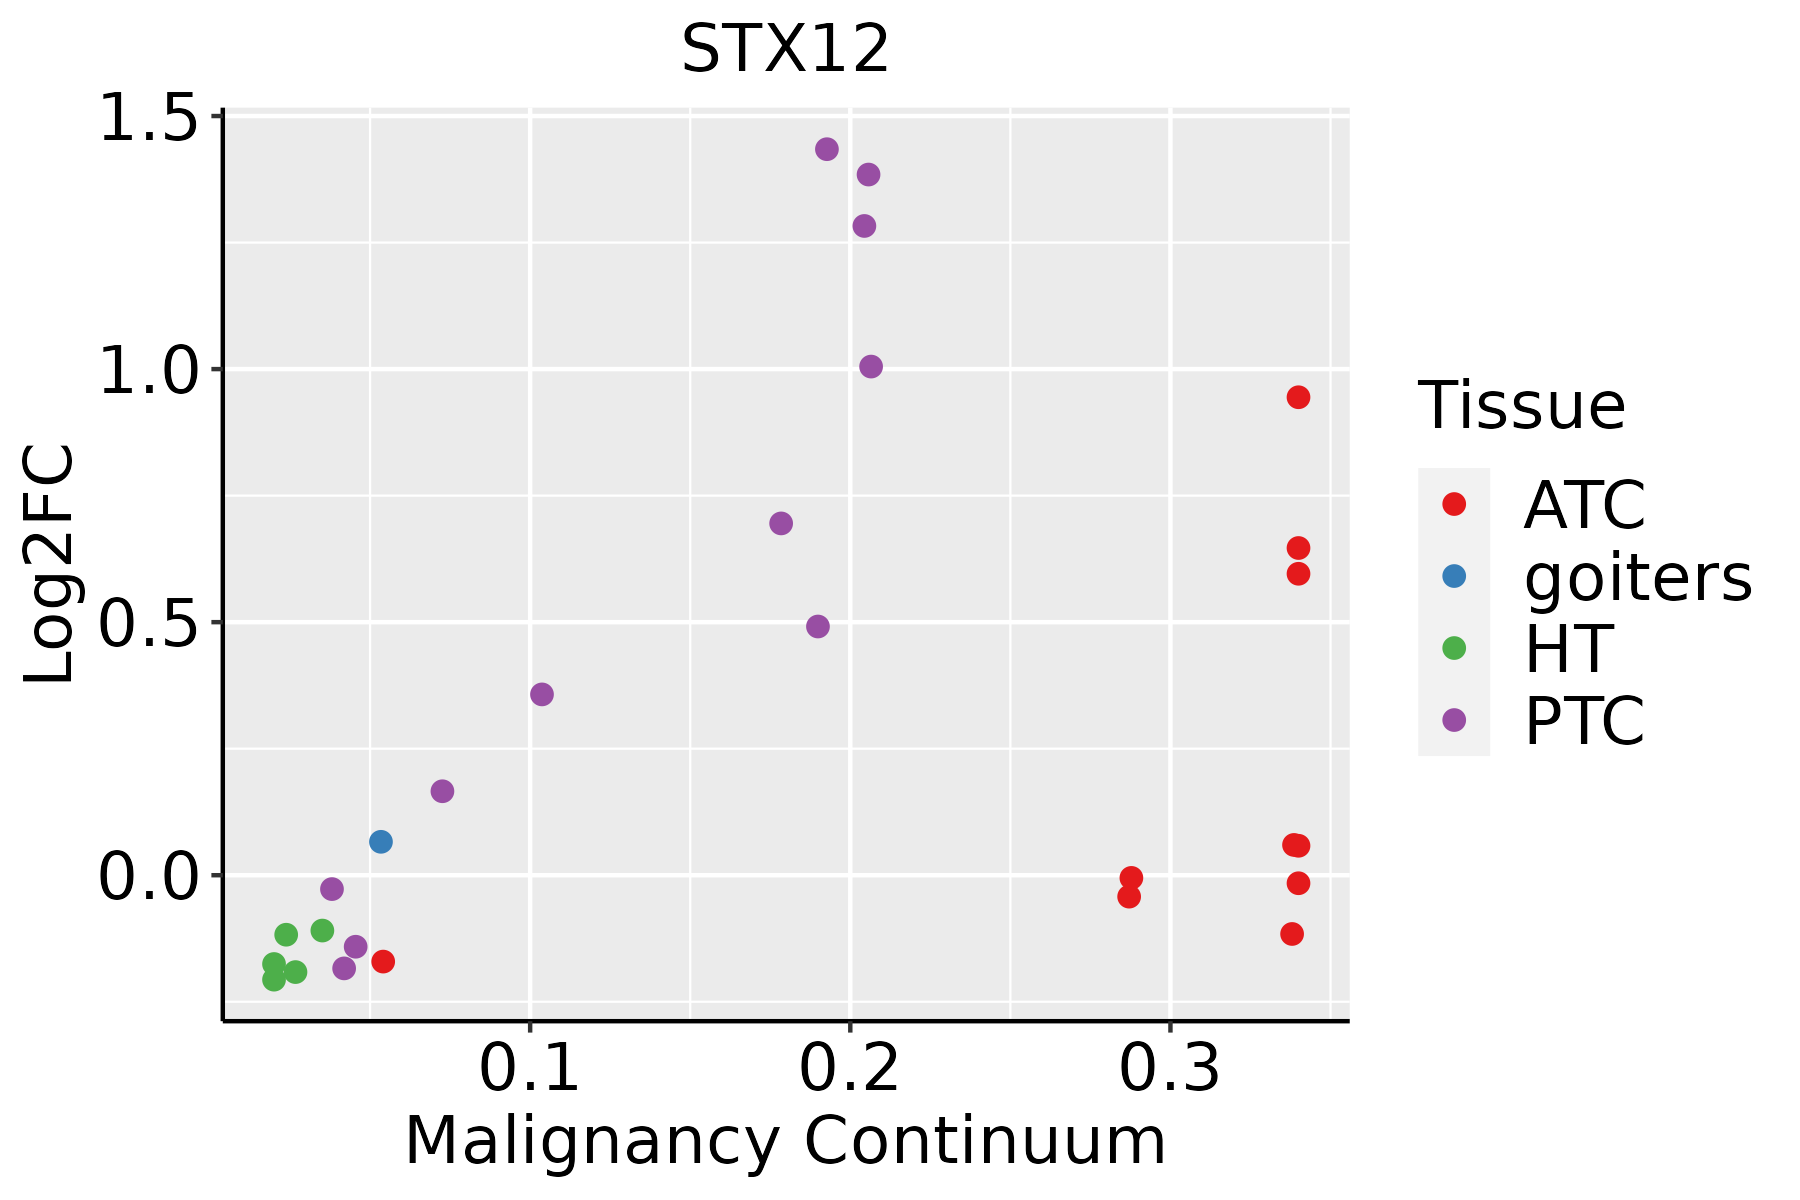 | ATC: Anaplastic thyroid cancer |
| HT: Hashimoto's thyroiditis | ||
| PTC: Papillary thyroid cancer |
| ∗log2FC in expression of this searched gene in stem-like cells from each diseased tissue sample relative to stem-like cells in normal samples in each tissue plotted against the malignancy continuum. Samples are colored based on if they are from different disease stage. |
Top |
Malignant transformation related pathway analysis |
| Find out the enriched GO biological processes and KEGG pathways involved in transition from healthy to precancer to cancer |
| Tissue | Disease Stage | Enriched GO biological Processes |
| Colorectum | AD |  |
| Colorectum | SER |  |
| Colorectum | MSS |  |
| Colorectum | MSI-H |  |
| Colorectum | FAP |  |
| ∗Top 15 enriched GO BP terms are showed in the bar plot of each disease state in each tissue. Each row represents a significant GO biological process which is colored according to the -log10(p.adjust). |
| Page: 1 2 3 4 5 6 7 8 9 |
| GO ID | Tissue | Disease Stage | Description | Gene Ratio | Bg Ratio | pvalue | p.adjust | Count |
| GO:0031647111 | Esophagus | ESCC | regulation of protein stability | 223/8552 | 298/18723 | 5.76e-25 | 1.52e-22 | 223 |
| GO:001623617 | Esophagus | ESCC | macroautophagy | 216/8552 | 291/18723 | 1.94e-23 | 4.57e-21 | 216 |
| GO:001605014 | Esophagus | ESCC | vesicle organization | 211/8552 | 300/18723 | 2.85e-18 | 2.87e-16 | 211 |
| GO:0050821111 | Esophagus | ESCC | protein stabilization | 140/8552 | 191/18723 | 6.50e-15 | 3.61e-13 | 140 |
| GO:000703314 | Esophagus | ESCC | vacuole organization | 127/8552 | 180/18723 | 1.04e-11 | 3.85e-10 | 127 |
| GO:190503712 | Esophagus | ESCC | autophagosome organization | 73/8552 | 103/18723 | 1.88e-07 | 2.93e-06 | 73 |
| GO:00482844 | Esophagus | ESCC | organelle fusion | 94/8552 | 141/18723 | 3.72e-07 | 5.16e-06 | 94 |
| GO:00224069 | Esophagus | ESCC | membrane docking | 62/8552 | 86/18723 | 5.93e-07 | 7.79e-06 | 62 |
| GO:000004513 | Esophagus | ESCC | autophagosome assembly | 69/8552 | 99/18723 | 1.10e-06 | 1.38e-05 | 69 |
| GO:00901743 | Esophagus | ESCC | organelle membrane fusion | 73/8552 | 110/18723 | 9.29e-06 | 8.88e-05 | 73 |
| GO:00069063 | Esophagus | ESCC | vesicle fusion | 70/8552 | 106/18723 | 1.82e-05 | 1.60e-04 | 70 |
| GO:01400567 | Esophagus | ESCC | organelle localization by membrane tethering | 53/8552 | 77/18723 | 3.33e-05 | 2.74e-04 | 53 |
| GO:00610254 | Esophagus | ESCC | membrane fusion | 98/8552 | 163/18723 | 1.39e-04 | 9.41e-04 | 98 |
| GO:00482781 | Esophagus | ESCC | vesicle docking | 38/8552 | 59/18723 | 2.86e-03 | 1.21e-02 | 38 |
| GO:003164712 | Liver | Cirrhotic | regulation of protein stability | 144/4634 | 298/18723 | 6.74e-19 | 1.28e-16 | 144 |
| GO:005082112 | Liver | Cirrhotic | protein stabilization | 97/4634 | 191/18723 | 6.67e-15 | 6.97e-13 | 97 |
| GO:001605011 | Liver | Cirrhotic | vesicle organization | 133/4634 | 300/18723 | 7.35e-14 | 6.41e-12 | 133 |
| GO:001623611 | Liver | Cirrhotic | macroautophagy | 129/4634 | 291/18723 | 1.75e-13 | 1.41e-11 | 129 |
| GO:00070332 | Liver | Cirrhotic | vacuole organization | 80/4634 | 180/18723 | 5.73e-09 | 2.25e-07 | 80 |
| GO:00224065 | Liver | Cirrhotic | membrane docking | 39/4634 | 86/18723 | 2.47e-05 | 3.22e-04 | 39 |
| Page: 1 2 3 4 5 6 7 |
| Pathway ID | Tissue | Disease Stage | Description | Gene Ratio | Bg Ratio | pvalue | p.adjust | qvalue | Count |
| hsa0414530 | Esophagus | ESCC | Phagosome | 100/4205 | 152/8465 | 3.81e-05 | 1.72e-04 | 8.82e-05 | 100 |
| hsa04145114 | Esophagus | ESCC | Phagosome | 100/4205 | 152/8465 | 3.81e-05 | 1.72e-04 | 8.82e-05 | 100 |
| hsa0414514 | Liver | Cirrhotic | Phagosome | 73/2530 | 152/8465 | 1.61e-06 | 1.78e-05 | 1.10e-05 | 73 |
| hsa0414515 | Liver | Cirrhotic | Phagosome | 73/2530 | 152/8465 | 1.61e-06 | 1.78e-05 | 1.10e-05 | 73 |
| hsa0414521 | Liver | HCC | Phagosome | 93/4020 | 152/8465 | 4.27e-04 | 1.88e-03 | 1.05e-03 | 93 |
| hsa0414531 | Liver | HCC | Phagosome | 93/4020 | 152/8465 | 4.27e-04 | 1.88e-03 | 1.05e-03 | 93 |
| hsa0414528 | Oral cavity | OSCC | Phagosome | 88/3704 | 152/8465 | 2.83e-04 | 9.13e-04 | 4.65e-04 | 88 |
| hsa04145113 | Oral cavity | OSCC | Phagosome | 88/3704 | 152/8465 | 2.83e-04 | 9.13e-04 | 4.65e-04 | 88 |
| hsa0414529 | Oral cavity | LP | Phagosome | 73/2418 | 152/8465 | 2.37e-07 | 3.29e-06 | 2.12e-06 | 73 |
| hsa0414536 | Oral cavity | LP | Phagosome | 73/2418 | 152/8465 | 2.37e-07 | 3.29e-06 | 2.12e-06 | 73 |
| hsa0414543 | Oral cavity | EOLP | Phagosome | 38/1218 | 152/8465 | 3.42e-04 | 1.42e-03 | 8.35e-04 | 38 |
| hsa0414553 | Oral cavity | EOLP | Phagosome | 38/1218 | 152/8465 | 3.42e-04 | 1.42e-03 | 8.35e-04 | 38 |
| hsa0414561 | Oral cavity | NEOLP | Phagosome | 32/1112 | 152/8465 | 4.15e-03 | 1.67e-02 | 1.05e-02 | 32 |
| hsa0414571 | Oral cavity | NEOLP | Phagosome | 32/1112 | 152/8465 | 4.15e-03 | 1.67e-02 | 1.05e-02 | 32 |
| Page: 1 |
Top |
Cell-cell communication analysis |
| Identification of potential cell-cell interactions between two cell types and their ligand-receptor pairs for different disease states |
| Ligand | Receptor | LRpair | Pathway | Tissue | Disease Stage |
| Page: 1 |
Top |
Single-cell gene regulatory network inference analysis |
| Find out the significant the regulons (TFs) and the target genes of each regulon across cell types for different disease states |
| TF | Cell Type | Tissue | Disease Stage | Target Gene | RSS | Regulon Activity |
| ∗The dot plots of a searched regulon are shown for all cell subpopulations in each disease state of each tissue based on the regulon specific score inferred using pySCENIC and by calculating the average expression. |
| Page: 1 |
Top |
Somatic mutation of malignant transformation related genes |
| Annotation of somatic variants for genes involved in malignant transformation |
| Hugo Symbol | Variant Class | Variant Classification | dbSNP RS | HGVSc | HGVSp | HGVSp Short | SWISSPROT | BIOTYPE | SIFT | PolyPhen | Tumor Sample Barcode | Tissue | Histology | Sex | Age | Stage | Therapy Types | Drugs | Outcome |
| STX12 | SNV | Missense_Mutation | c.354N>T | p.Gln118His | p.Q118H | Q86Y82 | protein_coding | deleterious(0) | probably_damaging(0.998) | TCGA-D8-A147-01 | Breast | breast invasive carcinoma | Female | <65 | I/II | Chemotherapy | doxorubicine | SD | |
| STX12 | SNV | Missense_Mutation | rs377420642 | c.565C>T | p.Arg189Trp | p.R189W | Q86Y82 | protein_coding | deleterious(0) | probably_damaging(0.993) | TCGA-AA-3510-01 | Colorectum | colon adenocarcinoma | Male | >=65 | I/II | Unknown | Unknown | SD |
| STX12 | deletion | In_Frame_Del | novel | c.40_45delCCCTCG | p.Pro14_Ser15del | p.P14_S15del | Q86Y82 | protein_coding | TCGA-AA-3532-01 | Colorectum | colon adenocarcinoma | Male | <65 | I/II | Unknown | Unknown | SD | ||
| STX12 | insertion | In_Frame_Ins | novel | c.617_618insTATTAA | p.Ala206_Met207insIleAsn | p.A206_M207insIN | Q86Y82 | protein_coding | TCGA-AM-5820-01 | Colorectum | colon adenocarcinoma | Female | <65 | I/II | Unknown | Unknown | SD | ||
| STX12 | SNV | Missense_Mutation | novel | c.132N>T | p.Lys44Asn | p.K44N | Q86Y82 | protein_coding | tolerated(0.07) | benign(0.091) | TCGA-A5-A2K5-01 | Endometrium | uterine corpus endometrioid carcinoma | Female | >=65 | I/II | Unknown | Unknown | SD |
| STX12 | SNV | Missense_Mutation | c.653N>T | p.Ser218Ile | p.S218I | Q86Y82 | protein_coding | deleterious(0) | probably_damaging(0.983) | TCGA-AP-A0LM-01 | Endometrium | uterine corpus endometrioid carcinoma | Female | <65 | III/IV | Chemotherapy | cisplatin | SD | |
| STX12 | SNV | Missense_Mutation | c.610N>T | p.Asp204Tyr | p.D204Y | Q86Y82 | protein_coding | deleterious(0) | probably_damaging(0.998) | TCGA-AX-A05Z-01 | Endometrium | uterine corpus endometrioid carcinoma | Female | <65 | III/IV | Chemotherapy | adriamycin | SD | |
| STX12 | SNV | Missense_Mutation | novel | c.289N>T | p.Arg97Cys | p.R97C | Q86Y82 | protein_coding | deleterious(0) | probably_damaging(0.997) | TCGA-B5-A1MR-01 | Endometrium | uterine corpus endometrioid carcinoma | Female | >=65 | III/IV | Unknown | Unknown | SD |
| STX12 | SNV | Missense_Mutation | novel | c.595N>G | p.Asn199Asp | p.N199D | Q86Y82 | protein_coding | deleterious(0) | probably_damaging(0.997) | TCGA-BG-A222-01 | Endometrium | uterine corpus endometrioid carcinoma | Female | <65 | I/II | Unknown | Unknown | SD |
| STX12 | SNV | Missense_Mutation | novel | c.337N>A | p.Ala113Thr | p.A113T | Q86Y82 | protein_coding | tolerated(0.05) | probably_damaging(0.949) | TCGA-EO-A3B0-01 | Endometrium | uterine corpus endometrioid carcinoma | Female | <65 | III/IV | Unknown | Unknown | SD |
| Page: 1 2 |
Top |
Related drugs of malignant transformation related genes |
| Identification of chemicals and drugs interact with genes involved in malignant transfromation |
| (DGIdb 4.0) |
| Entrez ID | Symbol | Category | Interaction Types | Drug Claim Name | Drug Name | PMIDs |
| Page: 1 |

Copyright 2023-Present -The University of Texas Health Science Center at Houston |