
|
|||||
|
 | |
| |
| |
| |
| |
| |
|
Gene: STX11 |
Gene summary for STX11 |
| Gene information | Species | Human | Gene symbol | STX11 | Gene ID | 8676 |
| Gene name | syntaxin 11 | |
| Gene Alias | FHL4 | |
| Cytomap | 6q24.2 | |
| Gene Type | protein-coding | GO ID | GO:0001505 | UniProtAcc | O75558 |
Top |
Malignant transformation analysis |
| Identification of the aberrant gene expression in precancerous and cancerous lesions by comparing the gene expression of stem-like cells in diseased tissues with normal stem cells |
| Entrez ID | Symbol | Replicates | Species | Organ | Tissue | Adj P-value | Log2FC | Malignancy |
| 8676 | STX11 | LZE7T | Human | Esophagus | ESCC | 2.85e-02 | 2.49e-01 | 0.0667 |
| 8676 | STX11 | P5T-E | Human | Esophagus | ESCC | 3.90e-04 | 1.70e-01 | 0.1327 |
| 8676 | STX11 | P9T-E | Human | Esophagus | ESCC | 1.52e-06 | 1.49e-01 | 0.1131 |
| 8676 | STX11 | P11T-E | Human | Esophagus | ESCC | 1.04e-06 | 3.43e-01 | 0.1426 |
| 8676 | STX11 | P12T-E | Human | Esophagus | ESCC | 2.99e-04 | -1.74e-02 | 0.1122 |
| 8676 | STX11 | P22T-E | Human | Esophagus | ESCC | 1.92e-02 | -3.52e-02 | 0.1236 |
| 8676 | STX11 | P24T-E | Human | Esophagus | ESCC | 4.11e-05 | 1.73e-01 | 0.1287 |
| 8676 | STX11 | P28T-E | Human | Esophagus | ESCC | 2.30e-21 | 5.78e-01 | 0.1149 |
| 8676 | STX11 | P40T-E | Human | Esophagus | ESCC | 1.53e-02 | 2.69e-01 | 0.109 |
| 8676 | STX11 | P47T-E | Human | Esophagus | ESCC | 8.40e-03 | 2.68e-02 | 0.1067 |
| 8676 | STX11 | P49T-E | Human | Esophagus | ESCC | 3.22e-04 | 9.34e-01 | 0.1768 |
| 8676 | STX11 | P62T-E | Human | Esophagus | ESCC | 4.89e-07 | 4.11e-01 | 0.1302 |
| 8676 | STX11 | P74T-E | Human | Esophagus | ESCC | 1.04e-02 | 3.07e-01 | 0.1479 |
| 8676 | STX11 | P75T-E | Human | Esophagus | ESCC | 6.27e-05 | 3.15e-01 | 0.1125 |
| 8676 | STX11 | P107T-E | Human | Esophagus | ESCC | 3.07e-24 | 9.71e-01 | 0.171 |
| 8676 | STX11 | C21 | Human | Oral cavity | OSCC | 2.08e-08 | 4.88e-01 | 0.2678 |
| 8676 | STX11 | C30 | Human | Oral cavity | OSCC | 1.07e-17 | 9.11e-01 | 0.3055 |
| 8676 | STX11 | C38 | Human | Oral cavity | OSCC | 7.55e-04 | 4.41e-01 | 0.172 |
| 8676 | STX11 | C57 | Human | Oral cavity | OSCC | 2.46e-04 | 2.90e-01 | 0.1679 |
| 8676 | STX11 | C06 | Human | Oral cavity | OSCC | 2.82e-02 | 5.69e-01 | 0.2699 |
| Page: 1 2 |
| Tissue | Expression Dynamics | Abbreviation |
| Esophagus | 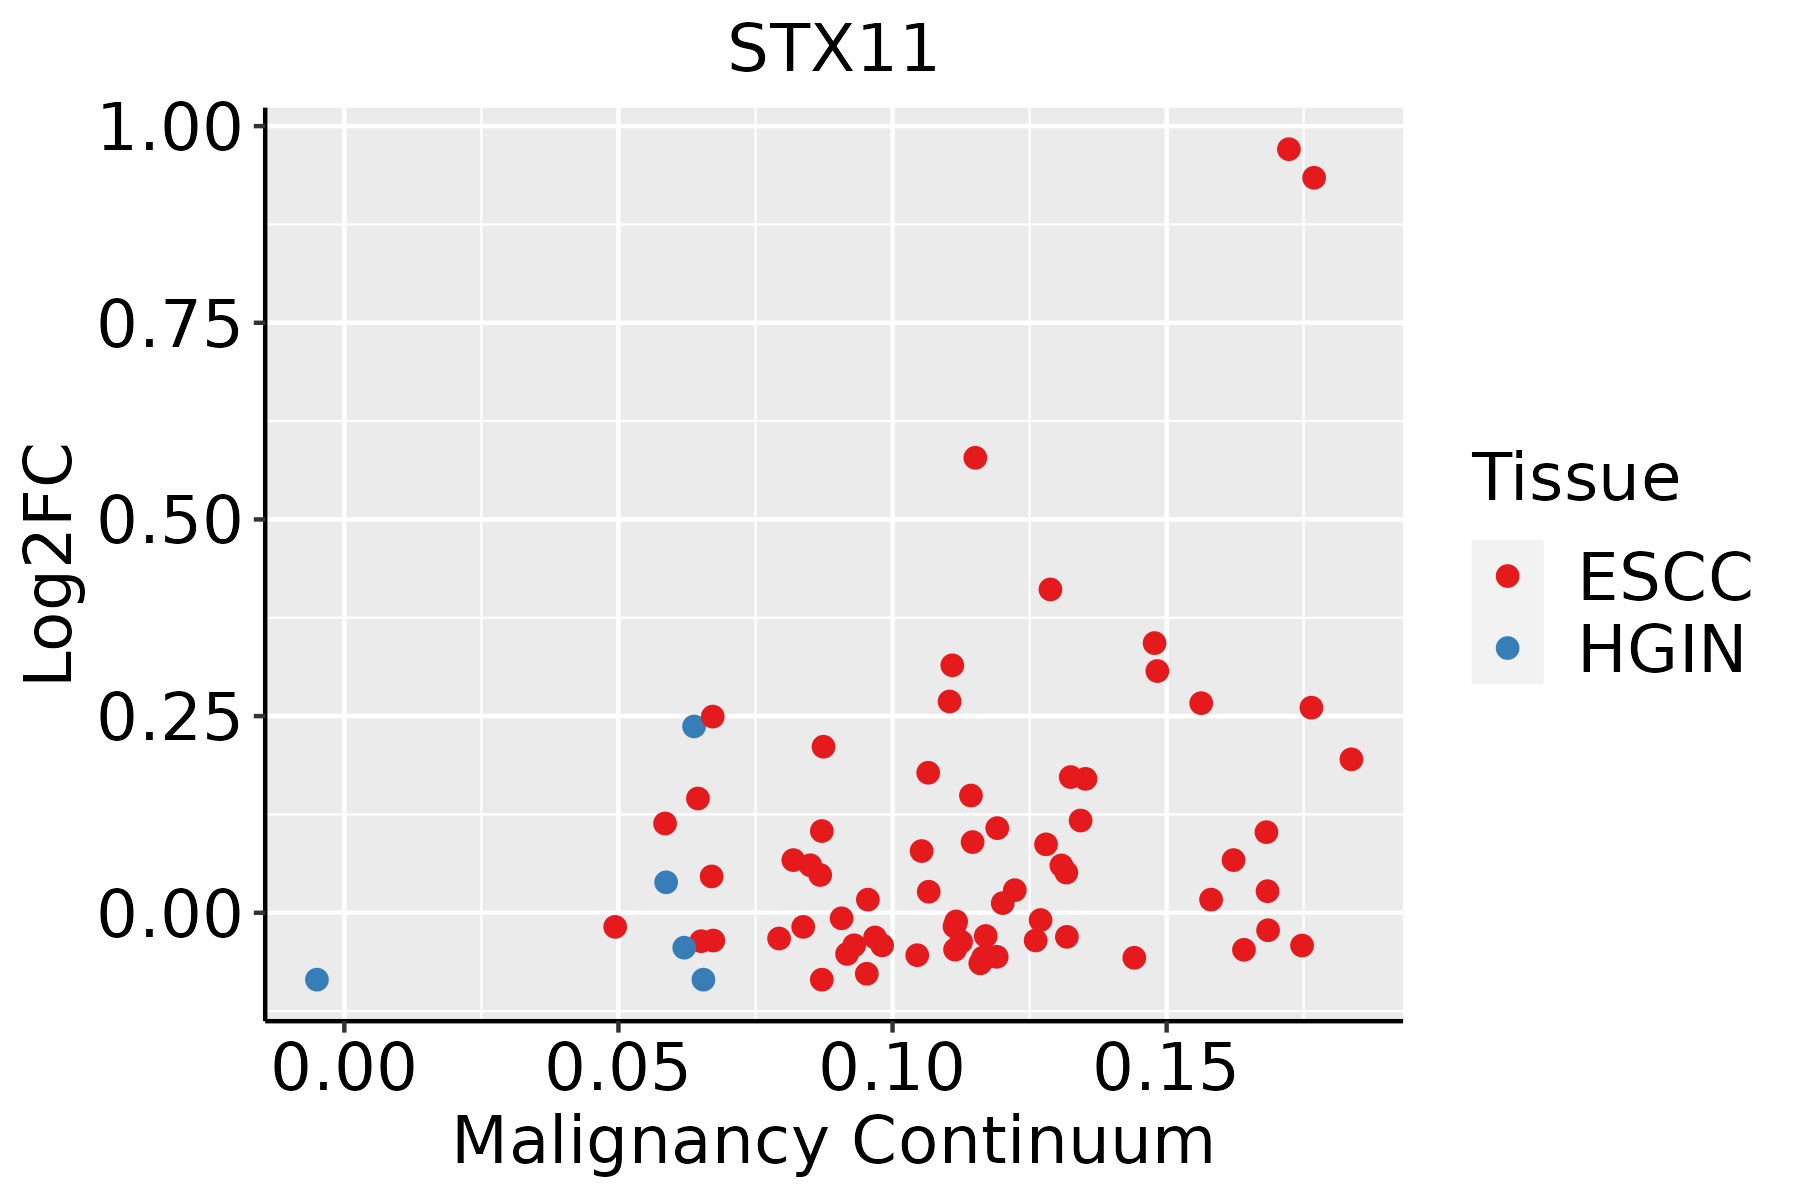 | ESCC: Esophageal squamous cell carcinoma |
| HGIN: High-grade intraepithelial neoplasias | ||
| LGIN: Low-grade intraepithelial neoplasias | ||
| Oral Cavity | 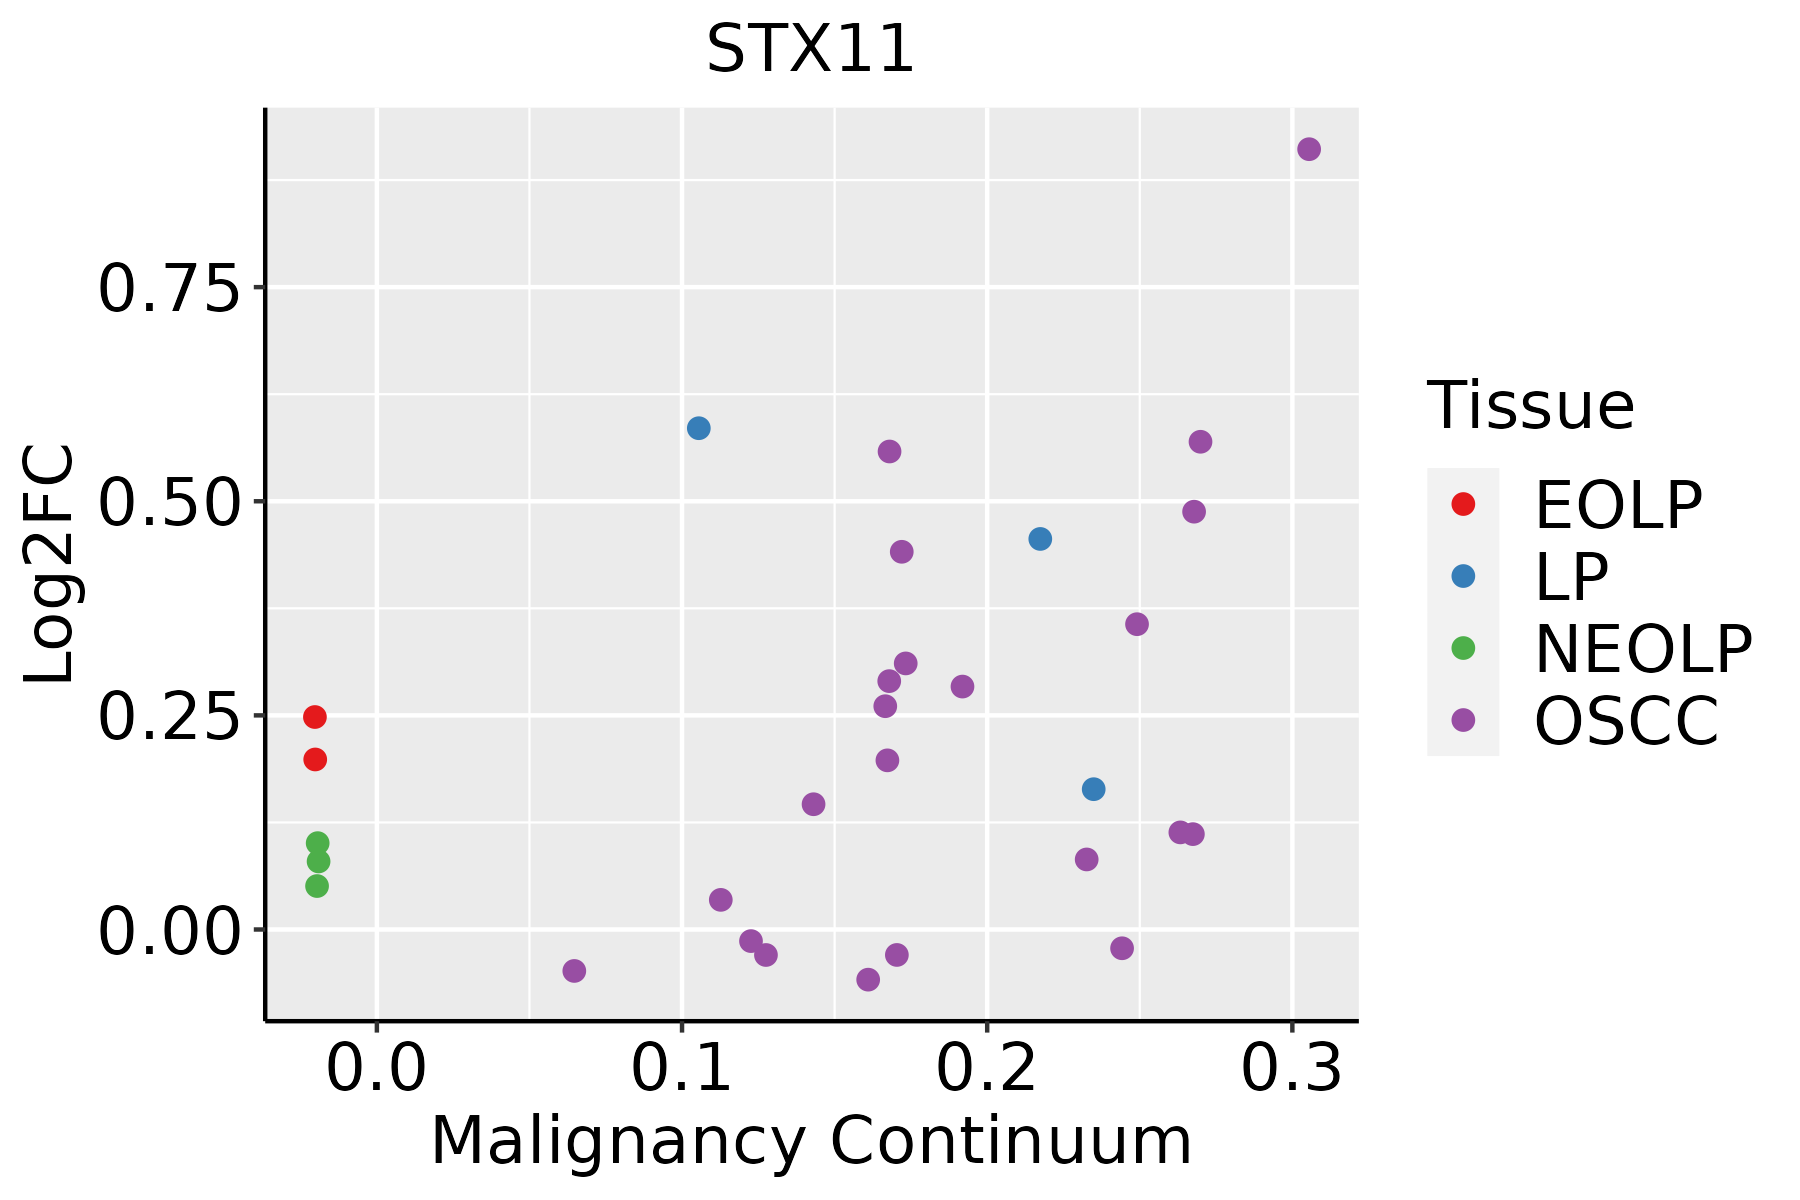 | EOLP: Erosive Oral lichen planus |
| LP: leukoplakia | ||
| NEOLP: Non-erosive oral lichen planus | ||
| OSCC: Oral squamous cell carcinoma |
| ∗log2FC in expression of this searched gene in stem-like cells from each diseased tissue sample relative to stem-like cells in normal samples in each tissue plotted against the malignancy continuum. Samples are colored based on if they are from different disease stage. |
Top |
Malignant transformation related pathway analysis |
| Find out the enriched GO biological processes and KEGG pathways involved in transition from healthy to precancer to cancer |
| Tissue | Disease Stage | Enriched GO biological Processes |
| Colorectum | AD |  |
| Colorectum | SER |  |
| Colorectum | MSS |  |
| Colorectum | MSI-H |  |
| Colorectum | FAP |  |
| ∗Top 15 enriched GO BP terms are showed in the bar plot of each disease state in each tissue. Each row represents a significant GO biological process which is colored according to the -log10(p.adjust). |
| Page: 1 2 3 4 5 6 7 8 9 |
| GO ID | Tissue | Disease Stage | Description | Gene Ratio | Bg Ratio | pvalue | p.adjust | Count |
| GO:001605014 | Esophagus | ESCC | vesicle organization | 211/8552 | 300/18723 | 2.85e-18 | 2.87e-16 | 211 |
| GO:00482844 | Esophagus | ESCC | organelle fusion | 94/8552 | 141/18723 | 3.72e-07 | 5.16e-06 | 94 |
| GO:00224069 | Esophagus | ESCC | membrane docking | 62/8552 | 86/18723 | 5.93e-07 | 7.79e-06 | 62 |
| GO:00901743 | Esophagus | ESCC | organelle membrane fusion | 73/8552 | 110/18723 | 9.29e-06 | 8.88e-05 | 73 |
| GO:00069063 | Esophagus | ESCC | vesicle fusion | 70/8552 | 106/18723 | 1.82e-05 | 1.60e-04 | 70 |
| GO:01400567 | Esophagus | ESCC | organelle localization by membrane tethering | 53/8552 | 77/18723 | 3.33e-05 | 2.74e-04 | 53 |
| GO:00610254 | Esophagus | ESCC | membrane fusion | 98/8552 | 163/18723 | 1.39e-04 | 9.41e-04 | 98 |
| GO:00482781 | Esophagus | ESCC | vesicle docking | 38/8552 | 59/18723 | 2.86e-03 | 1.21e-02 | 38 |
| GO:00160508 | Oral cavity | OSCC | vesicle organization | 189/7305 | 300/18723 | 2.40e-17 | 2.14e-15 | 189 |
| GO:00482843 | Oral cavity | OSCC | organelle fusion | 82/7305 | 141/18723 | 3.08e-06 | 3.72e-05 | 82 |
| GO:00224068 | Oral cavity | OSCC | membrane docking | 52/7305 | 86/18723 | 4.50e-05 | 3.84e-04 | 52 |
| GO:00901742 | Oral cavity | OSCC | organelle membrane fusion | 63/7305 | 110/18723 | 7.75e-05 | 6.01e-04 | 63 |
| GO:00069062 | Oral cavity | OSCC | vesicle fusion | 61/7305 | 106/18723 | 8.28e-05 | 6.35e-04 | 61 |
| GO:00610253 | Oral cavity | OSCC | membrane fusion | 84/7305 | 163/18723 | 7.56e-04 | 4.12e-03 | 84 |
| GO:01400566 | Oral cavity | OSCC | organelle localization by membrane tethering | 43/7305 | 77/18723 | 2.00e-03 | 9.28e-03 | 43 |
| GO:001605013 | Oral cavity | LP | vesicle organization | 128/4623 | 300/18723 | 4.96e-12 | 3.98e-10 | 128 |
| GO:004828412 | Oral cavity | LP | organelle fusion | 56/4623 | 141/18723 | 5.55e-05 | 7.62e-04 | 56 |
| GO:002240613 | Oral cavity | LP | membrane docking | 38/4623 | 86/18723 | 5.97e-05 | 8.13e-04 | 38 |
| GO:000690611 | Oral cavity | LP | vesicle fusion | 44/4623 | 106/18723 | 1.01e-04 | 1.24e-03 | 44 |
| GO:009017411 | Oral cavity | LP | organelle membrane fusion | 45/4623 | 110/18723 | 1.28e-04 | 1.49e-03 | 45 |
| Page: 1 2 |
| Pathway ID | Tissue | Disease Stage | Description | Gene Ratio | Bg Ratio | pvalue | p.adjust | qvalue | Count |
| hsa041305 | Esophagus | ESCC | SNARE interactions in vesicular transport | 28/4205 | 33/8465 | 2.75e-05 | 1.32e-04 | 6.75e-05 | 28 |
| hsa0413012 | Esophagus | ESCC | SNARE interactions in vesicular transport | 28/4205 | 33/8465 | 2.75e-05 | 1.32e-04 | 6.75e-05 | 28 |
| hsa0413021 | Oral cavity | LP | SNARE interactions in vesicular transport | 22/2418 | 33/8465 | 6.00e-06 | 4.76e-05 | 3.07e-05 | 22 |
| hsa0413031 | Oral cavity | LP | SNARE interactions in vesicular transport | 22/2418 | 33/8465 | 6.00e-06 | 4.76e-05 | 3.07e-05 | 22 |
| Page: 1 |
Top |
Cell-cell communication analysis |
| Identification of potential cell-cell interactions between two cell types and their ligand-receptor pairs for different disease states |
| Ligand | Receptor | LRpair | Pathway | Tissue | Disease Stage |
| Page: 1 |
Top |
Single-cell gene regulatory network inference analysis |
| Find out the significant the regulons (TFs) and the target genes of each regulon across cell types for different disease states |
| TF | Cell Type | Tissue | Disease Stage | Target Gene | RSS | Regulon Activity |
| ∗The dot plots of a searched regulon are shown for all cell subpopulations in each disease state of each tissue based on the regulon specific score inferred using pySCENIC and by calculating the average expression. |
| Page: 1 |
Top |
Somatic mutation of malignant transformation related genes |
| Annotation of somatic variants for genes involved in malignant transformation |
| Hugo Symbol | Variant Class | Variant Classification | dbSNP RS | HGVSc | HGVSp | HGVSp Short | SWISSPROT | BIOTYPE | SIFT | PolyPhen | Tumor Sample Barcode | Tissue | Histology | Sex | Age | Stage | Therapy Types | Drugs | Outcome |
| STX11 | SNV | Missense_Mutation | c.313N>T | p.Arg105Cys | p.R105C | O75558 | protein_coding | tolerated(0.14) | benign(0.035) | TCGA-A8-A09Z-01 | Breast | breast invasive carcinoma | Female | >=65 | I/II | Unknown | Unknown | SD | |
| STX11 | SNV | Missense_Mutation | c.85C>A | p.Pro29Thr | p.P29T | O75558 | protein_coding | tolerated(0.16) | benign(0.017) | TCGA-BH-A0C0-01 | Breast | breast invasive carcinoma | Female | <65 | I/II | Chemotherapy | carboplatin | SD | |
| STX11 | deletion | Frame_Shift_Del | novel | c.648delN | p.Leu217TrpfsTer26 | p.L217Wfs*26 | O75558 | protein_coding | TCGA-D8-A27V-01 | Breast | breast invasive carcinoma | Female | <65 | I/II | Hormone Therapy | tamoxiphen | SD | ||
| STX11 | SNV | Missense_Mutation | c.124N>C | p.Glu42Gln | p.E42Q | O75558 | protein_coding | tolerated(0.16) | possibly_damaging(0.643) | TCGA-EK-A2RJ-01 | Cervix | cervical & endocervical cancer | Female | <65 | I/II | Unknown | Unknown | SD | |
| STX11 | SNV | Missense_Mutation | novel | c.496N>C | p.Glu166Gln | p.E166Q | O75558 | protein_coding | deleterious(0.01) | benign(0.206) | TCGA-JW-A5VL-01 | Cervix | cervical & endocervical cancer | Female | <65 | I/II | Unknown | Unknown | SD |
| STX11 | SNV | Missense_Mutation | c.313C>T | p.Arg105Cys | p.R105C | O75558 | protein_coding | tolerated(0.14) | benign(0.035) | TCGA-JW-A69B-01 | Cervix | cervical & endocervical cancer | Female | <65 | I/II | Unknown | Unknown | SD | |
| STX11 | SNV | Missense_Mutation | c.599N>T | p.Ala200Val | p.A200V | O75558 | protein_coding | deleterious(0.01) | possibly_damaging(0.701) | TCGA-A6-6780-01 | Colorectum | colon adenocarcinoma | Male | >=65 | I/II | Unknown | Unknown | SD | |
| STX11 | SNV | Missense_Mutation | c.422N>A | p.Arg141His | p.R141H | O75558 | protein_coding | tolerated(0.1) | benign(0) | TCGA-AA-3492-01 | Colorectum | colon adenocarcinoma | Female | >=65 | I/II | Unknown | Unknown | SD | |
| STX11 | SNV | Missense_Mutation | rs763642990 | c.463N>A | p.Asp155Asn | p.D155N | O75558 | protein_coding | tolerated(0.07) | benign(0.029) | TCGA-AA-3715-01 | Colorectum | colon adenocarcinoma | Male | >=65 | I/II | Unknown | Unknown | PD |
| STX11 | SNV | Missense_Mutation | rs758653019 | c.764N>G | p.Tyr255Cys | p.Y255C | O75558 | protein_coding | tolerated(0.09) | possibly_damaging(0.779) | TCGA-AA-3715-01 | Colorectum | colon adenocarcinoma | Male | >=65 | I/II | Unknown | Unknown | PD |
| Page: 1 2 3 4 5 6 |
Top |
Related drugs of malignant transformation related genes |
| Identification of chemicals and drugs interact with genes involved in malignant transfromation |
| (DGIdb 4.0) |
| Entrez ID | Symbol | Category | Interaction Types | Drug Claim Name | Drug Name | PMIDs |
| 8676 | STX11 | NA | emapalumab | EMAPALUMAB | ||
| 8676 | STX11 | NA | Emapalumab-lzsg | EMAPALUMAB |
| Page: 1 |

Copyright 2023-Present -The University of Texas Health Science Center at Houston |