
|
|||||
|
 | |
| |
| |
| |
| |
| |
|
Gene: STX10 |
Gene summary for STX10 |
| Gene information | Species | Human | Gene symbol | STX10 | Gene ID | 8677 |
| Gene name | syntaxin 10 | |
| Gene Alias | SYN10 | |
| Cytomap | 19p13.13 | |
| Gene Type | protein-coding | GO ID | GO:0006810 | UniProtAcc | X6R2W0 |
Top |
Malignant transformation analysis |
| Identification of the aberrant gene expression in precancerous and cancerous lesions by comparing the gene expression of stem-like cells in diseased tissues with normal stem cells |
| Entrez ID | Symbol | Replicates | Species | Organ | Tissue | Adj P-value | Log2FC | Malignancy |
| 8677 | STX10 | LZE4T | Human | Esophagus | ESCC | 1.72e-04 | 1.95e-01 | 0.0811 |
| 8677 | STX10 | LZE5T | Human | Esophagus | ESCC | 4.78e-06 | 3.65e-01 | 0.0514 |
| 8677 | STX10 | LZE7T | Human | Esophagus | ESCC | 6.50e-08 | 7.31e-01 | 0.0667 |
| 8677 | STX10 | LZE8T | Human | Esophagus | ESCC | 2.01e-04 | 2.17e-01 | 0.067 |
| 8677 | STX10 | LZE20T | Human | Esophagus | ESCC | 8.48e-09 | 7.99e-02 | 0.0662 |
| 8677 | STX10 | LZE22T | Human | Esophagus | ESCC | 1.09e-04 | 2.39e-01 | 0.068 |
| 8677 | STX10 | LZE24T | Human | Esophagus | ESCC | 1.35e-15 | 5.20e-01 | 0.0596 |
| 8677 | STX10 | LZE6T | Human | Esophagus | ESCC | 2.72e-08 | 5.69e-01 | 0.0845 |
| 8677 | STX10 | P1T-E | Human | Esophagus | ESCC | 1.27e-15 | 9.04e-01 | 0.0875 |
| 8677 | STX10 | P2T-E | Human | Esophagus | ESCC | 4.83e-19 | 3.14e-01 | 0.1177 |
| 8677 | STX10 | P4T-E | Human | Esophagus | ESCC | 8.84e-26 | 6.83e-01 | 0.1323 |
| 8677 | STX10 | P5T-E | Human | Esophagus | ESCC | 1.21e-34 | 7.17e-01 | 0.1327 |
| 8677 | STX10 | P8T-E | Human | Esophagus | ESCC | 1.33e-32 | 5.45e-01 | 0.0889 |
| 8677 | STX10 | P9T-E | Human | Esophagus | ESCC | 2.95e-21 | 6.20e-01 | 0.1131 |
| 8677 | STX10 | P10T-E | Human | Esophagus | ESCC | 2.45e-25 | 4.25e-01 | 0.116 |
| 8677 | STX10 | P11T-E | Human | Esophagus | ESCC | 1.49e-19 | 8.33e-01 | 0.1426 |
| 8677 | STX10 | P12T-E | Human | Esophagus | ESCC | 2.74e-29 | 5.26e-01 | 0.1122 |
| 8677 | STX10 | P15T-E | Human | Esophagus | ESCC | 5.37e-21 | 4.12e-01 | 0.1149 |
| 8677 | STX10 | P16T-E | Human | Esophagus | ESCC | 3.30e-23 | 4.69e-01 | 0.1153 |
| 8677 | STX10 | P17T-E | Human | Esophagus | ESCC | 3.06e-14 | 5.54e-01 | 0.1278 |
| Page: 1 2 3 4 5 6 |
| Tissue | Expression Dynamics | Abbreviation |
| Esophagus | 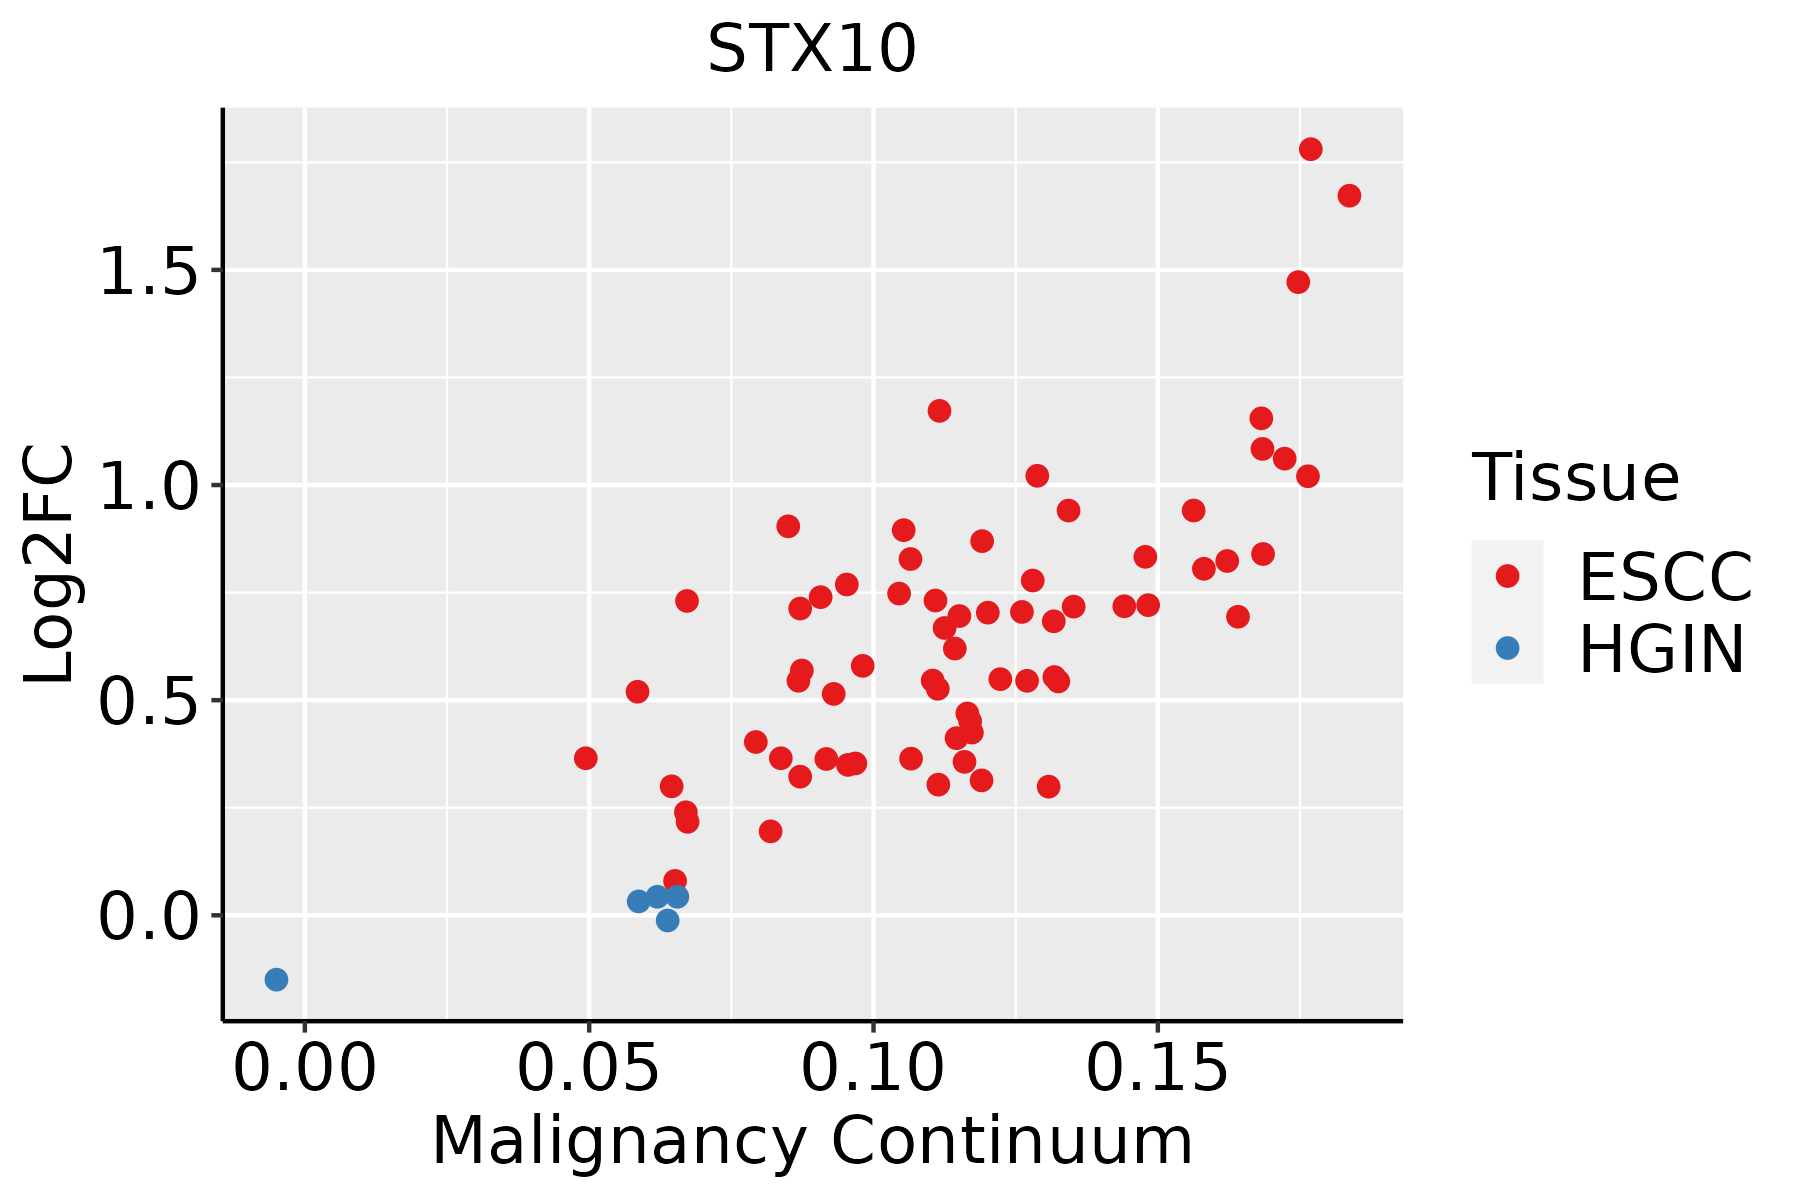 | ESCC: Esophageal squamous cell carcinoma |
| HGIN: High-grade intraepithelial neoplasias | ||
| LGIN: Low-grade intraepithelial neoplasias | ||
| Liver | 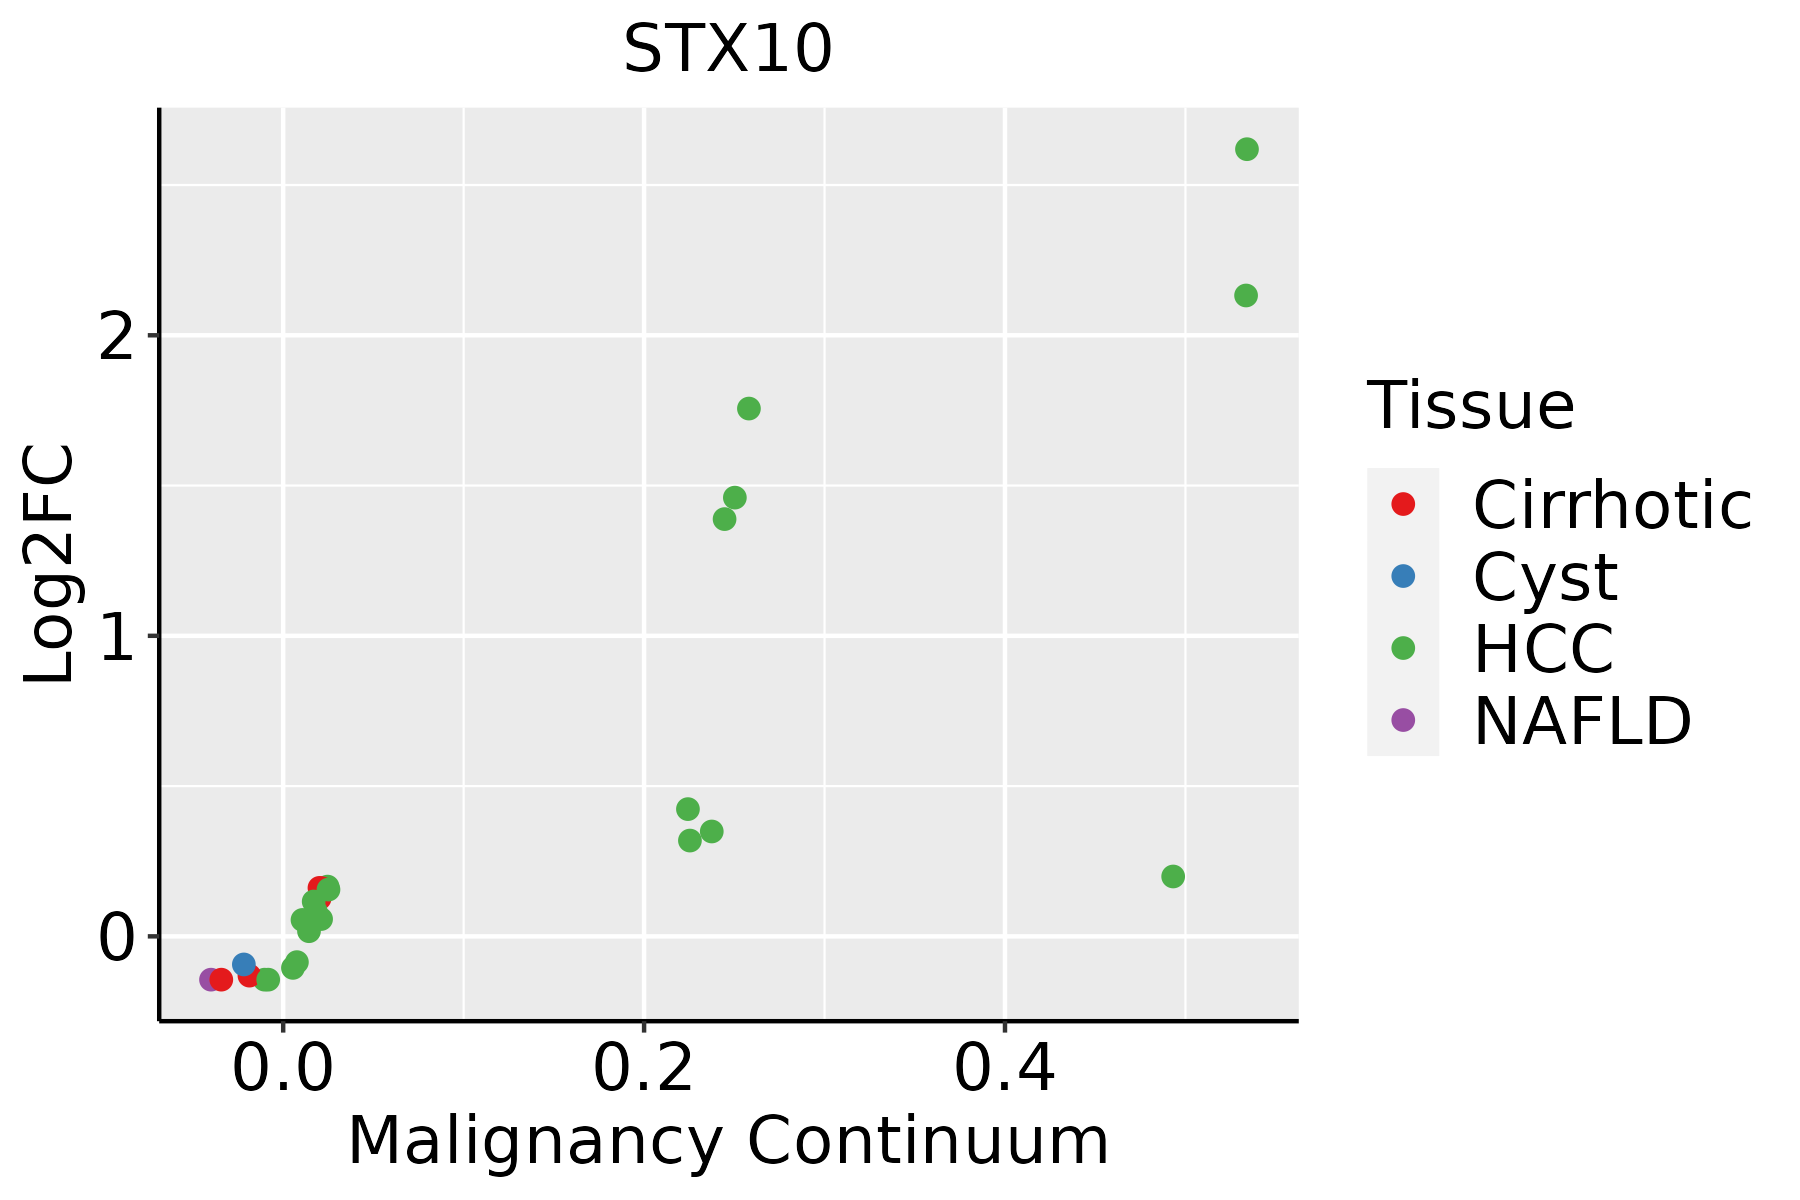 | HCC: Hepatocellular carcinoma |
| NAFLD: Non-alcoholic fatty liver disease | ||
| Oral Cavity | 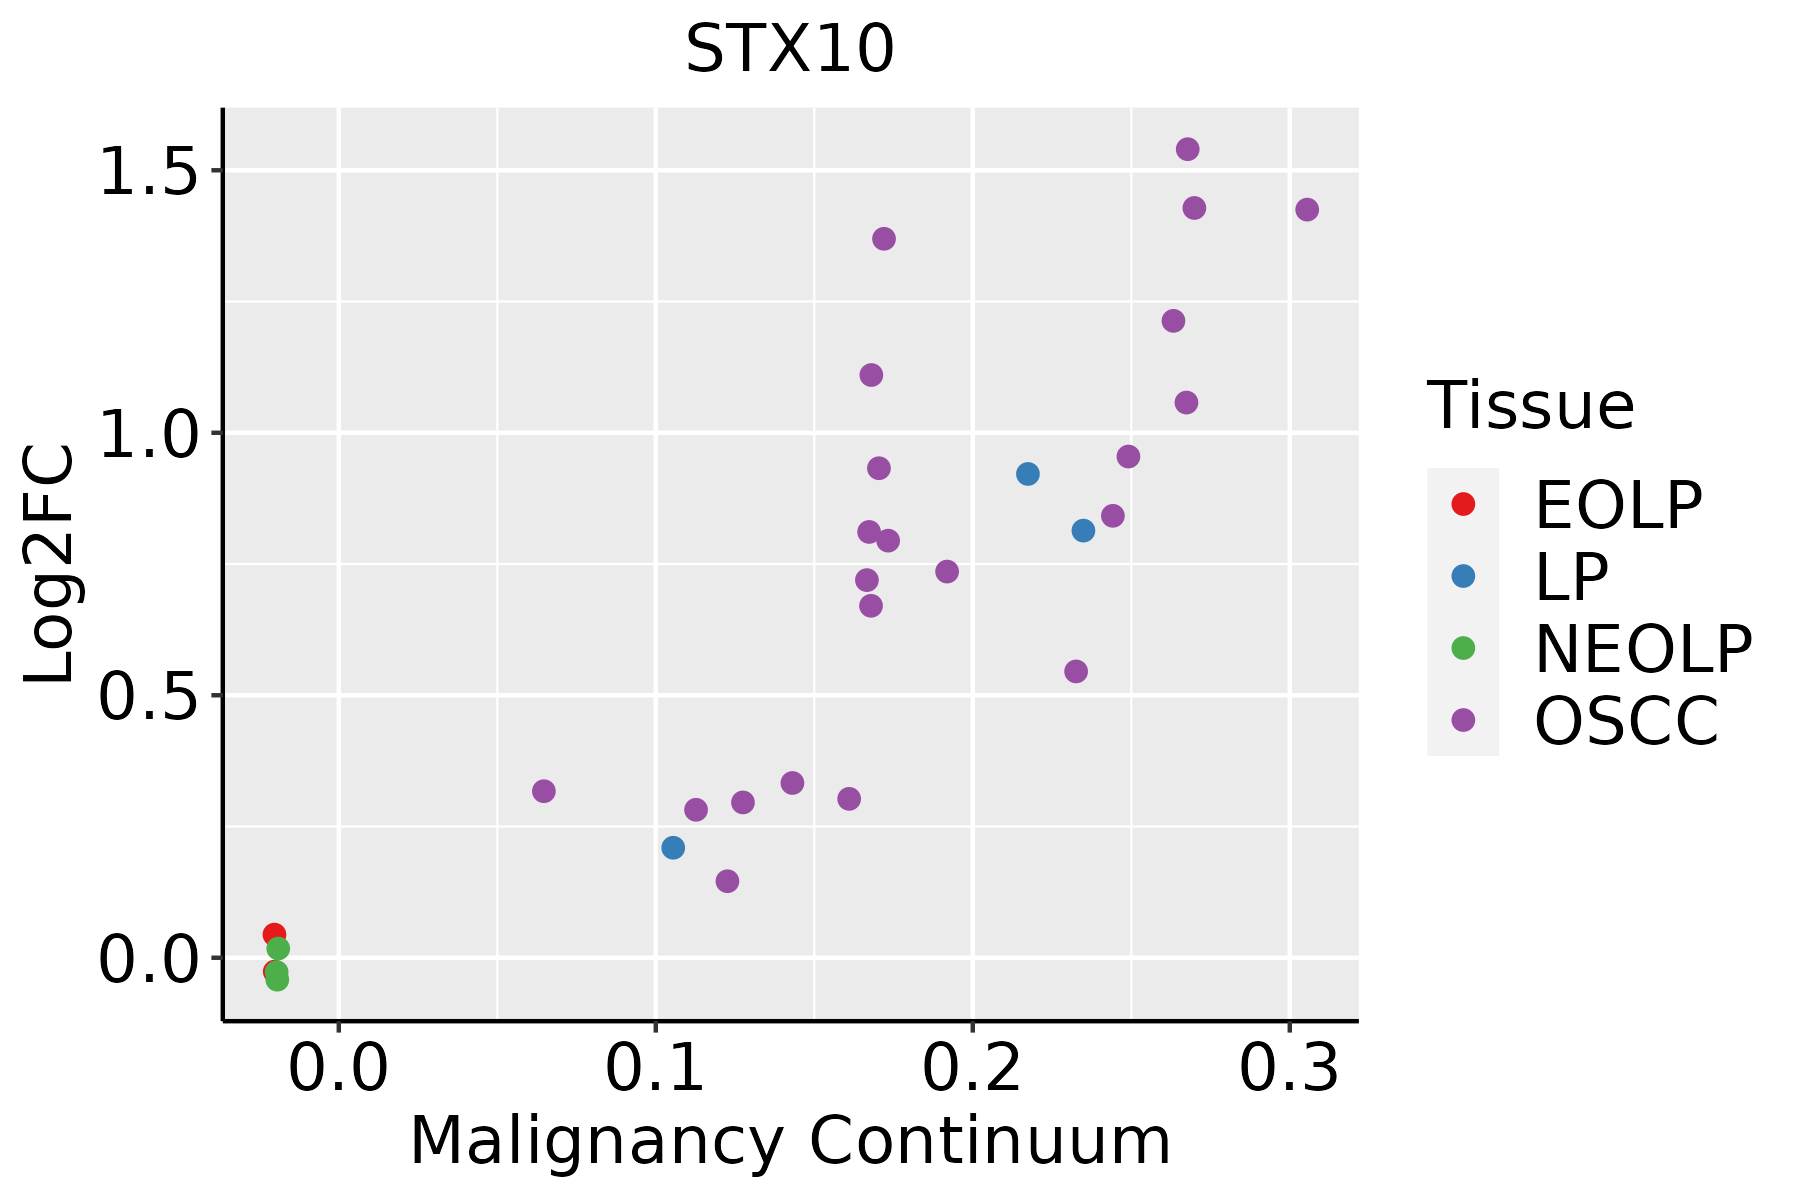 | EOLP: Erosive Oral lichen planus |
| LP: leukoplakia | ||
| NEOLP: Non-erosive oral lichen planus | ||
| OSCC: Oral squamous cell carcinoma | ||
| Skin | 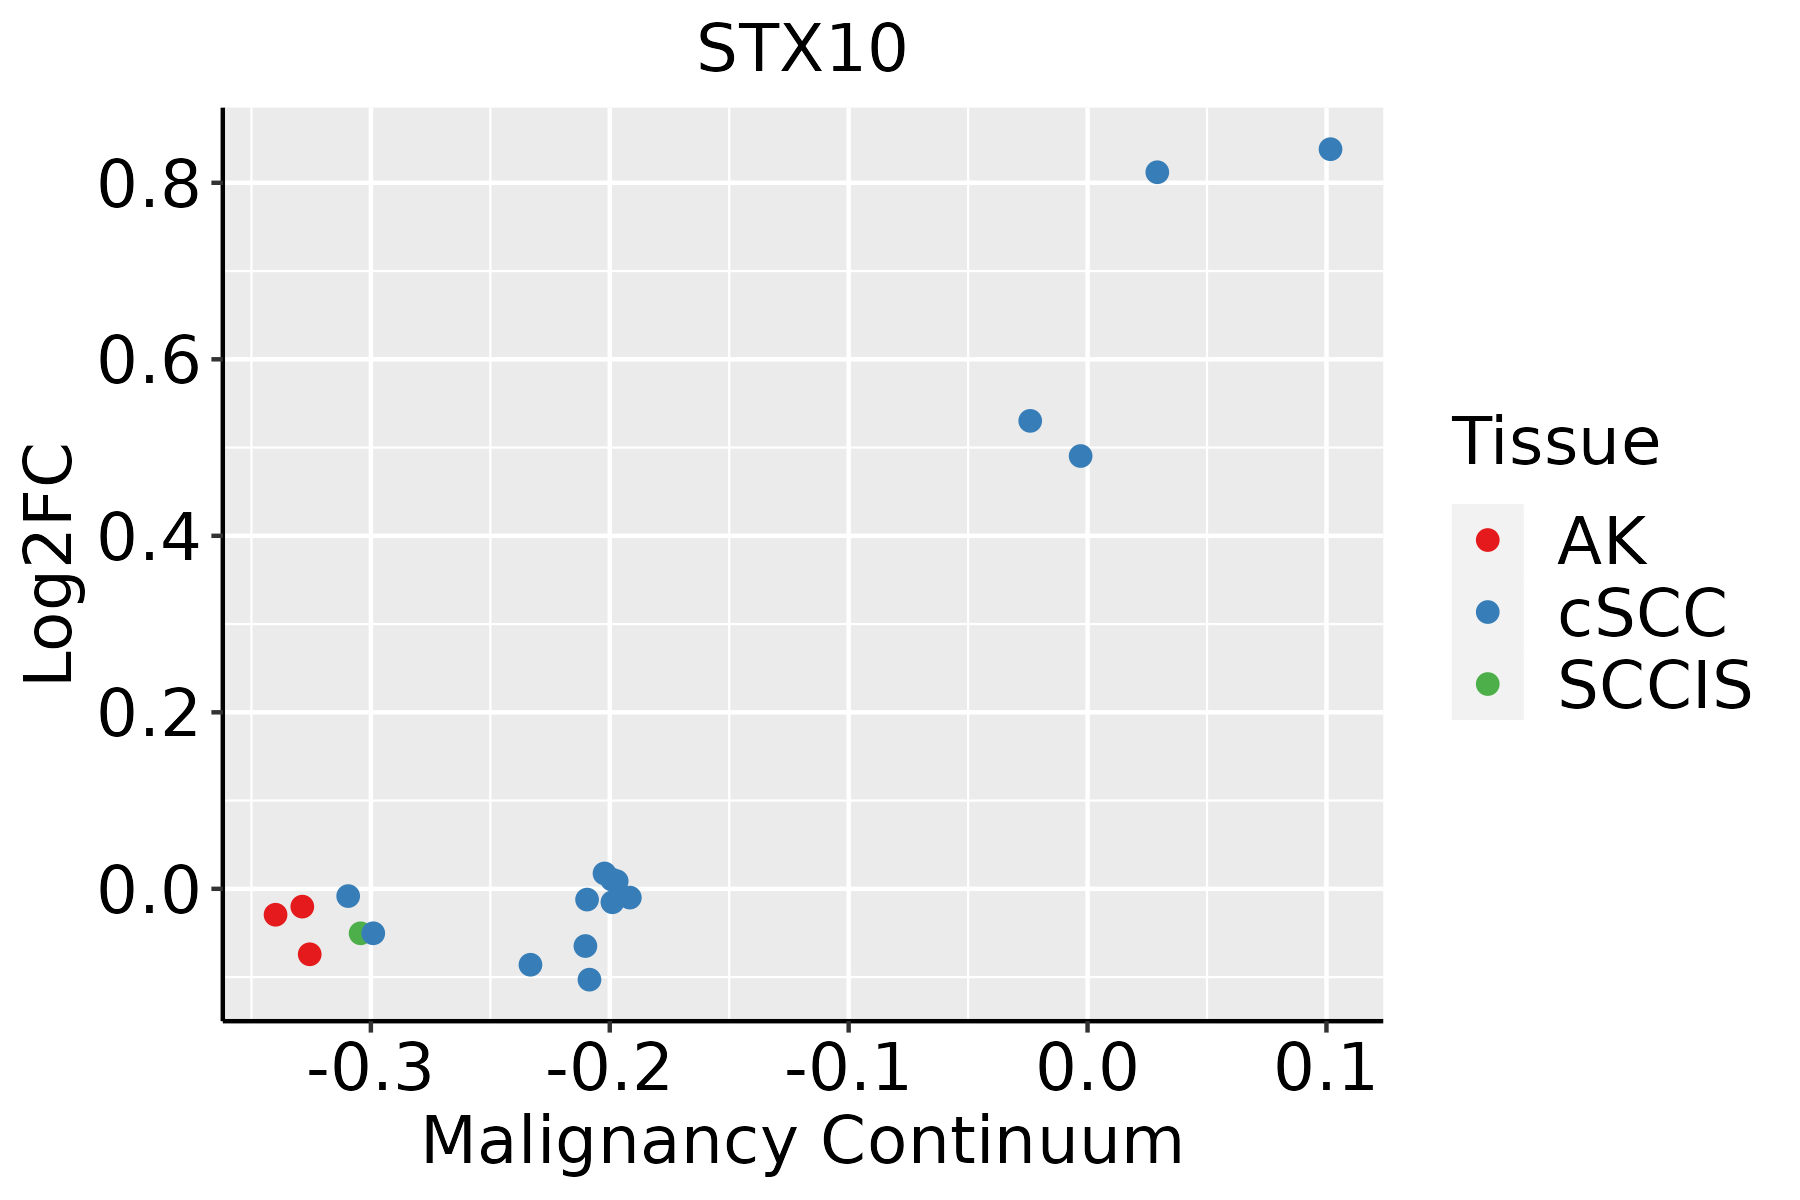 | AK: Actinic keratosis |
| cSCC: Cutaneous squamous cell carcinoma | ||
| SCCIS:squamous cell carcinoma in situ | ||
| Thyroid | 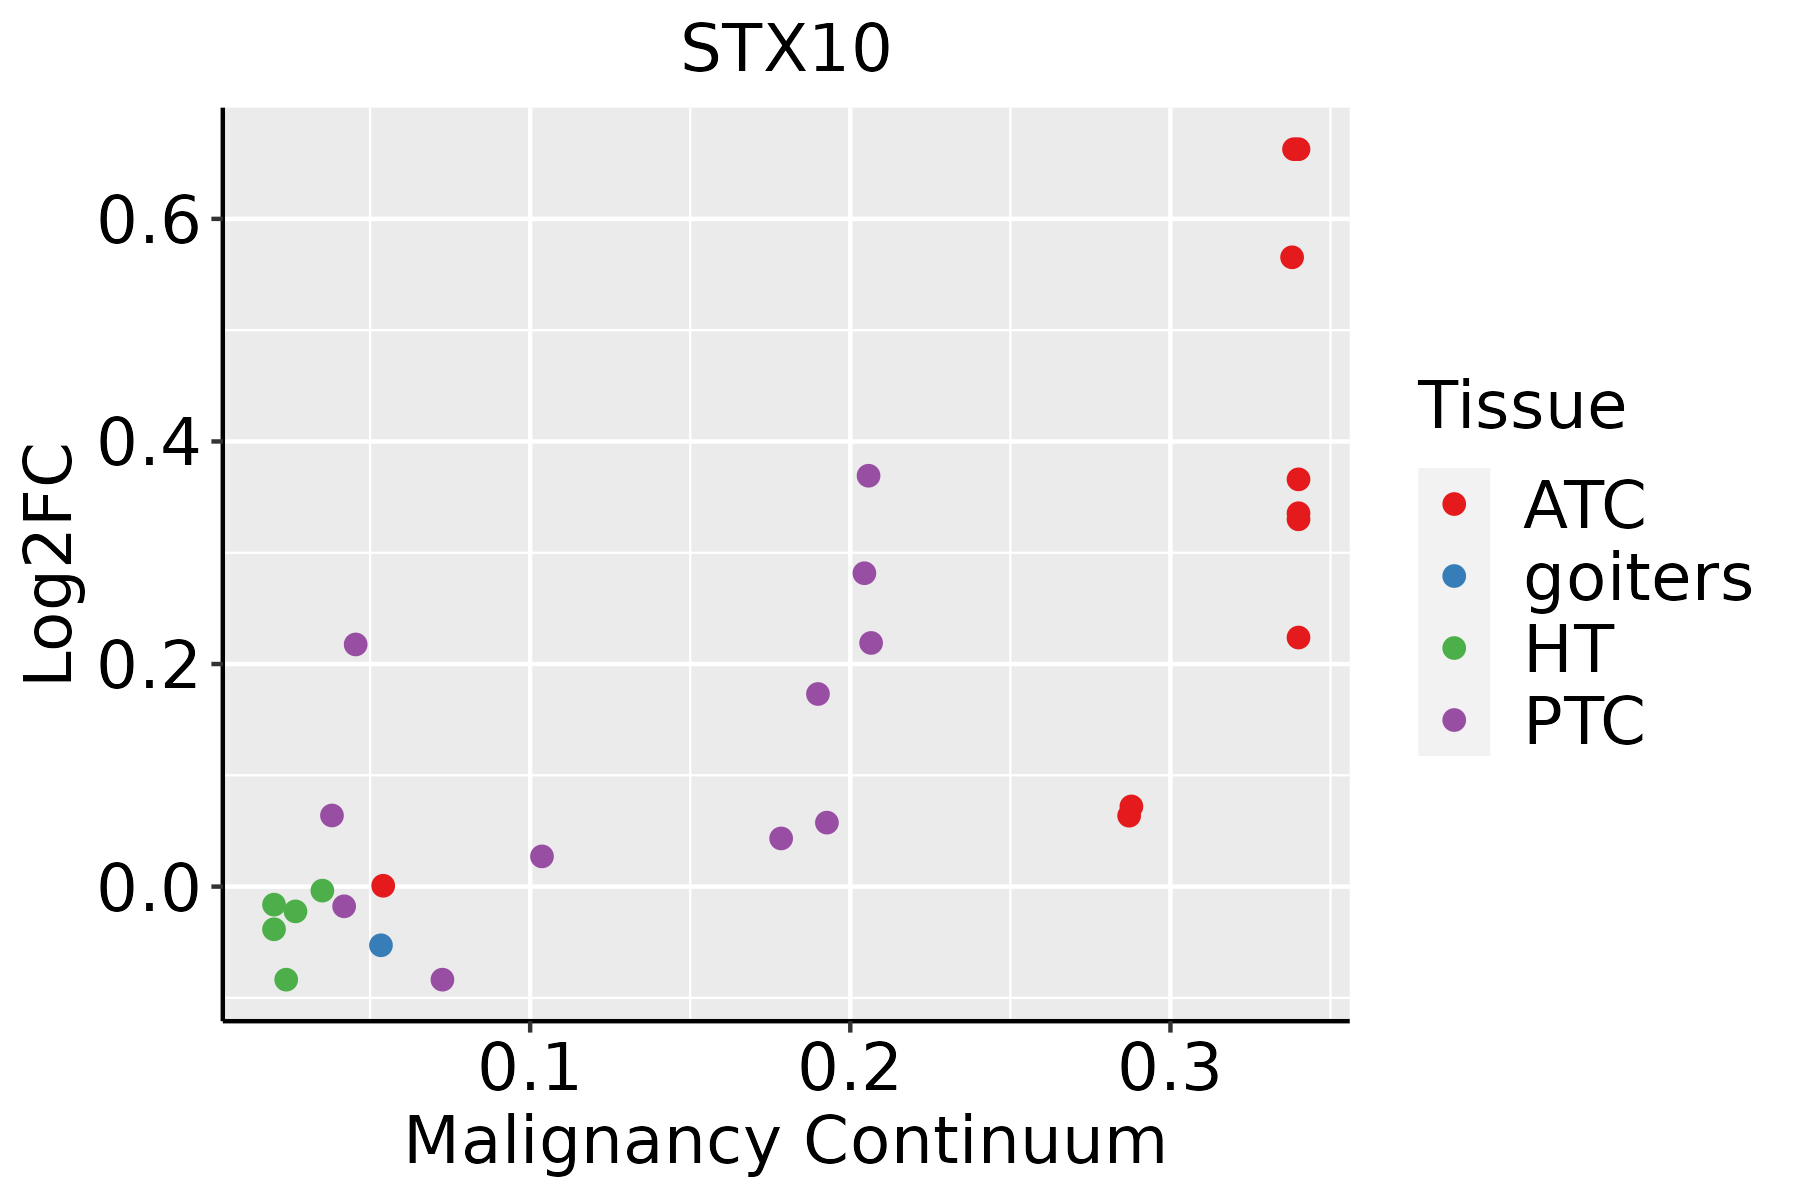 | ATC: Anaplastic thyroid cancer |
| HT: Hashimoto's thyroiditis | ||
| PTC: Papillary thyroid cancer |
| ∗log2FC in expression of this searched gene in stem-like cells from each diseased tissue sample relative to stem-like cells in normal samples in each tissue plotted against the malignancy continuum. Samples are colored based on if they are from different disease stage. |
Top |
Malignant transformation related pathway analysis |
| Find out the enriched GO biological processes and KEGG pathways involved in transition from healthy to precancer to cancer |
| Tissue | Disease Stage | Enriched GO biological Processes |
| Colorectum | AD |  |
| Colorectum | SER |  |
| Colorectum | MSS |  |
| Colorectum | MSI-H |  |
| Colorectum | FAP |  |
| ∗Top 15 enriched GO BP terms are showed in the bar plot of each disease state in each tissue. Each row represents a significant GO biological process which is colored according to the -log10(p.adjust). |
| Page: 1 2 3 4 5 6 7 8 9 |
| GO ID | Tissue | Disease Stage | Description | Gene Ratio | Bg Ratio | pvalue | p.adjust | Count |
| GO:001605014 | Esophagus | ESCC | vesicle organization | 211/8552 | 300/18723 | 2.85e-18 | 2.87e-16 | 211 |
| GO:001619715 | Esophagus | ESCC | endosomal transport | 168/8552 | 230/18723 | 2.28e-17 | 1.93e-15 | 168 |
| GO:001648210 | Esophagus | ESCC | cytosolic transport | 124/8552 | 168/18723 | 9.69e-14 | 4.69e-12 | 124 |
| GO:00482844 | Esophagus | ESCC | organelle fusion | 94/8552 | 141/18723 | 3.72e-07 | 5.16e-06 | 94 |
| GO:00224069 | Esophagus | ESCC | membrane docking | 62/8552 | 86/18723 | 5.93e-07 | 7.79e-06 | 62 |
| GO:00421477 | Esophagus | ESCC | retrograde transport, endosome to Golgi | 63/8552 | 91/18723 | 4.58e-06 | 4.87e-05 | 63 |
| GO:00901743 | Esophagus | ESCC | organelle membrane fusion | 73/8552 | 110/18723 | 9.29e-06 | 8.88e-05 | 73 |
| GO:00069063 | Esophagus | ESCC | vesicle fusion | 70/8552 | 106/18723 | 1.82e-05 | 1.60e-04 | 70 |
| GO:01400567 | Esophagus | ESCC | organelle localization by membrane tethering | 53/8552 | 77/18723 | 3.33e-05 | 2.74e-04 | 53 |
| GO:00610254 | Esophagus | ESCC | membrane fusion | 98/8552 | 163/18723 | 1.39e-04 | 9.41e-04 | 98 |
| GO:00482781 | Esophagus | ESCC | vesicle docking | 38/8552 | 59/18723 | 2.86e-03 | 1.21e-02 | 38 |
| GO:001605011 | Liver | Cirrhotic | vesicle organization | 133/4634 | 300/18723 | 7.35e-14 | 6.41e-12 | 133 |
| GO:001648211 | Liver | Cirrhotic | cytosolic transport | 74/4634 | 168/18723 | 3.34e-08 | 1.12e-06 | 74 |
| GO:001619711 | Liver | Cirrhotic | endosomal transport | 93/4634 | 230/18723 | 1.01e-07 | 2.93e-06 | 93 |
| GO:00224065 | Liver | Cirrhotic | membrane docking | 39/4634 | 86/18723 | 2.47e-05 | 3.22e-04 | 39 |
| GO:01400565 | Liver | Cirrhotic | organelle localization by membrane tethering | 32/4634 | 77/18723 | 8.65e-04 | 6.23e-03 | 32 |
| GO:00482842 | Liver | Cirrhotic | organelle fusion | 52/4634 | 141/18723 | 8.77e-04 | 6.31e-03 | 52 |
| GO:0006906 | Liver | Cirrhotic | vesicle fusion | 40/4634 | 106/18723 | 2.01e-03 | 1.24e-02 | 40 |
| GO:0090174 | Liver | Cirrhotic | organelle membrane fusion | 40/4634 | 110/18723 | 4.32e-03 | 2.29e-02 | 40 |
| GO:004214711 | Liver | Cirrhotic | retrograde transport, endosome to Golgi | 34/4634 | 91/18723 | 5.01e-03 | 2.60e-02 | 34 |
| Page: 1 2 3 4 5 |
| Pathway ID | Tissue | Disease Stage | Description | Gene Ratio | Bg Ratio | pvalue | p.adjust | qvalue | Count |
| hsa05132211 | Esophagus | ESCC | Salmonella infection | 191/4205 | 249/8465 | 6.51e-19 | 5.45e-17 | 2.79e-17 | 191 |
| hsa05132310 | Esophagus | ESCC | Salmonella infection | 191/4205 | 249/8465 | 6.51e-19 | 5.45e-17 | 2.79e-17 | 191 |
| hsa0513222 | Liver | Cirrhotic | Salmonella infection | 121/2530 | 249/8465 | 2.47e-10 | 5.13e-09 | 3.16e-09 | 121 |
| hsa0513232 | Liver | Cirrhotic | Salmonella infection | 121/2530 | 249/8465 | 2.47e-10 | 5.13e-09 | 3.16e-09 | 121 |
| hsa0513242 | Liver | HCC | Salmonella infection | 178/4020 | 249/8465 | 5.90e-15 | 1.98e-13 | 1.10e-13 | 178 |
| hsa0513252 | Liver | HCC | Salmonella infection | 178/4020 | 249/8465 | 5.90e-15 | 1.98e-13 | 1.10e-13 | 178 |
| hsa0513230 | Oral cavity | OSCC | Salmonella infection | 174/3704 | 249/8465 | 2.67e-17 | 1.49e-15 | 7.58e-16 | 174 |
| hsa05132114 | Oral cavity | OSCC | Salmonella infection | 174/3704 | 249/8465 | 2.67e-17 | 1.49e-15 | 7.58e-16 | 174 |
| hsa05132210 | Oral cavity | LP | Salmonella infection | 128/2418 | 249/8465 | 1.17e-14 | 2.79e-13 | 1.80e-13 | 128 |
| hsa0513238 | Oral cavity | LP | Salmonella infection | 128/2418 | 249/8465 | 1.17e-14 | 2.79e-13 | 1.80e-13 | 128 |
| Page: 1 |
Top |
Cell-cell communication analysis |
| Identification of potential cell-cell interactions between two cell types and their ligand-receptor pairs for different disease states |
| Ligand | Receptor | LRpair | Pathway | Tissue | Disease Stage |
| Page: 1 |
Top |
Single-cell gene regulatory network inference analysis |
| Find out the significant the regulons (TFs) and the target genes of each regulon across cell types for different disease states |
| TF | Cell Type | Tissue | Disease Stage | Target Gene | RSS | Regulon Activity |
| ∗The dot plots of a searched regulon are shown for all cell subpopulations in each disease state of each tissue based on the regulon specific score inferred using pySCENIC and by calculating the average expression. |
| Page: 1 |
Top |
Somatic mutation of malignant transformation related genes |
| Annotation of somatic variants for genes involved in malignant transformation |
| Hugo Symbol | Variant Class | Variant Classification | dbSNP RS | HGVSc | HGVSp | HGVSp Short | SWISSPROT | BIOTYPE | SIFT | PolyPhen | Tumor Sample Barcode | Tissue | Histology | Sex | Age | Stage | Therapy Types | Drugs | Outcome |
| STX10 | SNV | Missense_Mutation | novel | c.301N>A | p.Glu101Lys | p.E101K | O60499 | protein_coding | tolerated(0.24) | benign(0.057) | TCGA-AC-A6IW-01 | Breast | breast invasive carcinoma | Female | >=65 | I/II | Unknown | Unknown | SD |
| STX10 | SNV | Missense_Mutation | c.616N>G | p.Gln206Glu | p.Q206E | O60499 | protein_coding | tolerated(0.65) | benign(0.193) | TCGA-E9-A1RE-01 | Breast | breast invasive carcinoma | Female | >=65 | III/IV | Hormone Therapy | tamoxiphen | SD | |
| STX10 | SNV | Missense_Mutation | novel | c.34N>C | p.Gly12Arg | p.G12R | O60499 | protein_coding | tolerated(0.12) | probably_damaging(1) | TCGA-VS-A953-01 | Cervix | cervical & endocervical cancer | Female | <65 | I/II | Unknown | Unknown | PD |
| STX10 | SNV | Missense_Mutation | c.685N>C | p.Trp229Arg | p.W229R | O60499 | protein_coding | deleterious(0) | probably_damaging(0.997) | TCGA-CK-4951-01 | Colorectum | colon adenocarcinoma | Female | >=65 | I/II | Unknown | Unknown | PD | |
| STX10 | SNV | Missense_Mutation | c.727N>T | p.Leu243Phe | p.L243F | O60499 | protein_coding | deleterious(0.01) | benign(0.062) | TCGA-AP-A051-01 | Endometrium | uterine corpus endometrioid carcinoma | Female | >=65 | I/II | Unknown | Unknown | SD | |
| STX10 | SNV | Missense_Mutation | rs757034889 | c.331G>T | p.Ala111Ser | p.A111S | O60499 | protein_coding | tolerated(0.2) | benign(0.026) | TCGA-AX-A1CE-01 | Endometrium | uterine corpus endometrioid carcinoma | Female | <65 | I/II | Unspecific | Paclitaxel | SD |
| STX10 | SNV | Missense_Mutation | novel | c.641N>T | p.Arg214Met | p.R214M | O60499 | protein_coding | deleterious(0) | possibly_damaging(0.897) | TCGA-B5-A1MX-01 | Endometrium | uterine corpus endometrioid carcinoma | Female | <65 | I/II | Hormone Therapy | megace | SD |
| STX10 | SNV | Missense_Mutation | novel | c.629A>T | p.Asp210Val | p.D210V | O60499 | protein_coding | deleterious(0) | probably_damaging(0.999) | TCGA-B5-A3FC-01 | Endometrium | uterine corpus endometrioid carcinoma | Female | <65 | I/II | Unknown | Unknown | SD |
| STX10 | SNV | Missense_Mutation | rs574785224 | c.697N>A | p.Ala233Thr | p.A233T | O60499 | protein_coding | tolerated(0.18) | benign(0.007) | TCGA-BG-A221-01 | Endometrium | uterine corpus endometrioid carcinoma | Female | >=65 | I/II | Unknown | Unknown | SD |
| STX10 | SNV | Missense_Mutation | novel | c.208A>G | p.Ile70Val | p.I70V | O60499 | protein_coding | deleterious(0.05) | probably_damaging(0.92) | TCGA-DD-AACJ-01 | Liver | liver hepatocellular carcinoma | Male | >=65 | I/II | Unknown | Unknown | PD |
| Page: 1 2 |
Top |
Related drugs of malignant transformation related genes |
| Identification of chemicals and drugs interact with genes involved in malignant transfromation |
| (DGIdb 4.0) |
| Entrez ID | Symbol | Category | Interaction Types | Drug Claim Name | Drug Name | PMIDs |
| Page: 1 |

Copyright 2023-Present -The University of Texas Health Science Center at Houston |