
|
|||||
|
 | |
| |
| |
| |
| |
| |
|
Gene: STT3B |
Gene summary for STT3B |
| Gene information | Species | Human | Gene symbol | STT3B | Gene ID | 201595 |
| Gene name | STT3 oligosaccharyltransferase complex catalytic subunit B | |
| Gene Alias | CDG1X | |
| Cytomap | 3p23 | |
| Gene Type | protein-coding | GO ID | GO:0006464 | UniProtAcc | Q8TCJ2 |
Top |
Malignant transformation analysis |
| Identification of the aberrant gene expression in precancerous and cancerous lesions by comparing the gene expression of stem-like cells in diseased tissues with normal stem cells |
| Entrez ID | Symbol | Replicates | Species | Organ | Tissue | Adj P-value | Log2FC | Malignancy |
| 201595 | STT3B | HTA11_3410_2000001011 | Human | Colorectum | AD | 2.02e-09 | -5.90e-01 | 0.0155 |
| 201595 | STT3B | HTA11_696_2000001011 | Human | Colorectum | AD | 3.42e-13 | -5.05e-01 | -0.1464 |
| 201595 | STT3B | HTA11_866_2000001011 | Human | Colorectum | AD | 3.35e-09 | -4.18e-01 | -0.1001 |
| 201595 | STT3B | HTA11_7696_3000711011 | Human | Colorectum | AD | 1.41e-09 | -3.95e-01 | 0.0674 |
| 201595 | STT3B | A015-C-203 | Human | Colorectum | FAP | 7.71e-24 | -2.15e-01 | -0.1294 |
| 201595 | STT3B | A015-C-204 | Human | Colorectum | FAP | 3.90e-02 | -1.54e-01 | -0.0228 |
| 201595 | STT3B | A002-C-201 | Human | Colorectum | FAP | 4.30e-09 | -2.30e-01 | 0.0324 |
| 201595 | STT3B | A001-C-119 | Human | Colorectum | FAP | 1.73e-02 | -2.98e-01 | -0.1557 |
| 201595 | STT3B | A001-C-108 | Human | Colorectum | FAP | 2.59e-10 | -3.78e-02 | -0.0272 |
| 201595 | STT3B | A002-C-205 | Human | Colorectum | FAP | 1.09e-16 | -2.72e-01 | -0.1236 |
| 201595 | STT3B | A015-C-006 | Human | Colorectum | FAP | 2.93e-11 | -4.05e-01 | -0.0994 |
| 201595 | STT3B | A015-C-106 | Human | Colorectum | FAP | 5.48e-07 | -1.11e-01 | -0.0511 |
| 201595 | STT3B | A002-C-114 | Human | Colorectum | FAP | 1.11e-12 | -4.04e-01 | -0.1561 |
| 201595 | STT3B | A015-C-104 | Human | Colorectum | FAP | 2.75e-26 | -3.44e-01 | -0.1899 |
| 201595 | STT3B | A001-C-014 | Human | Colorectum | FAP | 5.45e-08 | -4.41e-02 | 0.0135 |
| 201595 | STT3B | A002-C-016 | Human | Colorectum | FAP | 8.33e-17 | -1.57e-01 | 0.0521 |
| 201595 | STT3B | A015-C-002 | Human | Colorectum | FAP | 1.82e-07 | -1.90e-01 | -0.0763 |
| 201595 | STT3B | A001-C-203 | Human | Colorectum | FAP | 1.55e-08 | -2.41e-02 | -0.0481 |
| 201595 | STT3B | A002-C-116 | Human | Colorectum | FAP | 4.53e-30 | -3.03e-01 | -0.0452 |
| 201595 | STT3B | A014-C-008 | Human | Colorectum | FAP | 4.25e-09 | -2.99e-01 | -0.191 |
| Page: 1 2 3 4 5 6 7 8 |
| Tissue | Expression Dynamics | Abbreviation |
| Colorectum (GSE201348) |  | FAP: Familial adenomatous polyposis |
| CRC: Colorectal cancer | ||
| Colorectum (HTA11) |  | AD: Adenomas |
| SER: Sessile serrated lesions | ||
| MSI-H: Microsatellite-high colorectal cancer | ||
| MSS: Microsatellite stable colorectal cancer | ||
| Esophagus |  | ESCC: Esophageal squamous cell carcinoma |
| HGIN: High-grade intraepithelial neoplasias | ||
| LGIN: Low-grade intraepithelial neoplasias | ||
| Liver |  | HCC: Hepatocellular carcinoma |
| NAFLD: Non-alcoholic fatty liver disease | ||
| Oral Cavity | 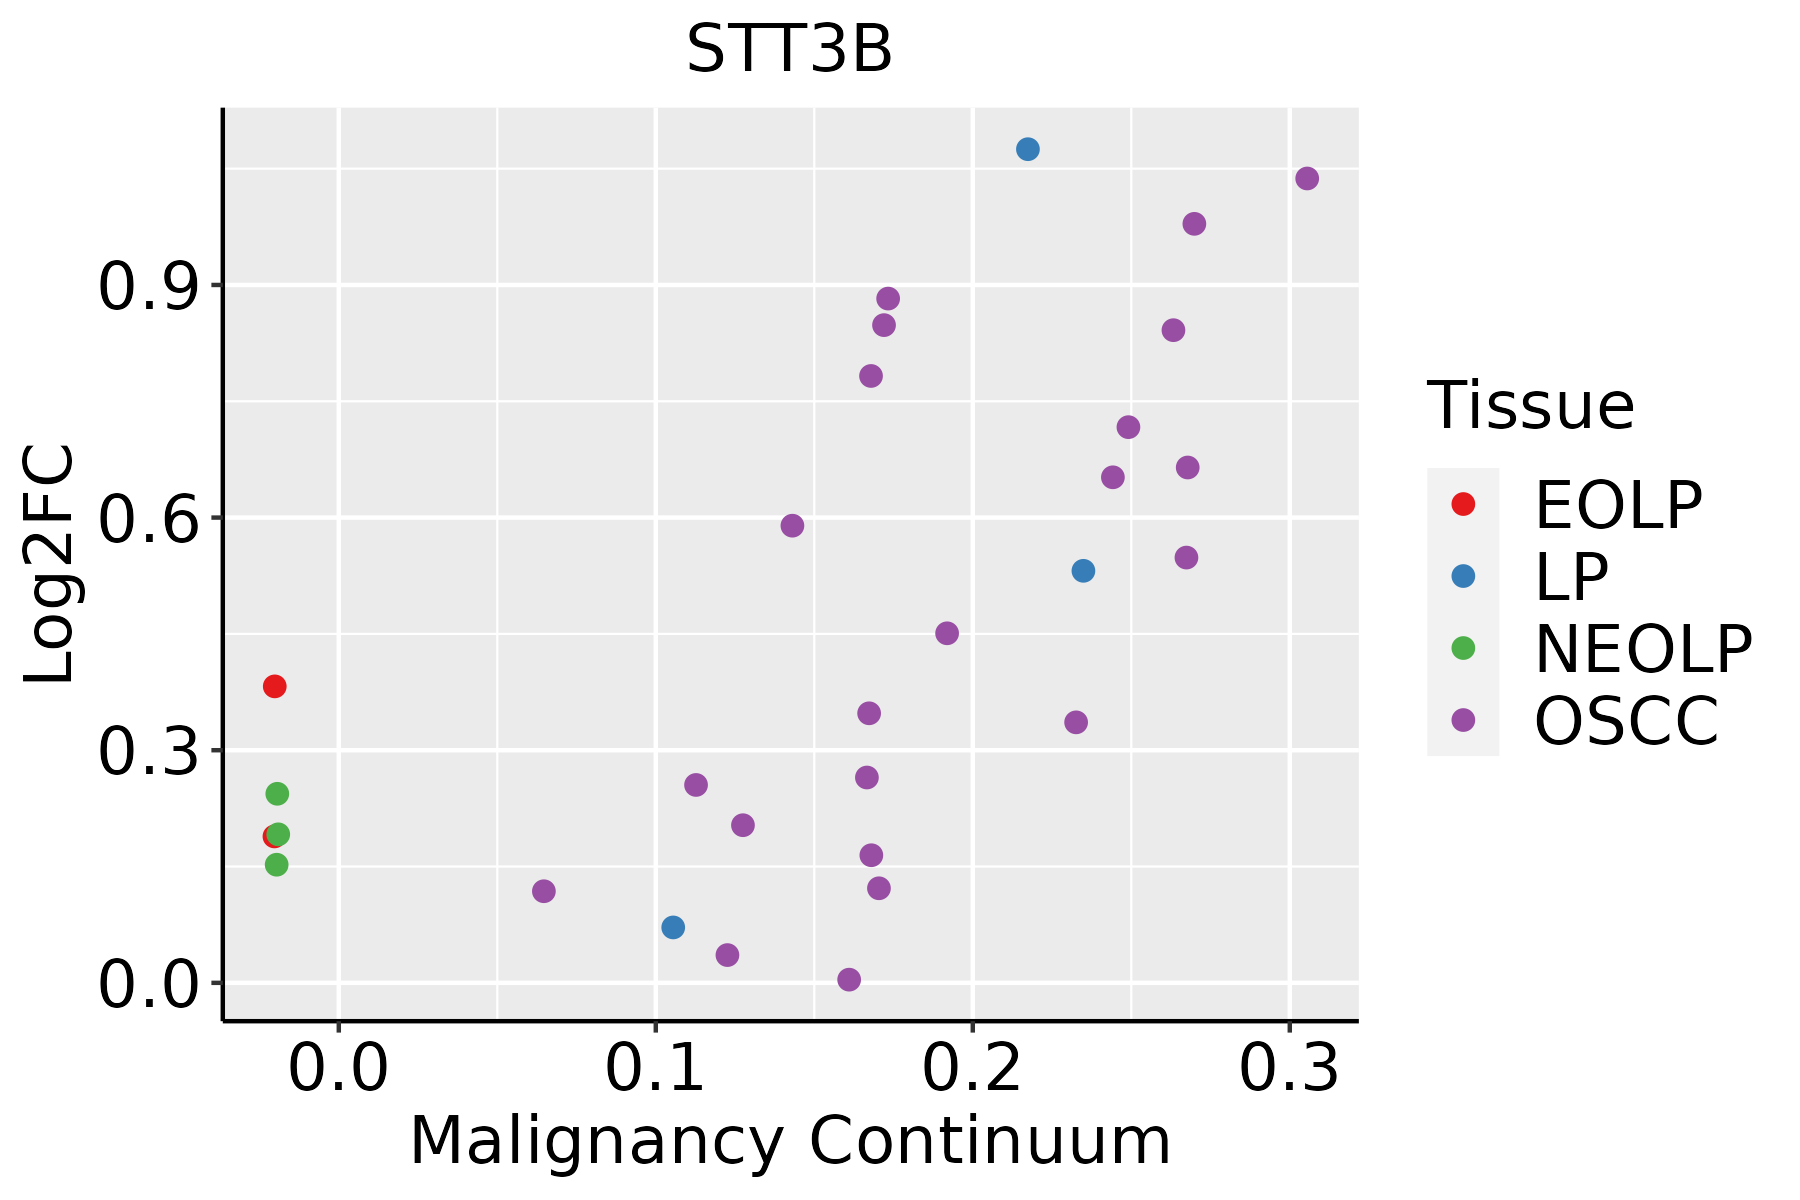 | EOLP: Erosive Oral lichen planus |
| LP: leukoplakia | ||
| NEOLP: Non-erosive oral lichen planus | ||
| OSCC: Oral squamous cell carcinoma | ||
| Prostate | 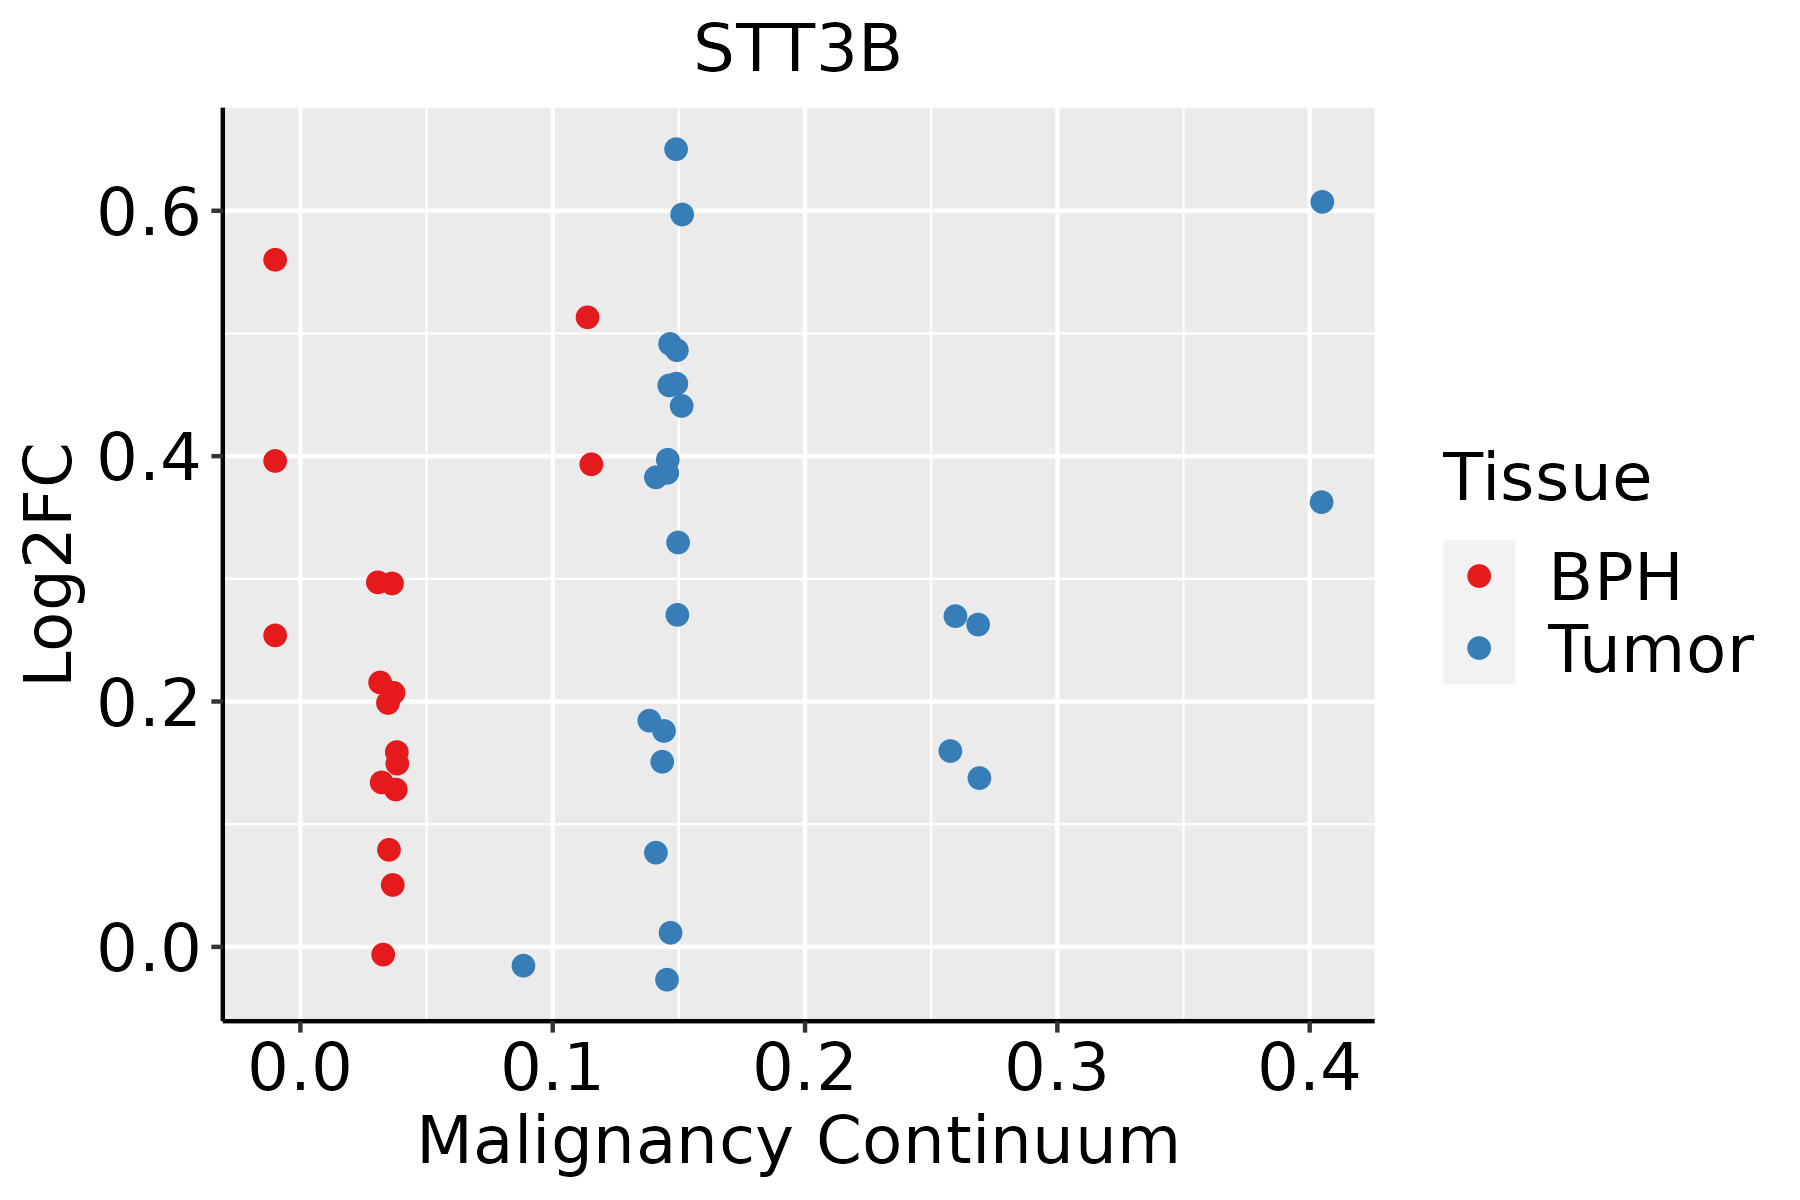 | BPH: Benign Prostatic Hyperplasia |
| Skin | 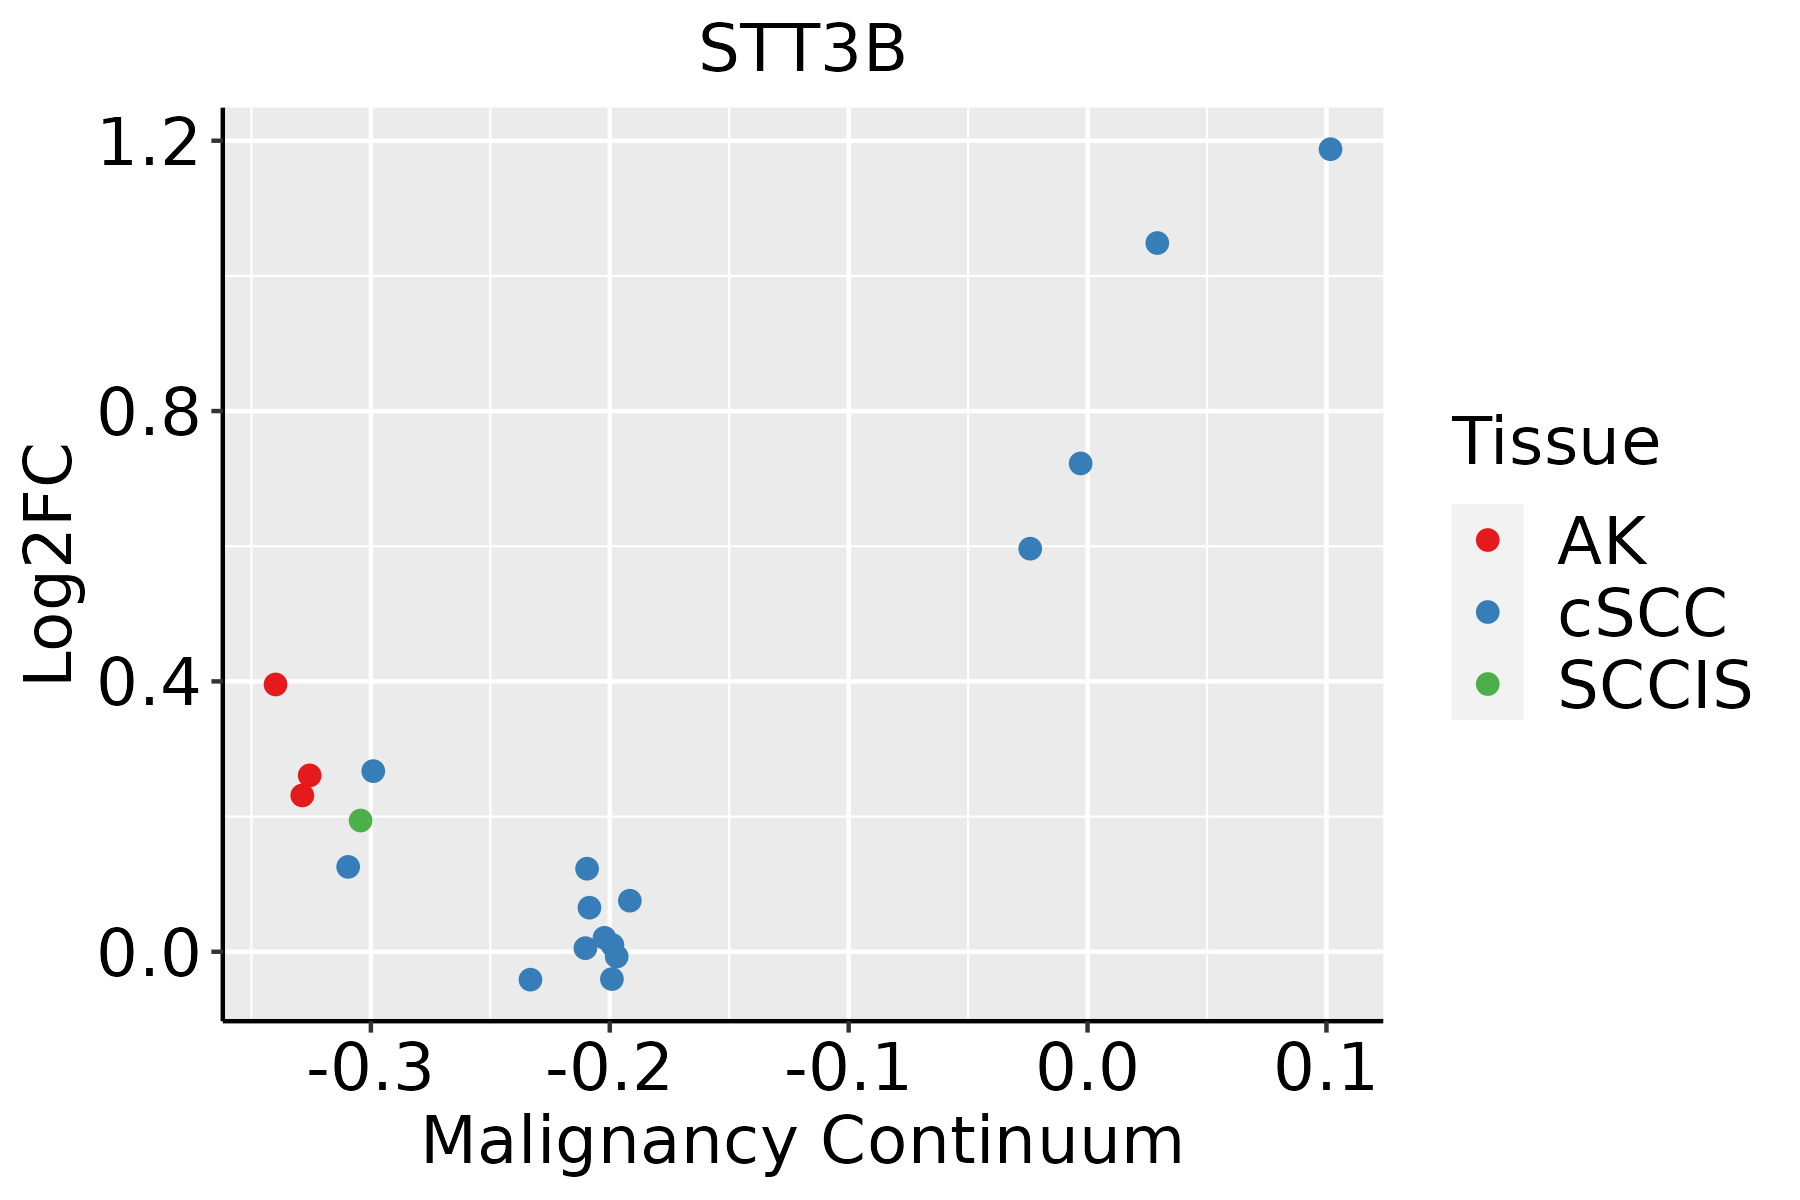 | AK: Actinic keratosis |
| cSCC: Cutaneous squamous cell carcinoma | ||
| SCCIS:squamous cell carcinoma in situ | ||
| Thyroid | 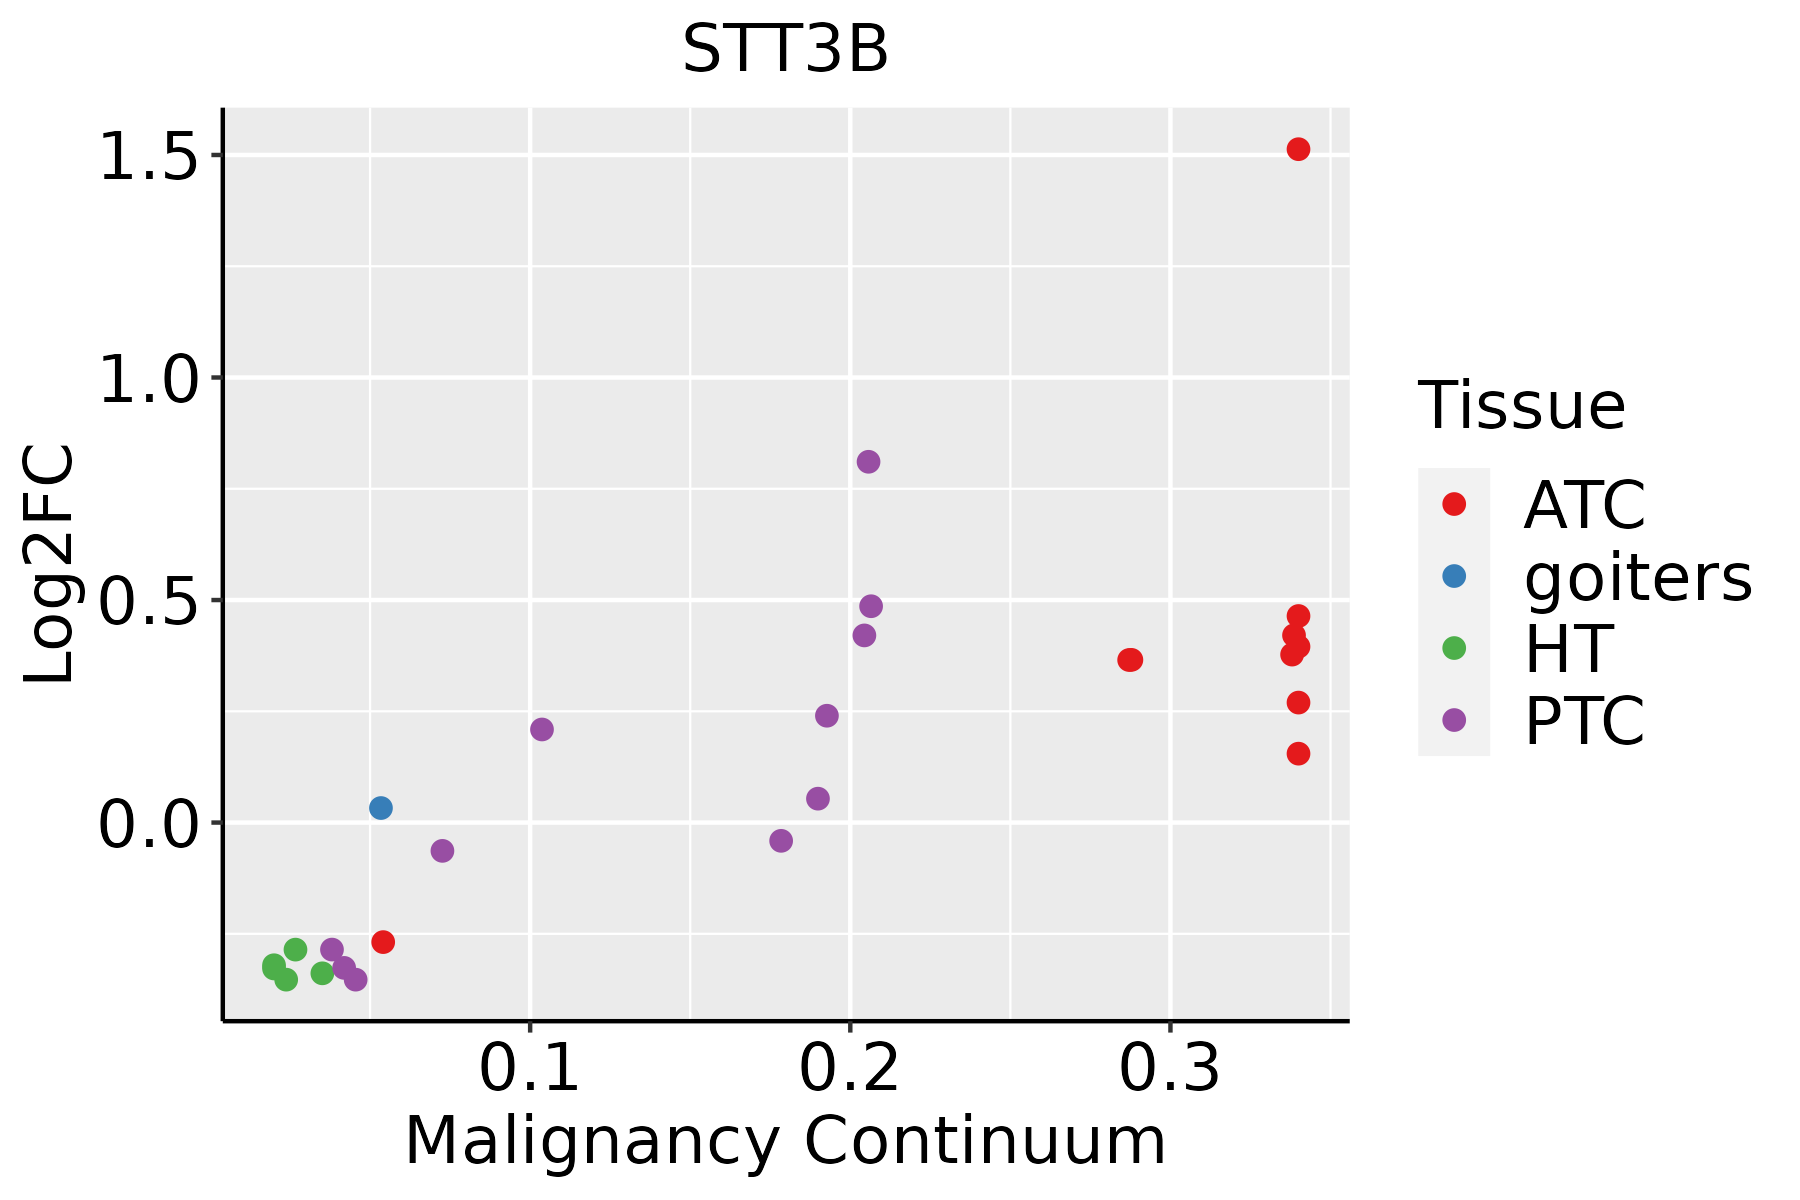 | ATC: Anaplastic thyroid cancer |
| HT: Hashimoto's thyroiditis | ||
| PTC: Papillary thyroid cancer |
| ∗log2FC in expression of this searched gene in stem-like cells from each diseased tissue sample relative to stem-like cells in normal samples in each tissue plotted against the malignancy continuum. Samples are colored based on if they are from different disease stage. |
Top |
Malignant transformation related pathway analysis |
| Find out the enriched GO biological processes and KEGG pathways involved in transition from healthy to precancer to cancer |
| Tissue | Disease Stage | Enriched GO biological Processes |
| Colorectum | AD |  |
| Colorectum | SER |  |
| Colorectum | MSS |  |
| Colorectum | MSI-H |  |
| Colorectum | FAP |  |
| ∗Top 15 enriched GO BP terms are showed in the bar plot of each disease state in each tissue. Each row represents a significant GO biological process which is colored according to the -log10(p.adjust). |
| Page: 1 2 3 4 5 6 7 8 9 |
| GO ID | Tissue | Disease Stage | Description | Gene Ratio | Bg Ratio | pvalue | p.adjust | Count |
| GO:0010498 | Colorectum | AD | proteasomal protein catabolic process | 174/3918 | 490/18723 | 3.18e-14 | 7.66e-12 | 174 |
| GO:0043161 | Colorectum | AD | proteasome-mediated ubiquitin-dependent protein catabolic process | 141/3918 | 412/18723 | 1.77e-10 | 1.68e-08 | 141 |
| GO:0034976 | Colorectum | AD | response to endoplasmic reticulum stress | 90/3918 | 256/18723 | 8.48e-08 | 4.28e-06 | 90 |
| GO:0018279 | Colorectum | AD | protein N-linked glycosylation via asparagine | 15/3918 | 23/18723 | 5.47e-06 | 1.40e-04 | 15 |
| GO:0018196 | Colorectum | AD | peptidyl-asparagine modification | 15/3918 | 24/18723 | 1.18e-05 | 2.62e-04 | 15 |
| GO:0035966 | Colorectum | AD | response to topologically incorrect protein | 54/3918 | 159/18723 | 8.85e-05 | 1.36e-03 | 54 |
| GO:0006986 | Colorectum | AD | response to unfolded protein | 45/3918 | 137/18723 | 7.43e-04 | 7.48e-03 | 45 |
| GO:0006487 | Colorectum | AD | protein N-linked glycosylation | 25/3918 | 65/18723 | 9.12e-04 | 8.71e-03 | 25 |
| GO:0006486 | Colorectum | AD | protein glycosylation | 64/3918 | 226/18723 | 4.86e-03 | 3.27e-02 | 64 |
| GO:0043413 | Colorectum | AD | macromolecule glycosylation | 64/3918 | 226/18723 | 4.86e-03 | 3.27e-02 | 64 |
| GO:0036503 | Colorectum | AD | ERAD pathway | 34/3918 | 107/18723 | 5.57e-03 | 3.63e-02 | 34 |
| GO:0070085 | Colorectum | AD | glycosylation | 67/3918 | 240/18723 | 5.78e-03 | 3.67e-02 | 67 |
| GO:00431614 | Colorectum | FAP | proteasome-mediated ubiquitin-dependent protein catabolic process | 98/2622 | 412/18723 | 5.41e-08 | 4.20e-06 | 98 |
| GO:00104984 | Colorectum | FAP | proteasomal protein catabolic process | 110/2622 | 490/18723 | 2.12e-07 | 1.26e-05 | 110 |
| GO:00349764 | Colorectum | FAP | response to endoplasmic reticulum stress | 61/2622 | 256/18723 | 1.58e-05 | 4.10e-04 | 61 |
| GO:00182794 | Colorectum | FAP | protein N-linked glycosylation via asparagine | 10/2622 | 23/18723 | 5.68e-04 | 6.33e-03 | 10 |
| GO:00181964 | Colorectum | FAP | peptidyl-asparagine modification | 10/2622 | 24/18723 | 8.53e-04 | 8.79e-03 | 10 |
| GO:00064861 | Colorectum | FAP | protein glycosylation | 48/2622 | 226/18723 | 1.85e-03 | 1.57e-02 | 48 |
| GO:00434131 | Colorectum | FAP | macromolecule glycosylation | 48/2622 | 226/18723 | 1.85e-03 | 1.57e-02 | 48 |
| GO:00700851 | Colorectum | FAP | glycosylation | 50/2622 | 240/18723 | 2.30e-03 | 1.85e-02 | 50 |
| Page: 1 2 3 4 5 6 7 8 9 |
| Pathway ID | Tissue | Disease Stage | Description | Gene Ratio | Bg Ratio | pvalue | p.adjust | qvalue | Count |
| hsa04141 | Colorectum | AD | Protein processing in endoplasmic reticulum | 80/2092 | 174/8465 | 5.96e-10 | 1.25e-08 | 7.96e-09 | 80 |
| hsa00510 | Colorectum | AD | N-Glycan biosynthesis | 21/2092 | 53/8465 | 1.15e-02 | 4.24e-02 | 2.71e-02 | 21 |
| hsa041411 | Colorectum | AD | Protein processing in endoplasmic reticulum | 80/2092 | 174/8465 | 5.96e-10 | 1.25e-08 | 7.96e-09 | 80 |
| hsa005101 | Colorectum | AD | N-Glycan biosynthesis | 21/2092 | 53/8465 | 1.15e-02 | 4.24e-02 | 2.71e-02 | 21 |
| hsa041418 | Colorectum | FAP | Protein processing in endoplasmic reticulum | 50/1404 | 174/8465 | 3.64e-05 | 3.68e-04 | 2.24e-04 | 50 |
| hsa041419 | Colorectum | FAP | Protein processing in endoplasmic reticulum | 50/1404 | 174/8465 | 3.64e-05 | 3.68e-04 | 2.24e-04 | 50 |
| hsa04141211 | Esophagus | ESCC | Protein processing in endoplasmic reticulum | 147/4205 | 174/8465 | 3.29e-22 | 1.10e-19 | 5.64e-20 | 147 |
| hsa0051023 | Esophagus | ESCC | N-Glycan biosynthesis | 39/4205 | 53/8465 | 3.26e-04 | 1.15e-03 | 5.89e-04 | 39 |
| hsa005136 | Esophagus | ESCC | Various types of N-glycan biosynthesis | 31/4205 | 42/8465 | 1.23e-03 | 3.78e-03 | 1.93e-03 | 31 |
| hsa04141310 | Esophagus | ESCC | Protein processing in endoplasmic reticulum | 147/4205 | 174/8465 | 3.29e-22 | 1.10e-19 | 5.64e-20 | 147 |
| hsa0051033 | Esophagus | ESCC | N-Glycan biosynthesis | 39/4205 | 53/8465 | 3.26e-04 | 1.15e-03 | 5.89e-04 | 39 |
| hsa0051313 | Esophagus | ESCC | Various types of N-glycan biosynthesis | 31/4205 | 42/8465 | 1.23e-03 | 3.78e-03 | 1.93e-03 | 31 |
| hsa0414114 | Liver | Cirrhotic | Protein processing in endoplasmic reticulum | 114/2530 | 174/8465 | 1.16e-22 | 9.67e-21 | 5.96e-21 | 114 |
| hsa005104 | Liver | Cirrhotic | N-Glycan biosynthesis | 32/2530 | 53/8465 | 3.82e-06 | 4.10e-05 | 2.53e-05 | 32 |
| hsa005134 | Liver | Cirrhotic | Various types of N-glycan biosynthesis | 26/2530 | 42/8465 | 1.65e-05 | 1.41e-04 | 8.69e-05 | 26 |
| hsa0414115 | Liver | Cirrhotic | Protein processing in endoplasmic reticulum | 114/2530 | 174/8465 | 1.16e-22 | 9.67e-21 | 5.96e-21 | 114 |
| hsa0051011 | Liver | Cirrhotic | N-Glycan biosynthesis | 32/2530 | 53/8465 | 3.82e-06 | 4.10e-05 | 2.53e-05 | 32 |
| hsa0051311 | Liver | Cirrhotic | Various types of N-glycan biosynthesis | 26/2530 | 42/8465 | 1.65e-05 | 1.41e-04 | 8.69e-05 | 26 |
| hsa0414122 | Liver | HCC | Protein processing in endoplasmic reticulum | 146/4020 | 174/8465 | 7.34e-24 | 2.46e-21 | 1.37e-21 | 146 |
| hsa0051021 | Liver | HCC | N-Glycan biosynthesis | 40/4020 | 53/8465 | 2.95e-05 | 1.87e-04 | 1.04e-04 | 40 |
| Page: 1 2 3 |
Top |
Cell-cell communication analysis |
| Identification of potential cell-cell interactions between two cell types and their ligand-receptor pairs for different disease states |
| Ligand | Receptor | LRpair | Pathway | Tissue | Disease Stage |
| Page: 1 |
Top |
Single-cell gene regulatory network inference analysis |
| Find out the significant the regulons (TFs) and the target genes of each regulon across cell types for different disease states |
| TF | Cell Type | Tissue | Disease Stage | Target Gene | RSS | Regulon Activity |
| ∗The dot plots of a searched regulon are shown for all cell subpopulations in each disease state of each tissue based on the regulon specific score inferred using pySCENIC and by calculating the average expression. |
| Page: 1 |
Top |
Somatic mutation of malignant transformation related genes |
| Annotation of somatic variants for genes involved in malignant transformation |
| Hugo Symbol | Variant Class | Variant Classification | dbSNP RS | HGVSc | HGVSp | HGVSp Short | SWISSPROT | BIOTYPE | SIFT | PolyPhen | Tumor Sample Barcode | Tissue | Histology | Sex | Age | Stage | Therapy Types | Drugs | Outcome |
| STT3B | SNV | Missense_Mutation | novel | c.2123G>A | p.Gly708Glu | p.G708E | Q8TCJ2 | protein_coding | deleterious(0) | probably_damaging(0.909) | TCGA-5L-AAT1-01 | Breast | breast invasive carcinoma | Female | <65 | III/IV | Hormone Therapy | letrozol | SD |
| STT3B | SNV | Missense_Mutation | novel | c.1022G>A | p.Arg341Lys | p.R341K | Q8TCJ2 | protein_coding | tolerated(0.53) | benign(0.003) | TCGA-A2-A0CR-01 | Breast | breast invasive carcinoma | Female | <65 | I/II | Chemotherapy | adriamycin | CR |
| STT3B | SNV | Missense_Mutation | c.1549G>A | p.Val517Met | p.V517M | Q8TCJ2 | protein_coding | tolerated(0.1) | benign(0.07) | TCGA-D8-A1JL-01 | Breast | breast invasive carcinoma | Female | >=65 | I/II | Unknown | Unknown | SD | |
| STT3B | SNV | Missense_Mutation | c.1249G>A | p.Asp417Asn | p.D417N | Q8TCJ2 | protein_coding | deleterious(0) | probably_damaging(1) | TCGA-EW-A1J5-01 | Breast | breast invasive carcinoma | Female | <65 | I/II | Chemotherapy | adriamycin | SD | |
| STT3B | insertion | In_Frame_Ins | novel | c.2032_2033insATT | p.Met678delinsAsnLeu | p.M678delinsNL | Q8TCJ2 | protein_coding | TCGA-A7-A26I-01 | Breast | breast invasive carcinoma | Female | >=65 | I/II | Chemotherapy | cytoxan | SD | ||
| STT3B | SNV | Missense_Mutation | c.2224C>T | p.Arg742Cys | p.R742C | Q8TCJ2 | protein_coding | deleterious(0) | probably_damaging(1) | TCGA-VS-A9V3-01 | Cervix | cervical & endocervical cancer | Female | <65 | I/II | Chemotherapy | cisplatin | PD | |
| STT3B | SNV | Missense_Mutation | c.1747G>T | p.Asp583Tyr | p.D583Y | Q8TCJ2 | protein_coding | deleterious(0) | probably_damaging(1) | TCGA-AA-A010-01 | Colorectum | colon adenocarcinoma | Female | <65 | I/II | Chemotherapy | folinic | CR | |
| STT3B | SNV | Missense_Mutation | c.986N>T | p.Ala329Val | p.A329V | Q8TCJ2 | protein_coding | tolerated(0.34) | benign(0.015) | TCGA-AY-6197-01 | Colorectum | colon adenocarcinoma | Male | <65 | I/II | Unknown | Unknown | SD | |
| STT3B | SNV | Missense_Mutation | novel | c.2139N>T | p.Leu713Phe | p.L713F | Q8TCJ2 | protein_coding | tolerated(0.27) | benign(0.2) | TCGA-CA-6717-01 | Colorectum | colon adenocarcinoma | Male | <65 | I/II | Chemotherapy | oxaliplatin | CR |
| STT3B | SNV | Missense_Mutation | c.1026N>G | p.Asp342Glu | p.D342E | Q8TCJ2 | protein_coding | tolerated(0.15) | benign(0.006) | TCGA-CM-5861-01 | Colorectum | colon adenocarcinoma | Female | <65 | I/II | Unknown | Unknown | PD |
| Page: 1 2 3 4 5 6 |
Top |
Related drugs of malignant transformation related genes |
| Identification of chemicals and drugs interact with genes involved in malignant transfromation |
| (DGIdb 4.0) |
| Entrez ID | Symbol | Category | Interaction Types | Drug Claim Name | Drug Name | PMIDs |
| Page: 1 |

Copyright 2023-Present -The University of Texas Health Science Center at Houston |