
|
|||||
|
 | |
| |
| |
| |
| |
| |
|
Gene: STRN4 |
Gene summary for STRN4 |
| Gene information | Species | Human | Gene symbol | STRN4 | Gene ID | 29888 |
| Gene name | striatin 4 | |
| Gene Alias | PPP2R6C | |
| Cytomap | 19q13.32 | |
| Gene Type | protein-coding | GO ID | GO:0008150 | UniProtAcc | Q59GV6 |
Top |
Malignant transformation analysis |
| Identification of the aberrant gene expression in precancerous and cancerous lesions by comparing the gene expression of stem-like cells in diseased tissues with normal stem cells |
| Entrez ID | Symbol | Replicates | Species | Organ | Tissue | Adj P-value | Log2FC | Malignancy |
| 29888 | STRN4 | HTA11_3410_2000001011 | Human | Colorectum | AD | 9.82e-03 | 1.45e-01 | 0.0155 |
| 29888 | STRN4 | HTA11_2487_2000001011 | Human | Colorectum | SER | 1.63e-03 | 3.36e-01 | -0.1808 |
| 29888 | STRN4 | HTA11_411_2000001011 | Human | Colorectum | SER | 2.27e-04 | 6.22e-01 | -0.2602 |
| 29888 | STRN4 | HTA11_3361_2000001011 | Human | Colorectum | AD | 1.02e-02 | 2.53e-01 | -0.1207 |
| 29888 | STRN4 | HTA11_696_2000001011 | Human | Colorectum | AD | 3.07e-03 | 1.69e-01 | -0.1464 |
| 29888 | STRN4 | HTA11_1391_2000001011 | Human | Colorectum | AD | 8.67e-03 | 2.41e-01 | -0.059 |
| 29888 | STRN4 | HTA11_866_3004761011 | Human | Colorectum | AD | 4.32e-05 | 1.48e-01 | 0.096 |
| 29888 | STRN4 | HTA11_7696_3000711011 | Human | Colorectum | AD | 1.97e-19 | 4.47e-01 | 0.0674 |
| 29888 | STRN4 | HTA11_99999971662_82457 | Human | Colorectum | MSS | 2.74e-05 | 2.51e-01 | 0.3859 |
| 29888 | STRN4 | HTA11_99999974143_84620 | Human | Colorectum | MSS | 4.99e-04 | 1.28e-01 | 0.3005 |
| 29888 | STRN4 | LZE7T | Human | Esophagus | ESCC | 4.02e-09 | 2.56e-01 | 0.0667 |
| 29888 | STRN4 | LZE24T | Human | Esophagus | ESCC | 2.70e-05 | 1.64e-01 | 0.0596 |
| 29888 | STRN4 | LZE6T | Human | Esophagus | ESCC | 1.19e-03 | 1.89e-01 | 0.0845 |
| 29888 | STRN4 | P1T-E | Human | Esophagus | ESCC | 6.12e-07 | 3.03e-01 | 0.0875 |
| 29888 | STRN4 | P2T-E | Human | Esophagus | ESCC | 1.24e-08 | 1.03e-01 | 0.1177 |
| 29888 | STRN4 | P4T-E | Human | Esophagus | ESCC | 4.56e-13 | 2.05e-01 | 0.1323 |
| 29888 | STRN4 | P5T-E | Human | Esophagus | ESCC | 8.94e-14 | 1.26e-01 | 0.1327 |
| 29888 | STRN4 | P8T-E | Human | Esophagus | ESCC | 1.41e-36 | 5.46e-01 | 0.0889 |
| 29888 | STRN4 | P9T-E | Human | Esophagus | ESCC | 1.18e-08 | 1.01e-01 | 0.1131 |
| 29888 | STRN4 | P10T-E | Human | Esophagus | ESCC | 4.19e-25 | 4.07e-01 | 0.116 |
| Page: 1 2 3 4 5 6 |
| Tissue | Expression Dynamics | Abbreviation |
| Colorectum (GSE201348) |  | FAP: Familial adenomatous polyposis |
| CRC: Colorectal cancer | ||
| Colorectum (HTA11) |  | AD: Adenomas |
| SER: Sessile serrated lesions | ||
| MSI-H: Microsatellite-high colorectal cancer | ||
| MSS: Microsatellite stable colorectal cancer | ||
| Esophagus | 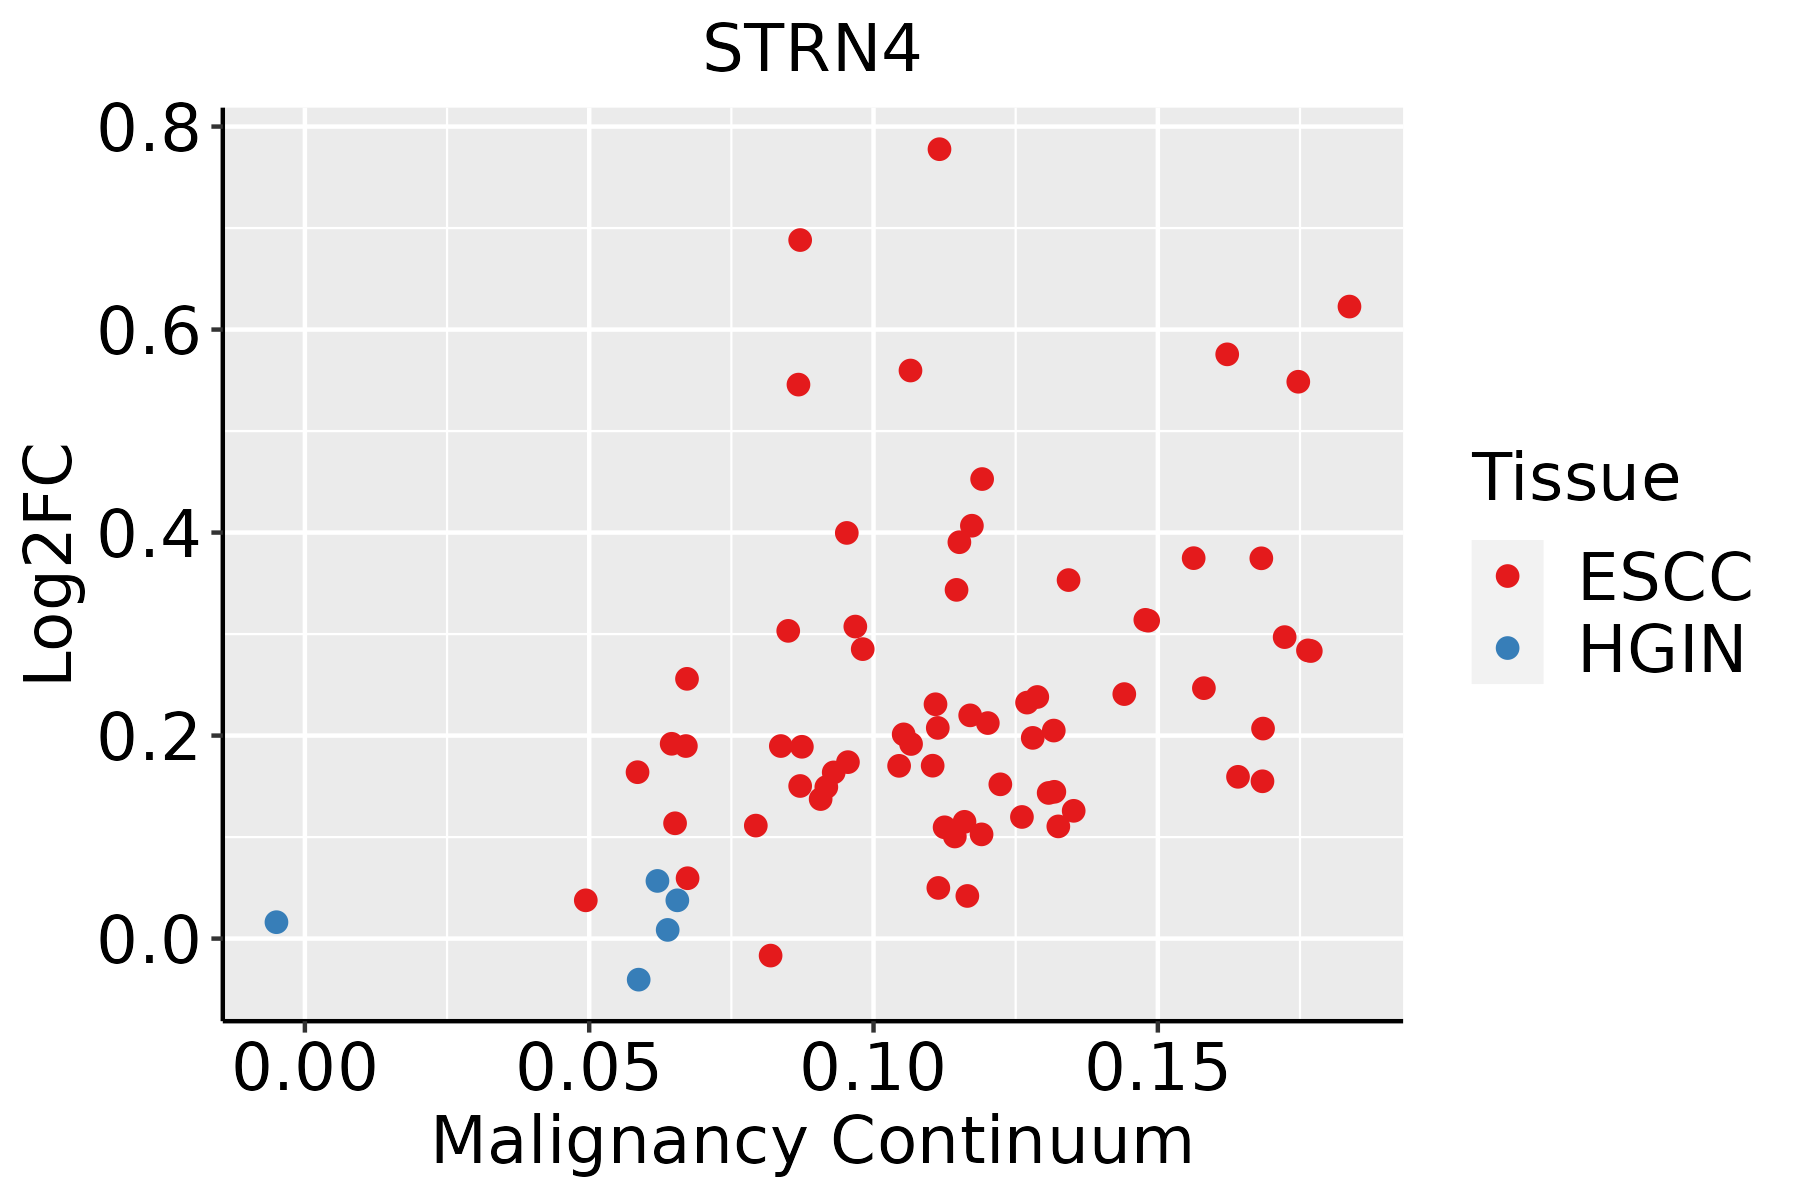 | ESCC: Esophageal squamous cell carcinoma |
| HGIN: High-grade intraepithelial neoplasias | ||
| LGIN: Low-grade intraepithelial neoplasias | ||
| Liver | 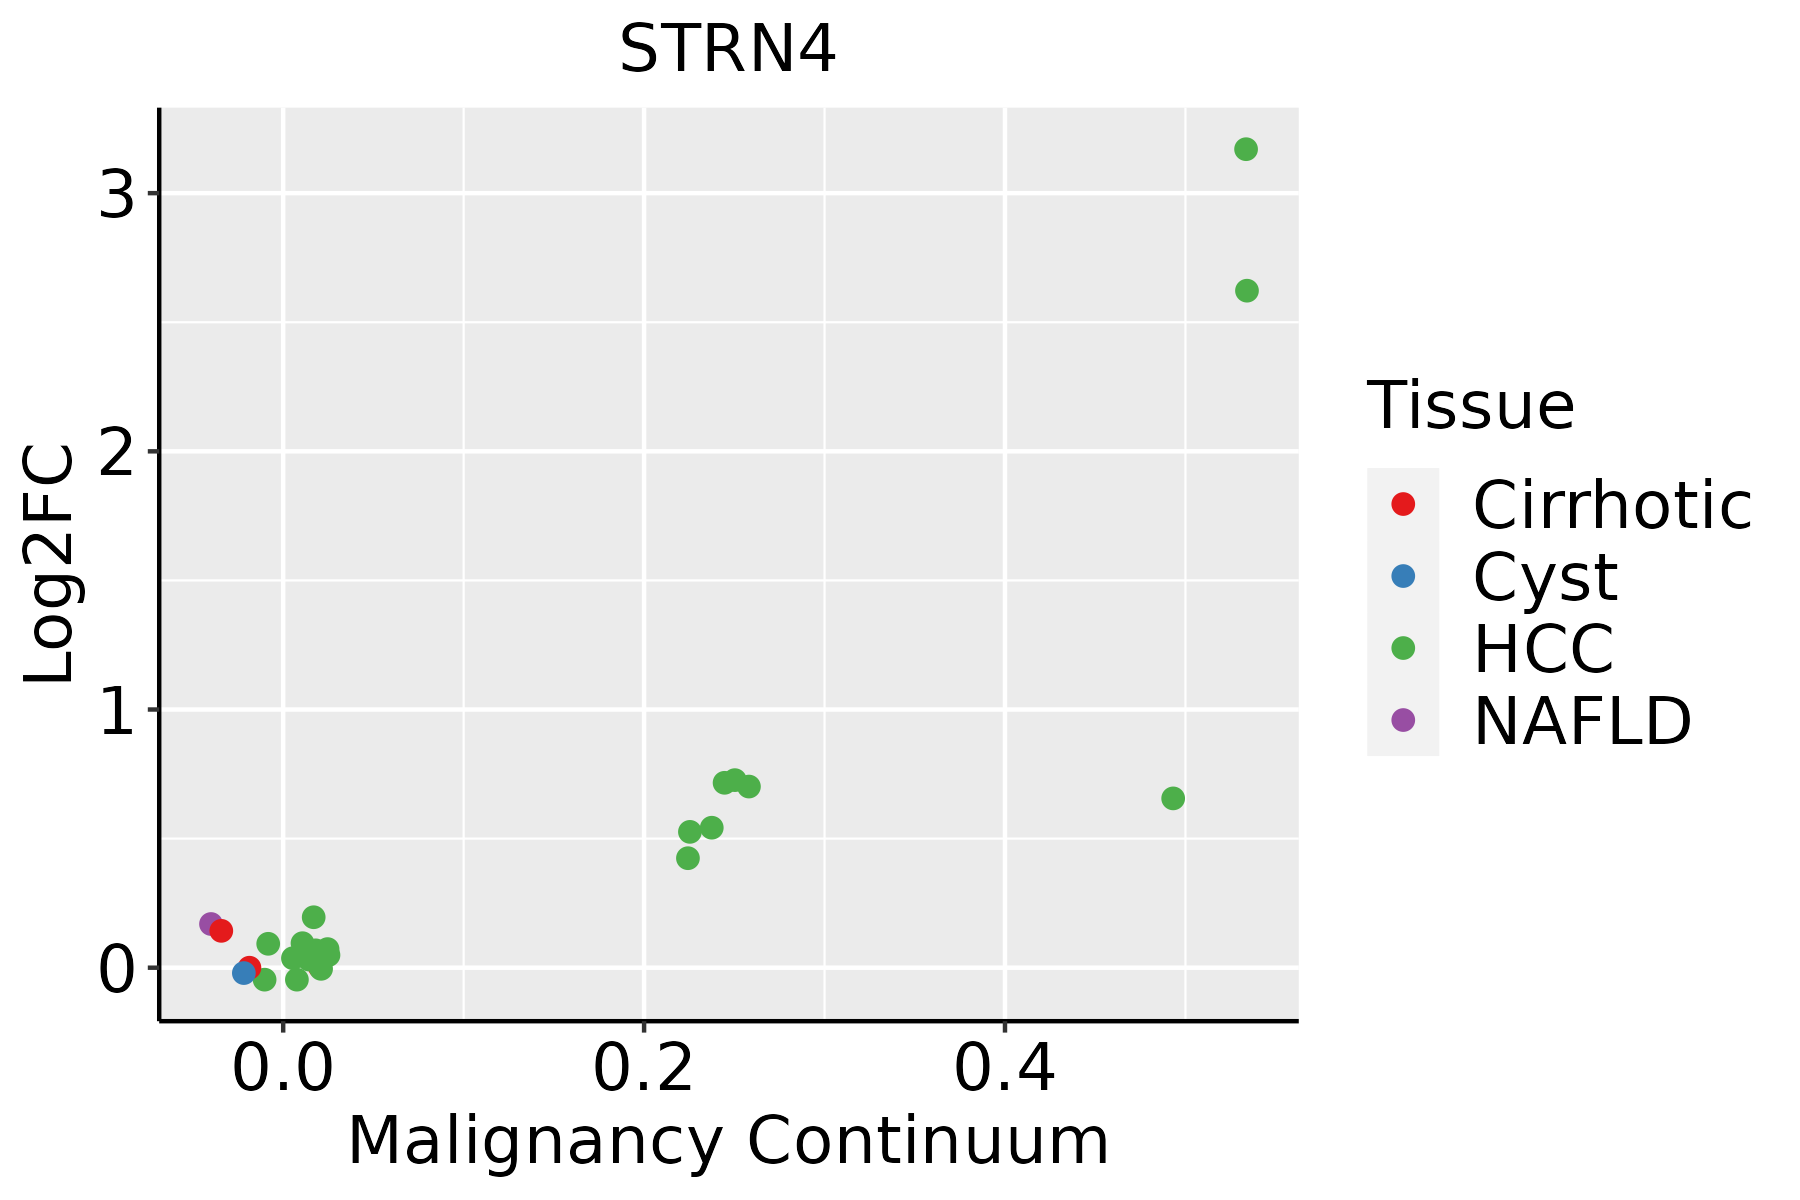 | HCC: Hepatocellular carcinoma |
| NAFLD: Non-alcoholic fatty liver disease | ||
| Oral Cavity | 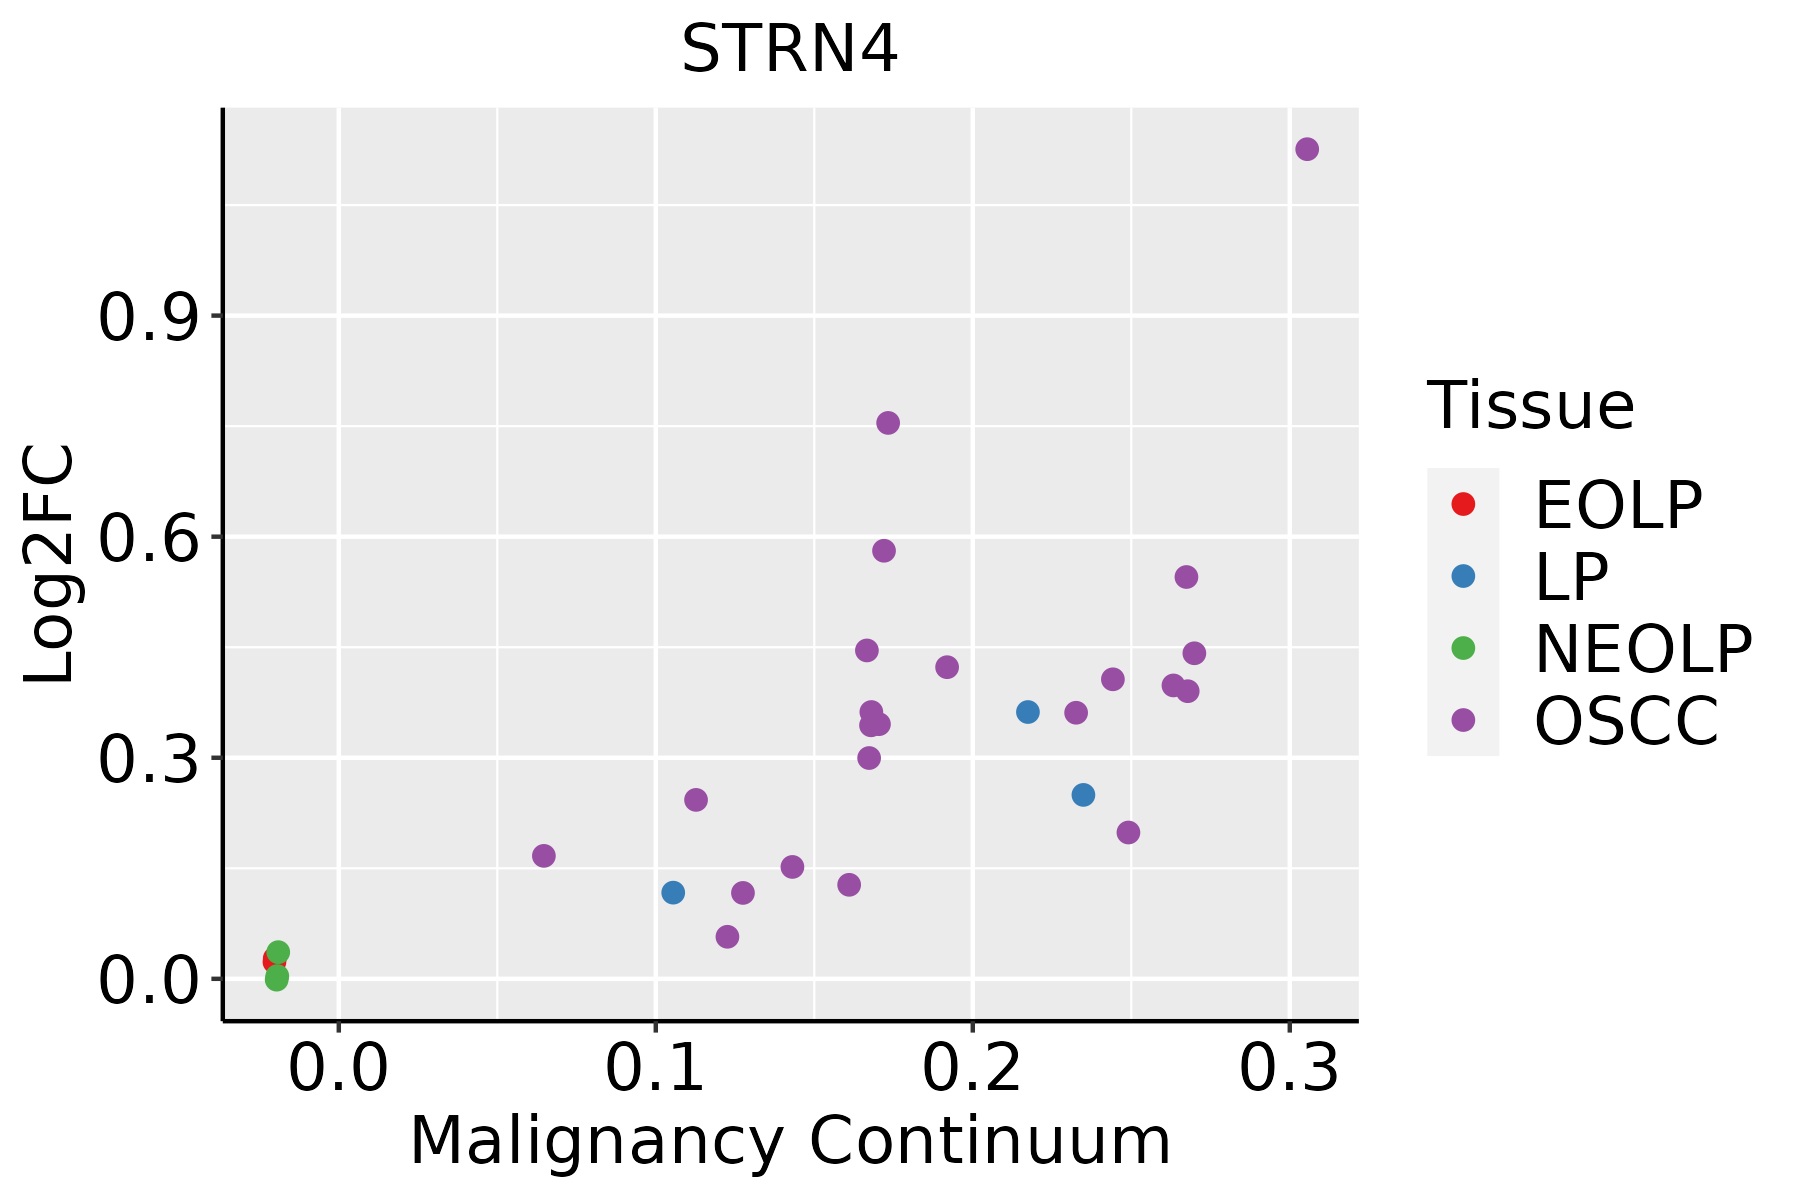 | EOLP: Erosive Oral lichen planus |
| LP: leukoplakia | ||
| NEOLP: Non-erosive oral lichen planus | ||
| OSCC: Oral squamous cell carcinoma | ||
| Thyroid | 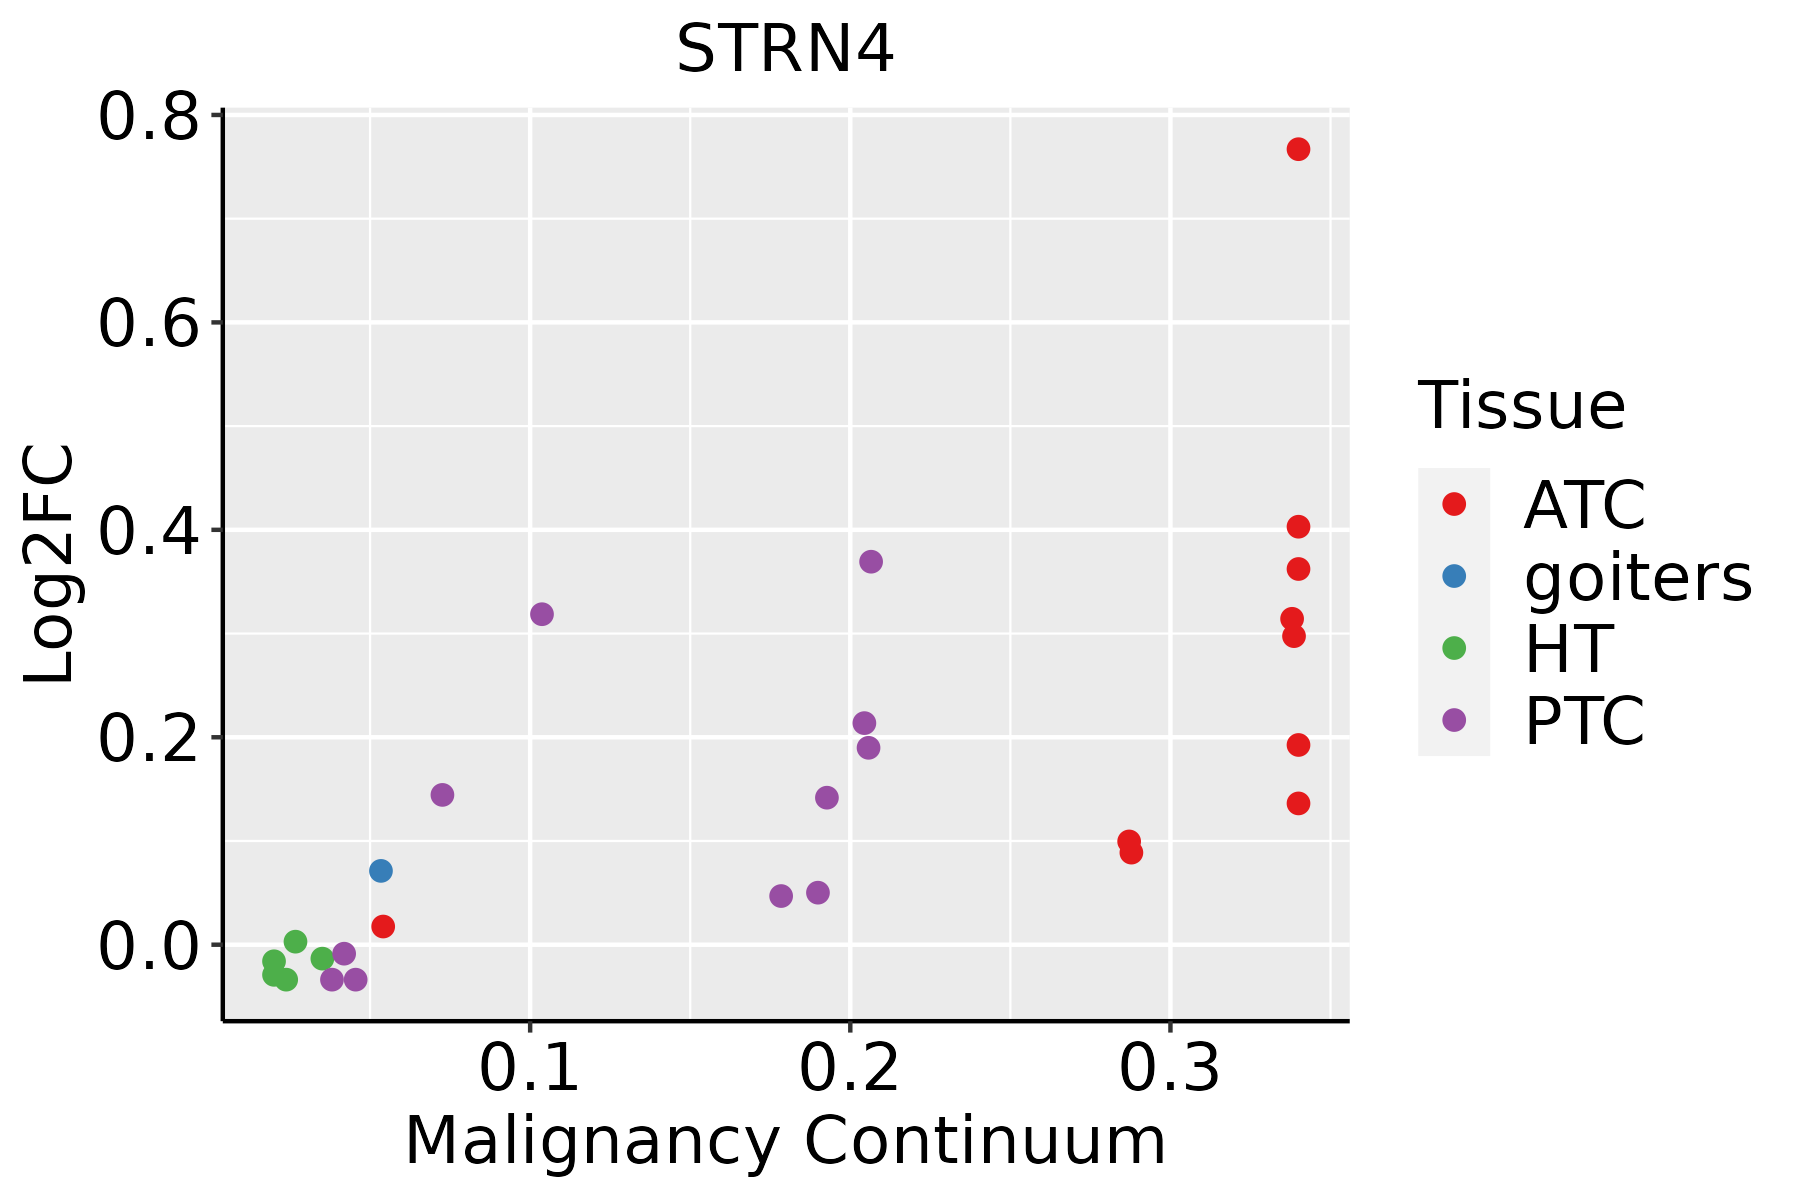 | ATC: Anaplastic thyroid cancer |
| HT: Hashimoto's thyroiditis | ||
| PTC: Papillary thyroid cancer |
| ∗log2FC in expression of this searched gene in stem-like cells from each diseased tissue sample relative to stem-like cells in normal samples in each tissue plotted against the malignancy continuum. Samples are colored based on if they are from different disease stage. |
Top |
Malignant transformation related pathway analysis |
| Find out the enriched GO biological processes and KEGG pathways involved in transition from healthy to precancer to cancer |
| Tissue | Disease Stage | Enriched GO biological Processes |
| Colorectum | AD |  |
| Colorectum | SER |  |
| Colorectum | MSS |  |
| Colorectum | MSI-H |  |
| Colorectum | FAP |  |
| ∗Top 15 enriched GO BP terms are showed in the bar plot of each disease state in each tissue. Each row represents a significant GO biological process which is colored according to the -log10(p.adjust). |
| Page: 1 2 3 4 5 6 7 8 9 |
| GO ID | Tissue | Disease Stage | Description | Gene Ratio | Bg Ratio | pvalue | p.adjust | Count |
| Page: 1 |
| Pathway ID | Tissue | Disease Stage | Description | Gene Ratio | Bg Ratio | pvalue | p.adjust | qvalue | Count |
| Page: 1 |
Top |
Cell-cell communication analysis |
| Identification of potential cell-cell interactions between two cell types and their ligand-receptor pairs for different disease states |
| Ligand | Receptor | LRpair | Pathway | Tissue | Disease Stage |
| Page: 1 |
Top |
Single-cell gene regulatory network inference analysis |
| Find out the significant the regulons (TFs) and the target genes of each regulon across cell types for different disease states |
| TF | Cell Type | Tissue | Disease Stage | Target Gene | RSS | Regulon Activity |
| ∗The dot plots of a searched regulon are shown for all cell subpopulations in each disease state of each tissue based on the regulon specific score inferred using pySCENIC and by calculating the average expression. |
| Page: 1 |
Top |
Somatic mutation of malignant transformation related genes |
| Annotation of somatic variants for genes involved in malignant transformation |
| Hugo Symbol | Variant Class | Variant Classification | dbSNP RS | HGVSc | HGVSp | HGVSp Short | SWISSPROT | BIOTYPE | SIFT | PolyPhen | Tumor Sample Barcode | Tissue | Histology | Sex | Age | Stage | Therapy Types | Drugs | Outcome |
| STRN4 | SNV | Missense_Mutation | novel | c.2263C>A | p.Leu755Met | p.L755M | Q9NRL3 | protein_coding | deleterious(0) | probably_damaging(1) | TCGA-AO-A128-01 | Breast | breast invasive carcinoma | Female | <65 | I/II | Chemotherapy | doxorubicin | SD |
| STRN4 | SNV | Missense_Mutation | rs769814736 | c.644C>T | p.Pro215Leu | p.P215L | Q9NRL3 | protein_coding | tolerated(0.08) | benign(0.138) | TCGA-AO-A128-01 | Breast | breast invasive carcinoma | Female | <65 | I/II | Chemotherapy | doxorubicin | SD |
| STRN4 | SNV | Missense_Mutation | rs779485652 | c.946N>G | p.Ile316Val | p.I316V | Q9NRL3 | protein_coding | tolerated(0.05) | benign(0.138) | TCGA-E9-A3X8-01 | Breast | breast invasive carcinoma | Female | <65 | I/II | Chemotherapy | cyclophosphane | CR |
| STRN4 | deletion | Frame_Shift_Del | novel | c.847delN | p.Asp283ThrfsTer10 | p.D283Tfs*10 | Q9NRL3 | protein_coding | TCGA-D8-A27V-01 | Breast | breast invasive carcinoma | Female | <65 | I/II | Hormone Therapy | tamoxiphen | SD | ||
| STRN4 | SNV | Missense_Mutation | novel | c.1483C>T | p.Arg495Trp | p.R495W | Q9NRL3 | protein_coding | deleterious(0) | probably_damaging(1) | TCGA-EA-A410-01 | Cervix | cervical & endocervical cancer | Female | <65 | I/II | Unknown | Unknown | SD |
| STRN4 | SNV | Missense_Mutation | c.2042N>G | p.Ser681Cys | p.S681C | Q9NRL3 | protein_coding | deleterious(0) | probably_damaging(0.993) | TCGA-EK-A2RJ-01 | Cervix | cervical & endocervical cancer | Female | <65 | I/II | Unknown | Unknown | SD | |
| STRN4 | SNV | Missense_Mutation | novel | c.354N>G | p.Ile118Met | p.I118M | Q9NRL3 | protein_coding | deleterious(0) | probably_damaging(1) | TCGA-EK-A2RJ-01 | Cervix | cervical & endocervical cancer | Female | <65 | I/II | Unknown | Unknown | SD |
| STRN4 | SNV | Missense_Mutation | c.1885N>A | p.Val629Ile | p.V629I | Q9NRL3 | protein_coding | deleterious(0) | benign(0.003) | TCGA-A6-6653-01 | Colorectum | colon adenocarcinoma | Male | >=65 | I/II | Unknown | Unknown | SD | |
| STRN4 | SNV | Missense_Mutation | c.773N>A | p.Gly258Asp | p.G258D | Q9NRL3 | protein_coding | tolerated(0.22) | benign(0.287) | TCGA-AA-3710-01 | Colorectum | colon adenocarcinoma | Female | >=65 | I/II | Unknown | Unknown | SD | |
| STRN4 | SNV | Missense_Mutation | rs560915215 | c.2006N>A | p.Arg669His | p.R669H | Q9NRL3 | protein_coding | deleterious(0) | probably_damaging(0.977) | TCGA-AA-3821-01 | Colorectum | colon adenocarcinoma | Female | >=65 | I/II | Unknown | Unknown | SD |
| Page: 1 2 3 4 5 6 7 |
Top |
Related drugs of malignant transformation related genes |
| Identification of chemicals and drugs interact with genes involved in malignant transfromation |
| (DGIdb 4.0) |
| Entrez ID | Symbol | Category | Interaction Types | Drug Claim Name | Drug Name | PMIDs |
| Page: 1 |

Copyright 2023-Present -The University of Texas Health Science Center at Houston |