
|
|||||
|
 | |
| |
| |
| |
| |
| |
|
Gene: STRN |
Gene summary for STRN |
| Gene information | Species | Human | Gene symbol | STRN | Gene ID | 6801 |
| Gene name | striatin | |
| Gene Alias | PPP2R6A | |
| Cytomap | 2p22.2 | |
| Gene Type | protein-coding | GO ID | GO:0007043 | UniProtAcc | O43815 |
Top |
Malignant transformation analysis |
| Identification of the aberrant gene expression in precancerous and cancerous lesions by comparing the gene expression of stem-like cells in diseased tissues with normal stem cells |
| Entrez ID | Symbol | Replicates | Species | Organ | Tissue | Adj P-value | Log2FC | Malignancy |
| 6801 | STRN | CCI_1 | Human | Cervix | CC | 9.76e-03 | 1.01e+00 | 0.528 |
| 6801 | STRN | CCI_2 | Human | Cervix | CC | 6.43e-08 | 9.46e-01 | 0.5249 |
| 6801 | STRN | CCI_3 | Human | Cervix | CC | 1.11e-04 | 5.89e-01 | 0.516 |
| 6801 | STRN | HTA11_3410_2000001011 | Human | Colorectum | AD | 7.64e-16 | -5.83e-01 | 0.0155 |
| 6801 | STRN | HTA11_866_3004761011 | Human | Colorectum | AD | 7.30e-10 | -4.57e-01 | 0.096 |
| 6801 | STRN | HTA11_10711_2000001011 | Human | Colorectum | AD | 3.75e-02 | -3.58e-01 | 0.0338 |
| 6801 | STRN | HTA11_6818_2000001021 | Human | Colorectum | AD | 4.48e-03 | -3.68e-01 | 0.0588 |
| 6801 | STRN | HTA11_99999970781_79442 | Human | Colorectum | MSS | 4.45e-09 | -3.90e-01 | 0.294 |
| 6801 | STRN | HTA11_99999974143_84620 | Human | Colorectum | MSS | 6.59e-08 | -3.37e-01 | 0.3005 |
| 6801 | STRN | A001-C-207 | Human | Colorectum | FAP | 1.37e-03 | -2.12e-01 | 0.1278 |
| 6801 | STRN | A015-C-203 | Human | Colorectum | FAP | 8.35e-33 | -4.66e-01 | -0.1294 |
| 6801 | STRN | A015-C-204 | Human | Colorectum | FAP | 4.19e-11 | -4.78e-01 | -0.0228 |
| 6801 | STRN | A014-C-040 | Human | Colorectum | FAP | 4.05e-03 | -1.67e-01 | -0.1184 |
| 6801 | STRN | A002-C-201 | Human | Colorectum | FAP | 2.09e-17 | -4.07e-01 | 0.0324 |
| 6801 | STRN | A002-C-203 | Human | Colorectum | FAP | 8.28e-04 | -1.69e-01 | 0.2786 |
| 6801 | STRN | A001-C-119 | Human | Colorectum | FAP | 1.95e-09 | -2.98e-01 | -0.1557 |
| 6801 | STRN | A001-C-108 | Human | Colorectum | FAP | 4.39e-16 | -1.55e-01 | -0.0272 |
| 6801 | STRN | A002-C-205 | Human | Colorectum | FAP | 2.16e-22 | -4.15e-01 | -0.1236 |
| 6801 | STRN | A001-C-104 | Human | Colorectum | FAP | 1.74e-02 | -7.12e-02 | 0.0184 |
| 6801 | STRN | A015-C-005 | Human | Colorectum | FAP | 1.39e-03 | -8.67e-02 | -0.0336 |
| Page: 1 2 3 4 5 6 |
| Tissue | Expression Dynamics | Abbreviation |
| Cervix | 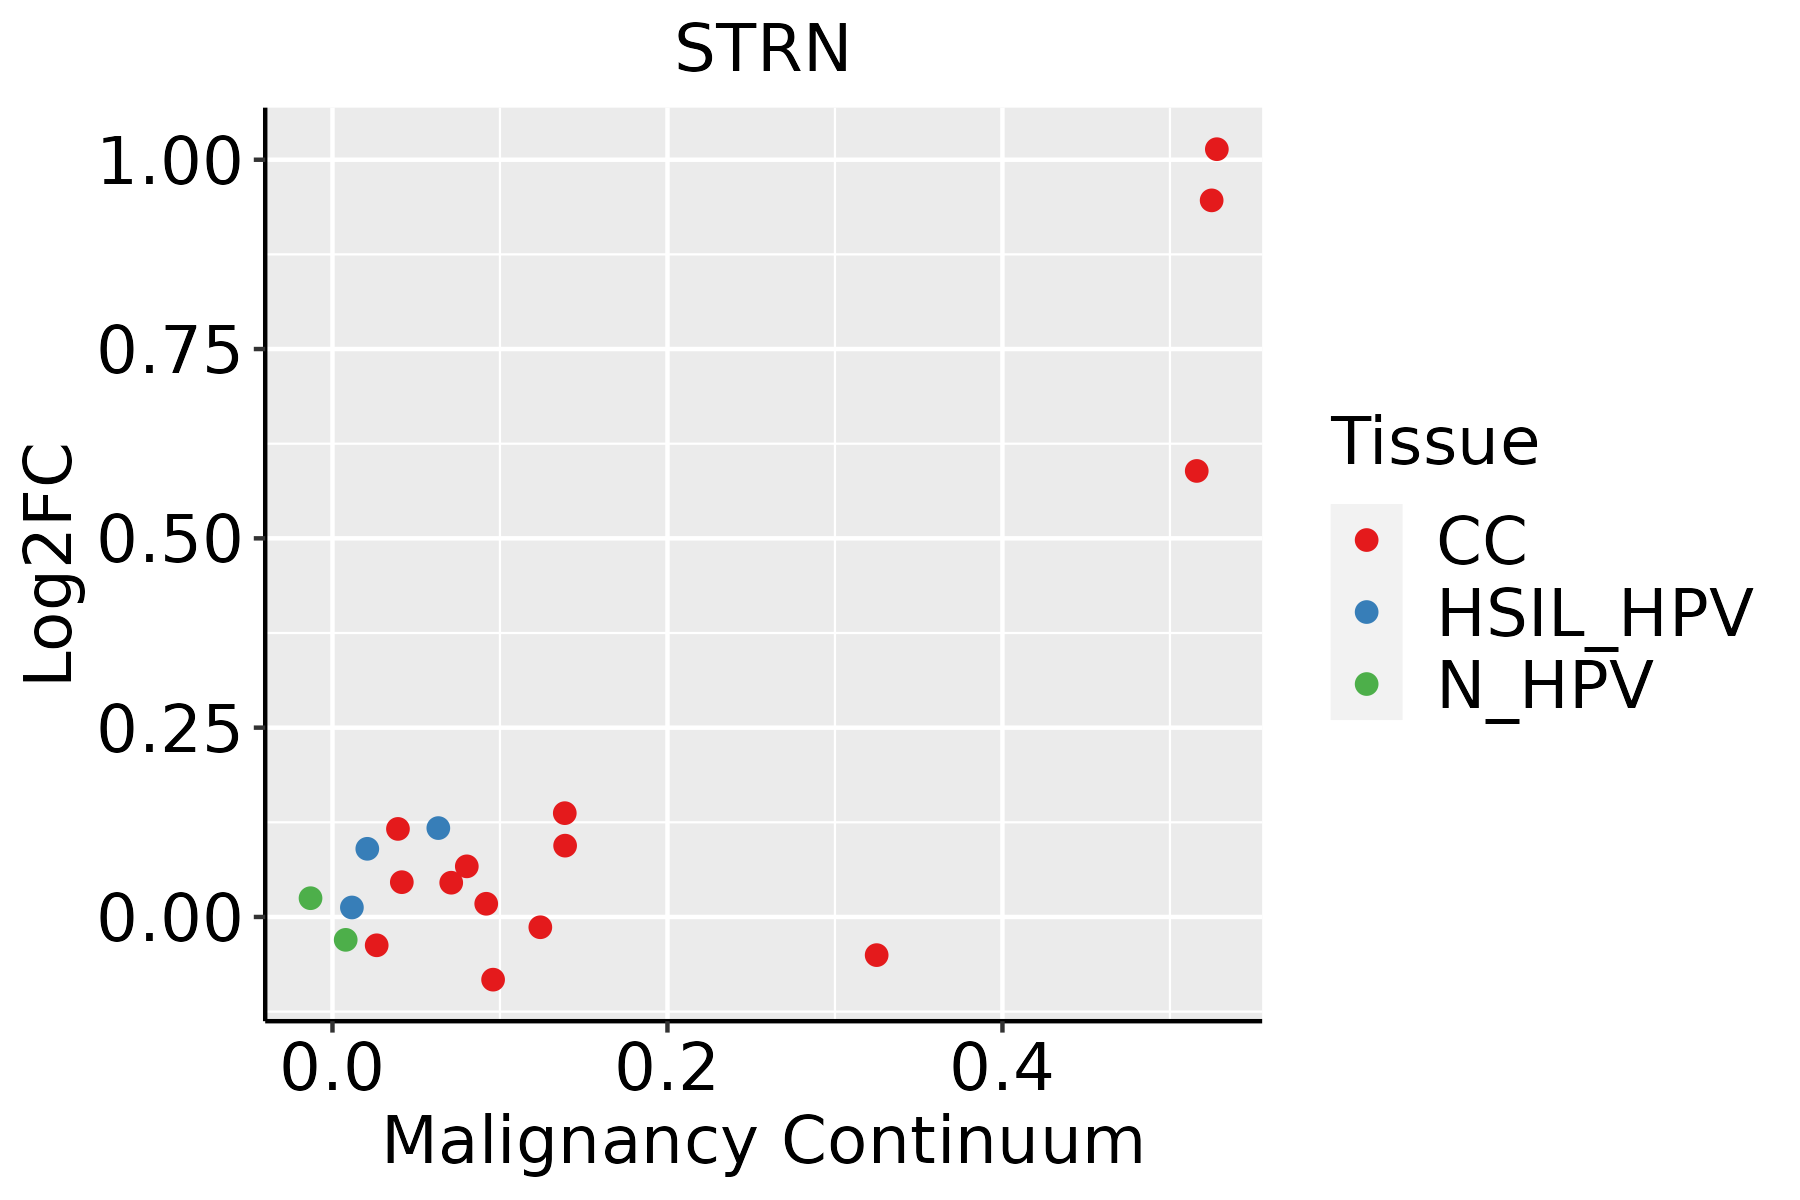 | CC: Cervix cancer |
| HSIL_HPV: HPV-infected high-grade squamous intraepithelial lesions | ||
| N_HPV: HPV-infected normal cervix | ||
| Colorectum (GSE201348) |  | FAP: Familial adenomatous polyposis |
| CRC: Colorectal cancer | ||
| Colorectum (HTA11) |  | AD: Adenomas |
| SER: Sessile serrated lesions | ||
| MSI-H: Microsatellite-high colorectal cancer | ||
| MSS: Microsatellite stable colorectal cancer | ||
| Esophagus | 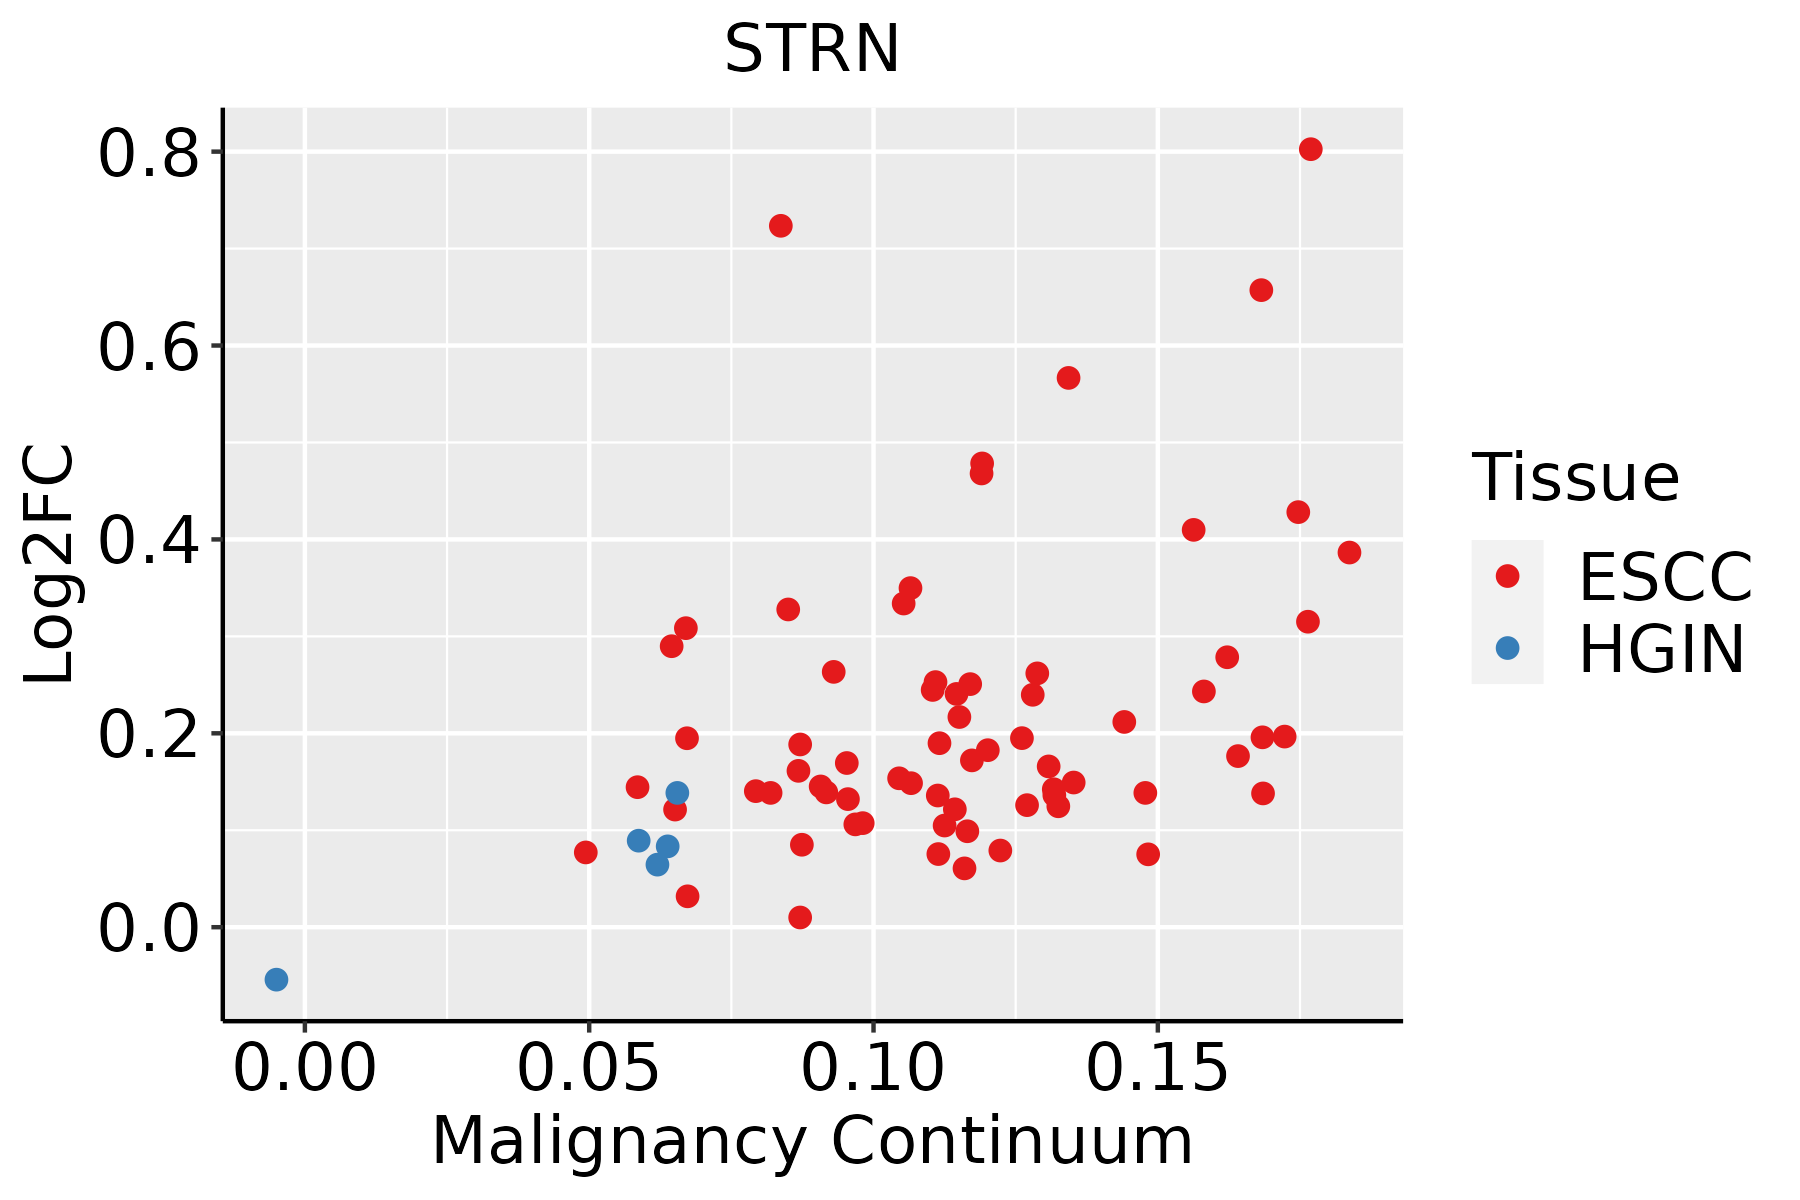 | ESCC: Esophageal squamous cell carcinoma |
| HGIN: High-grade intraepithelial neoplasias | ||
| LGIN: Low-grade intraepithelial neoplasias | ||
| Liver |  | HCC: Hepatocellular carcinoma |
| NAFLD: Non-alcoholic fatty liver disease | ||
| Lung |  | AAH: Atypical adenomatous hyperplasia |
| AIS: Adenocarcinoma in situ | ||
| IAC: Invasive lung adenocarcinoma | ||
| MIA: Minimally invasive adenocarcinoma | ||
| Thyroid | 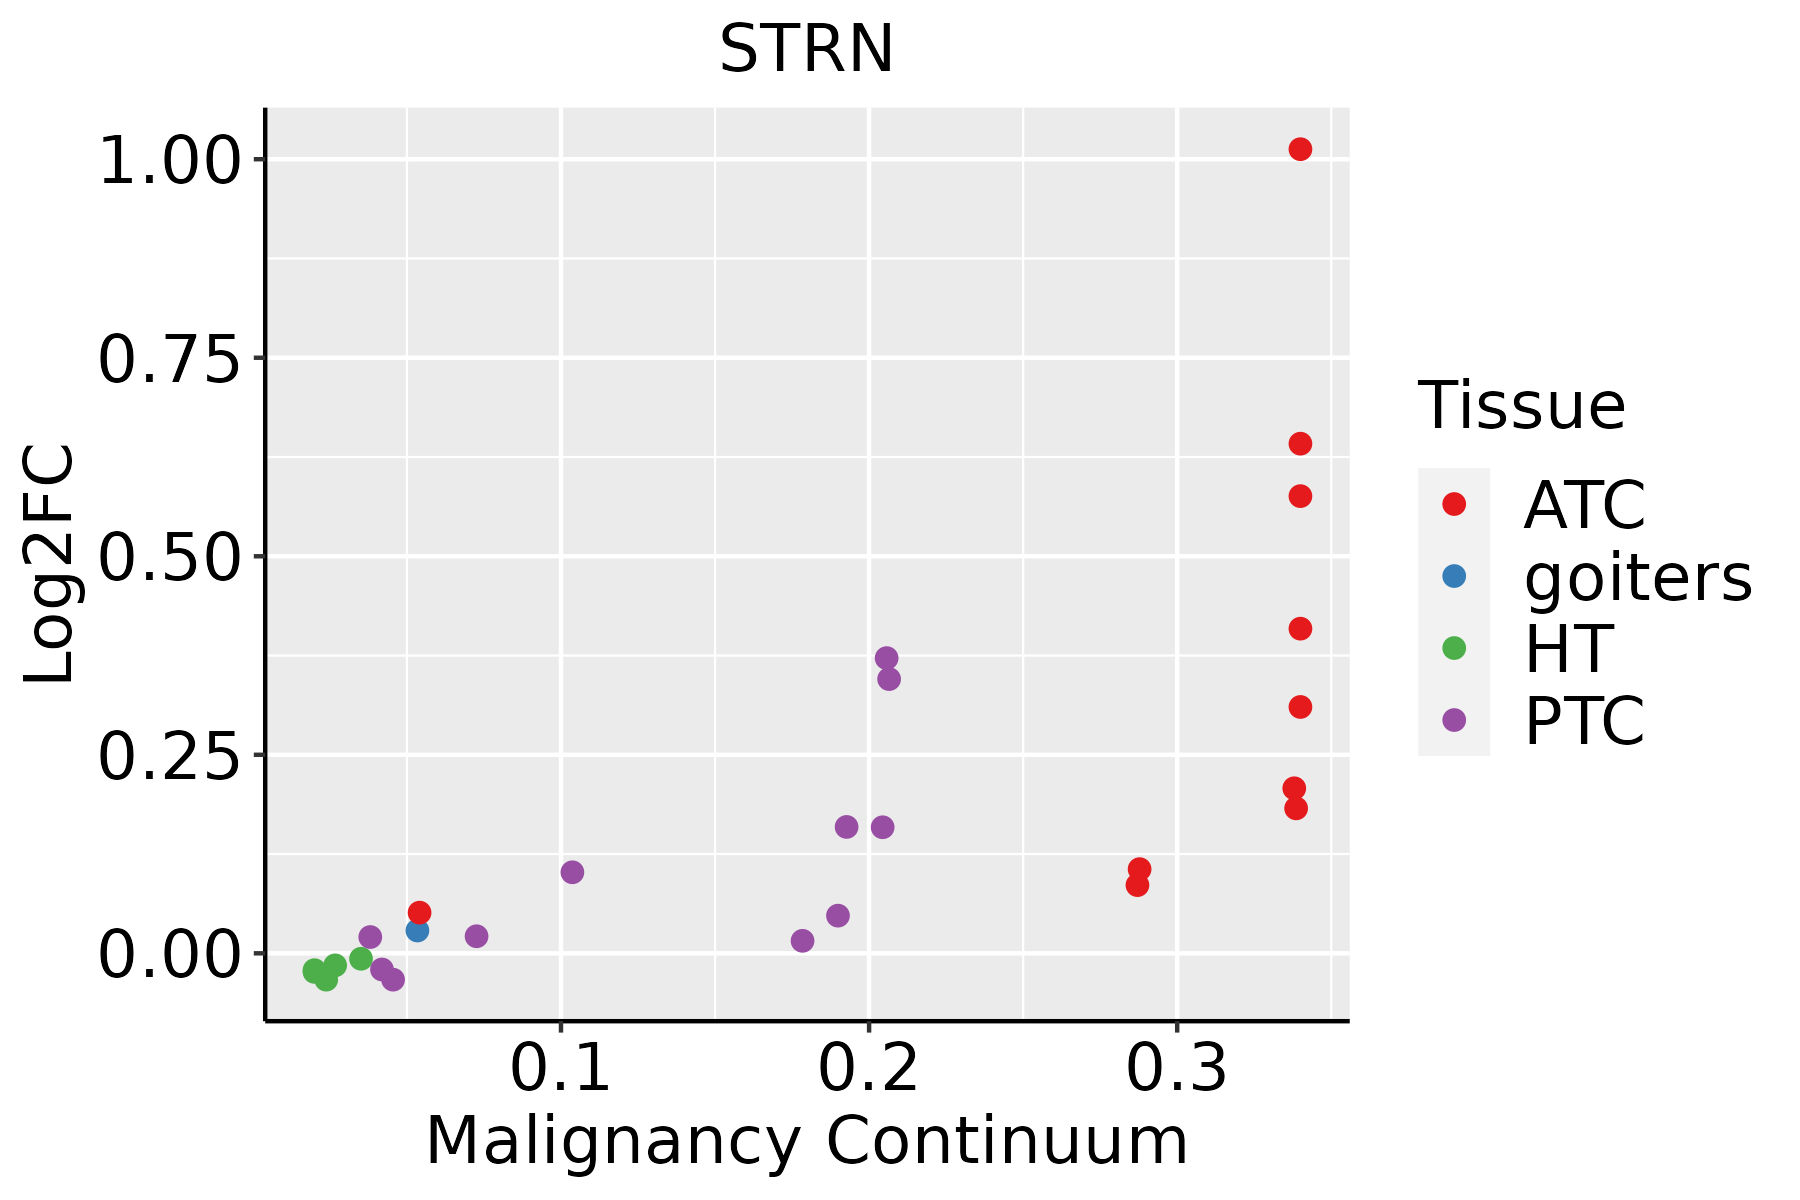 | ATC: Anaplastic thyroid cancer |
| HT: Hashimoto's thyroiditis | ||
| PTC: Papillary thyroid cancer |
| ∗log2FC in expression of this searched gene in stem-like cells from each diseased tissue sample relative to stem-like cells in normal samples in each tissue plotted against the malignancy continuum. Samples are colored based on if they are from different disease stage. |
Top |
Malignant transformation related pathway analysis |
| Find out the enriched GO biological processes and KEGG pathways involved in transition from healthy to precancer to cancer |
| Tissue | Disease Stage | Enriched GO biological Processes |
| Colorectum | AD |  |
| Colorectum | SER |  |
| Colorectum | MSS |  |
| Colorectum | MSI-H |  |
| Colorectum | FAP |  |
| ∗Top 15 enriched GO BP terms are showed in the bar plot of each disease state in each tissue. Each row represents a significant GO biological process which is colored according to the -log10(p.adjust). |
| Page: 1 2 3 4 5 6 7 8 9 |
| GO ID | Tissue | Disease Stage | Description | Gene Ratio | Bg Ratio | pvalue | p.adjust | Count |
| GO:00160557 | Cervix | CC | Wnt signaling pathway | 98/2311 | 444/18723 | 4.82e-09 | 4.65e-07 | 98 |
| GO:01987387 | Cervix | CC | cell-cell signaling by wnt | 98/2311 | 446/18723 | 6.16e-09 | 5.58e-07 | 98 |
| GO:00452169 | Cervix | CC | cell-cell junction organization | 53/2311 | 200/18723 | 3.83e-08 | 2.53e-06 | 53 |
| GO:00343298 | Cervix | CC | cell junction assembly | 88/2311 | 420/18723 | 3.42e-07 | 1.38e-05 | 88 |
| GO:00163587 | Cervix | CC | dendrite development | 58/2311 | 243/18723 | 4.52e-07 | 1.76e-05 | 58 |
| GO:004854510 | Cervix | CC | response to steroid hormone | 74/2311 | 339/18723 | 5.71e-07 | 2.09e-05 | 74 |
| GO:00070439 | Cervix | CC | cell-cell junction assembly | 39/2311 | 146/18723 | 1.86e-06 | 5.94e-05 | 39 |
| GO:00305229 | Cervix | CC | intracellular receptor signaling pathway | 60/2311 | 265/18723 | 1.89e-06 | 5.97e-05 | 60 |
| GO:00432978 | Cervix | CC | apical junction assembly | 24/2311 | 78/18723 | 1.36e-05 | 2.73e-04 | 24 |
| GO:00323556 | Cervix | CC | response to estradiol | 34/2311 | 141/18723 | 8.19e-05 | 1.11e-03 | 34 |
| GO:01201927 | Cervix | CC | tight junction assembly | 21/2311 | 74/18723 | 1.69e-04 | 2.00e-03 | 21 |
| GO:01201937 | Cervix | CC | tight junction organization | 22/2311 | 80/18723 | 1.97e-04 | 2.26e-03 | 22 |
| GO:00708306 | Cervix | CC | bicellular tight junction assembly | 18/2311 | 70/18723 | 1.69e-03 | 1.29e-02 | 18 |
| GO:00713839 | Cervix | CC | cellular response to steroid hormone stimulus | 40/2311 | 204/18723 | 1.93e-03 | 1.42e-02 | 40 |
| GO:00305188 | Cervix | CC | intracellular steroid hormone receptor signaling pathway | 25/2311 | 116/18723 | 3.59e-03 | 2.30e-02 | 25 |
| GO:0045216 | Colorectum | AD | cell-cell junction organization | 80/3918 | 200/18723 | 5.57e-10 | 4.58e-08 | 80 |
| GO:0034329 | Colorectum | AD | cell junction assembly | 136/3918 | 420/18723 | 2.02e-08 | 1.15e-06 | 136 |
| GO:0007043 | Colorectum | AD | cell-cell junction assembly | 57/3918 | 146/18723 | 4.18e-07 | 1.61e-05 | 57 |
| GO:0071383 | Colorectum | AD | cellular response to steroid hormone stimulus | 73/3918 | 204/18723 | 6.31e-07 | 2.24e-05 | 73 |
| GO:0030522 | Colorectum | AD | intracellular receptor signaling pathway | 87/3918 | 265/18723 | 3.69e-06 | 1.03e-04 | 87 |
| Page: 1 2 3 4 5 6 7 8 9 10 11 12 13 14 15 16 17 18 19 20 |
| Pathway ID | Tissue | Disease Stage | Description | Gene Ratio | Bg Ratio | pvalue | p.adjust | qvalue | Count |
| Page: 1 |
Top |
Cell-cell communication analysis |
| Identification of potential cell-cell interactions between two cell types and their ligand-receptor pairs for different disease states |
| Ligand | Receptor | LRpair | Pathway | Tissue | Disease Stage |
| Page: 1 |
Top |
Single-cell gene regulatory network inference analysis |
| Find out the significant the regulons (TFs) and the target genes of each regulon across cell types for different disease states |
| TF | Cell Type | Tissue | Disease Stage | Target Gene | RSS | Regulon Activity |
| ∗The dot plots of a searched regulon are shown for all cell subpopulations in each disease state of each tissue based on the regulon specific score inferred using pySCENIC and by calculating the average expression. |
| Page: 1 |
Top |
Somatic mutation of malignant transformation related genes |
| Annotation of somatic variants for genes involved in malignant transformation |
| Hugo Symbol | Variant Class | Variant Classification | dbSNP RS | HGVSc | HGVSp | HGVSp Short | SWISSPROT | BIOTYPE | SIFT | PolyPhen | Tumor Sample Barcode | Tissue | Histology | Sex | Age | Stage | Therapy Types | Drugs | Outcome |
| STRN | SNV | Missense_Mutation | rs766580191 | c.799N>A | p.Val267Ile | p.V267I | O43815 | protein_coding | tolerated(0.36) | benign(0.009) | TCGA-A8-A06X-01 | Breast | breast invasive carcinoma | Female | >=65 | I/II | Unknown | Unknown | SD |
| STRN | SNV | Missense_Mutation | c.1106N>T | p.Ser369Leu | p.S369L | O43815 | protein_coding | tolerated(0.26) | benign(0.003) | TCGA-BH-A0BP-01 | Breast | breast invasive carcinoma | Female | >=65 | I/II | Unknown | Unknown | SD | |
| STRN | insertion | Nonsense_Mutation | novel | c.376_377insGTGTACAATACCTAGTTATTCTCAGTATGTAATAGTT | p.Asn126SerfsTer11 | p.N126Sfs*11 | O43815 | protein_coding | TCGA-AN-A0FS-01 | Breast | breast invasive carcinoma | Female | <65 | I/II | Unknown | Unknown | SD | ||
| STRN | SNV | Missense_Mutation | novel | c.1486N>A | p.Ala496Thr | p.A496T | O43815 | protein_coding | tolerated(0.11) | benign(0.01) | TCGA-EA-A3HS-01 | Cervix | cervical & endocervical cancer | Female | <65 | I/II | Unknown | Unknown | SD |
| STRN | SNV | Missense_Mutation | c.1379N>A | p.Arg460Lys | p.R460K | O43815 | protein_coding | deleterious(0) | probably_damaging(0.999) | TCGA-MY-A5BD-01 | Cervix | cervical & endocervical cancer | Female | <65 | I/II | Chemotherapy | cisplatin | CR | |
| STRN | SNV | Missense_Mutation | c.240N>C | p.Gln80His | p.Q80H | O43815 | protein_coding | deleterious(0.01) | probably_damaging(0.986) | TCGA-Q1-A73O-01 | Cervix | cervical & endocervical cancer | Female | <65 | I/II | Chemotherapy | cisplatin | CR | |
| STRN | SNV | Missense_Mutation | c.988N>G | p.Thr330Ala | p.T330A | O43815 | protein_coding | tolerated(0.57) | benign(0.003) | TCGA-AA-3966-01 | Colorectum | colon adenocarcinoma | Female | >=65 | I/II | Unknown | Unknown | SD | |
| STRN | SNV | Missense_Mutation | c.913G>T | p.Gly305Cys | p.G305C | O43815 | protein_coding | deleterious(0) | possibly_damaging(0.827) | TCGA-AM-5821-01 | Colorectum | colon adenocarcinoma | Female | >=65 | I/II | Unknown | Unknown | SD | |
| STRN | SNV | Missense_Mutation | rs748865330 | c.836N>A | p.Arg279Gln | p.R279Q | O43815 | protein_coding | tolerated(0.44) | benign(0.18) | TCGA-AZ-4313-01 | Colorectum | colon adenocarcinoma | Female | <65 | I/II | Unknown | Unknown | SD |
| STRN | SNV | Missense_Mutation | novel | c.1434N>T | p.Leu478Phe | p.L478F | O43815 | protein_coding | deleterious(0) | probably_damaging(0.987) | TCGA-CA-6717-01 | Colorectum | colon adenocarcinoma | Male | <65 | I/II | Chemotherapy | oxaliplatin | CR |
| Page: 1 2 3 4 5 6 7 8 |
Top |
Related drugs of malignant transformation related genes |
| Identification of chemicals and drugs interact with genes involved in malignant transfromation |
| (DGIdb 4.0) |
| Entrez ID | Symbol | Category | Interaction Types | Drug Claim Name | Drug Name | PMIDs |
| Page: 1 |

Copyright 2023-Present -The University of Texas Health Science Center at Houston |