
|
|||||
|
 | |
| |
| |
| |
| |
| |
|
Gene: STRIP1 |
Gene summary for STRIP1 |
| Gene information | Species | Human | Gene symbol | STRIP1 | Gene ID | 85369 |
| Gene name | striatin interacting protein 1 | |
| Gene Alias | FAM40A | |
| Cytomap | 1p13.3 | |
| Gene Type | protein-coding | GO ID | GO:0000902 | UniProtAcc | Q5VSL9 |
Top |
Malignant transformation analysis |
| Identification of the aberrant gene expression in precancerous and cancerous lesions by comparing the gene expression of stem-like cells in diseased tissues with normal stem cells |
| Entrez ID | Symbol | Replicates | Species | Organ | Tissue | Adj P-value | Log2FC | Malignancy |
| 85369 | STRIP1 | HCC1_Meng | Human | Liver | HCC | 8.78e-19 | 8.43e-03 | 0.0246 |
| 85369 | STRIP1 | HCC2_Meng | Human | Liver | HCC | 1.49e-07 | 4.40e-02 | 0.0107 |
| 85369 | STRIP1 | S014 | Human | Liver | HCC | 2.08e-12 | 4.84e-01 | 0.2254 |
| 85369 | STRIP1 | S015 | Human | Liver | HCC | 3.38e-14 | 5.39e-01 | 0.2375 |
| 85369 | STRIP1 | S016 | Human | Liver | HCC | 6.21e-15 | 4.24e-01 | 0.2243 |
| 85369 | STRIP1 | S028 | Human | Liver | HCC | 5.78e-10 | 3.92e-01 | 0.2503 |
| 85369 | STRIP1 | S029 | Human | Liver | HCC | 1.09e-10 | 5.02e-01 | 0.2581 |
| Page: 1 |
| Tissue | Expression Dynamics | Abbreviation |
| Liver | 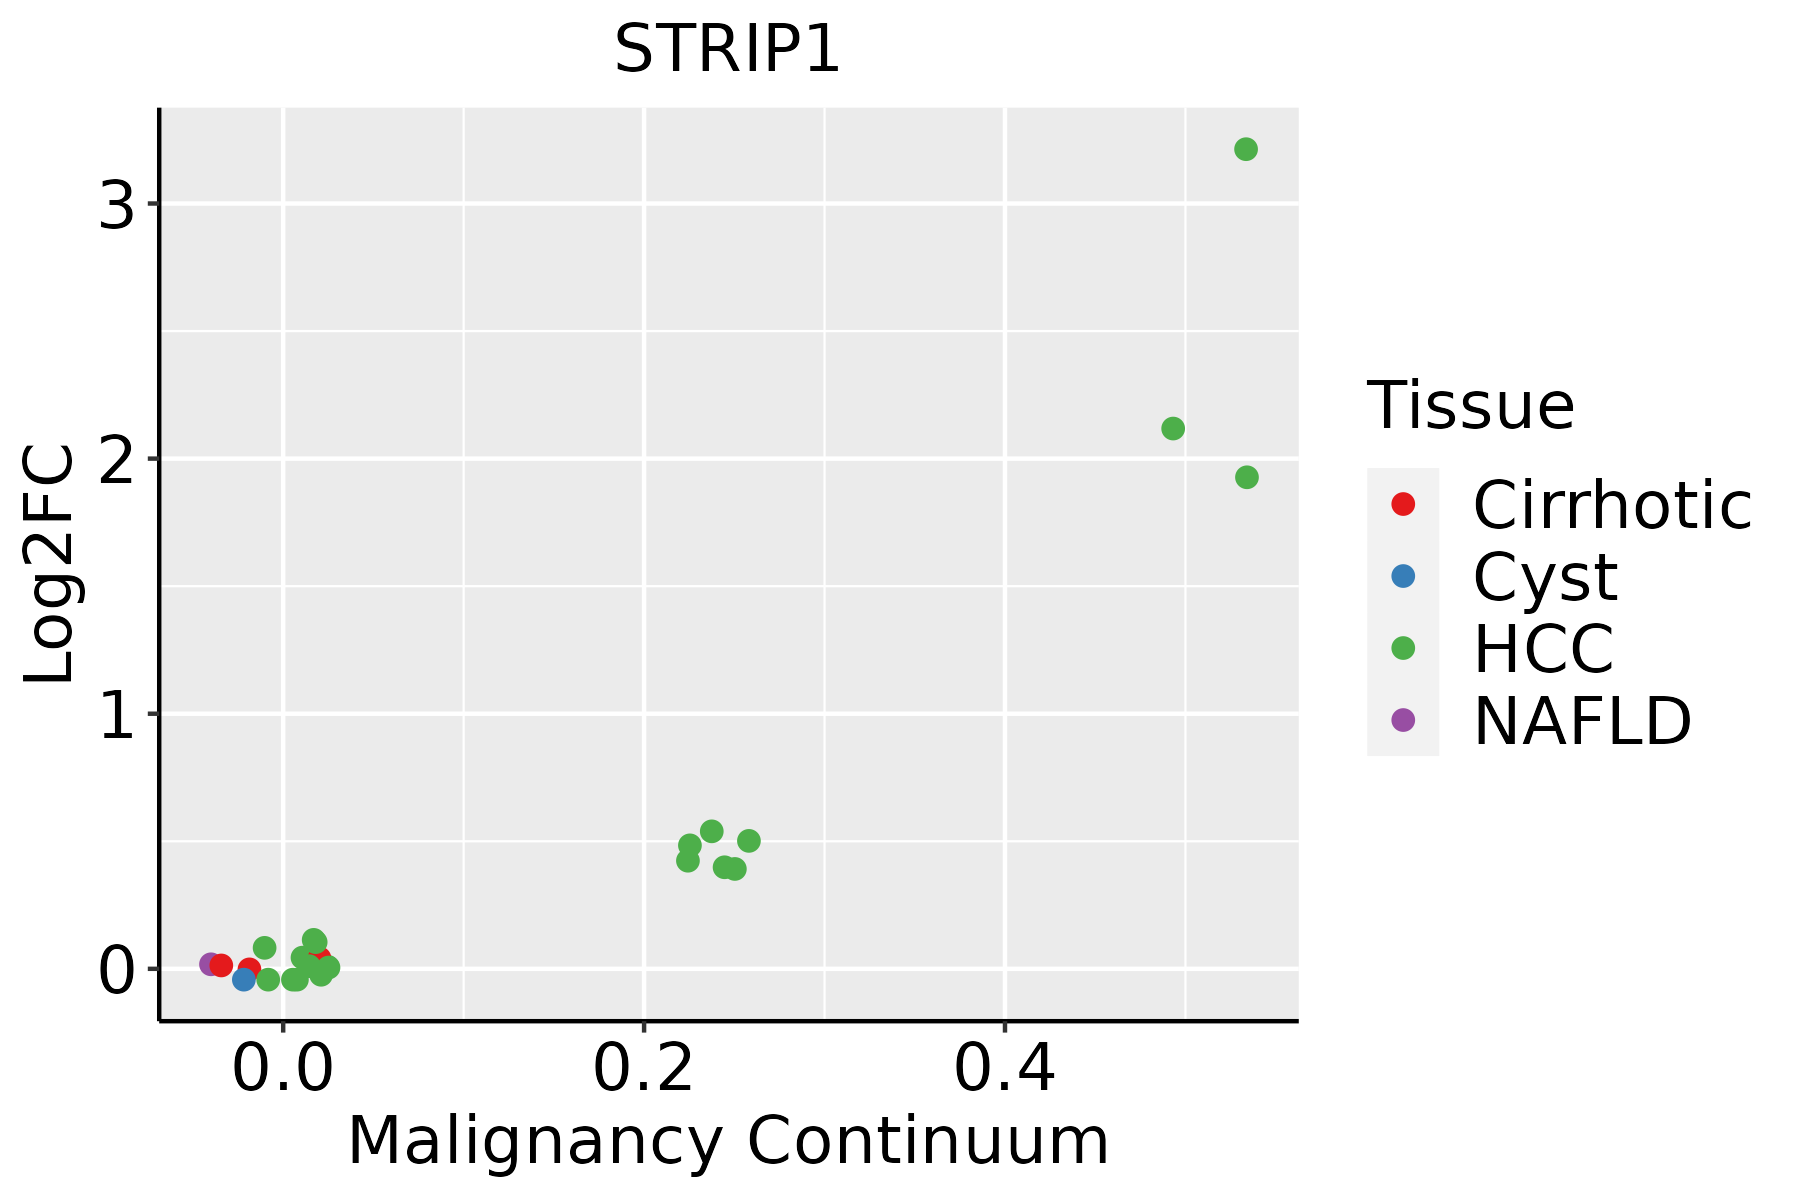 | HCC: Hepatocellular carcinoma |
| NAFLD: Non-alcoholic fatty liver disease |
| ∗log2FC in expression of this searched gene in stem-like cells from each diseased tissue sample relative to stem-like cells in normal samples in each tissue plotted against the malignancy continuum. Samples are colored based on if they are from different disease stage. |
Top |
Malignant transformation related pathway analysis |
| Find out the enriched GO biological processes and KEGG pathways involved in transition from healthy to precancer to cancer |
| Tissue | Disease Stage | Enriched GO biological Processes |
| Colorectum | AD |  |
| Colorectum | SER |  |
| Colorectum | MSS |  |
| Colorectum | MSI-H |  |
| Colorectum | FAP |  |
| ∗Top 15 enriched GO BP terms are showed in the bar plot of each disease state in each tissue. Each row represents a significant GO biological process which is colored according to the -log10(p.adjust). |
| Page: 1 2 3 4 5 6 7 8 9 |
| GO ID | Tissue | Disease Stage | Description | Gene Ratio | Bg Ratio | pvalue | p.adjust | Count |
| GO:002260422 | Liver | HCC | regulation of cell morphogenesis | 188/7958 | 309/18723 | 4.84e-11 | 1.82e-09 | 188 |
| GO:003086512 | Liver | HCC | cortical cytoskeleton organization | 47/7958 | 61/18723 | 4.03e-08 | 8.69e-07 | 47 |
| GO:003086612 | Liver | HCC | cortical actin cytoskeleton organization | 30/7958 | 40/18723 | 3.04e-05 | 3.12e-04 | 30 |
| Page: 1 |
| Pathway ID | Tissue | Disease Stage | Description | Gene Ratio | Bg Ratio | pvalue | p.adjust | qvalue | Count |
| Page: 1 |
Top |
Cell-cell communication analysis |
| Identification of potential cell-cell interactions between two cell types and their ligand-receptor pairs for different disease states |
| Ligand | Receptor | LRpair | Pathway | Tissue | Disease Stage |
| Page: 1 |
Top |
Single-cell gene regulatory network inference analysis |
| Find out the significant the regulons (TFs) and the target genes of each regulon across cell types for different disease states |
| TF | Cell Type | Tissue | Disease Stage | Target Gene | RSS | Regulon Activity |
| ∗The dot plots of a searched regulon are shown for all cell subpopulations in each disease state of each tissue based on the regulon specific score inferred using pySCENIC and by calculating the average expression. |
| Page: 1 |
Top |
Somatic mutation of malignant transformation related genes |
| Annotation of somatic variants for genes involved in malignant transformation |
| Hugo Symbol | Variant Class | Variant Classification | dbSNP RS | HGVSc | HGVSp | HGVSp Short | SWISSPROT | BIOTYPE | SIFT | PolyPhen | Tumor Sample Barcode | Tissue | Histology | Sex | Age | Stage | Therapy Types | Drugs | Outcome |
| STRIP1 | SNV | Missense_Mutation | c.1563G>T | p.Met521Ile | p.M521I | Q5VSL9 | protein_coding | tolerated(0.11) | benign(0.088) | TCGA-A2-A25A-01 | Breast | breast invasive carcinoma | Female | <65 | I/II | Unspecific | Cytoxan | SD | |
| STRIP1 | SNV | Missense_Mutation | c.795N>A | p.Met265Ile | p.M265I | Q5VSL9 | protein_coding | tolerated(0.56) | benign(0.013) | TCGA-AN-A0AK-01 | Breast | breast invasive carcinoma | Female | >=65 | I/II | Unknown | Unknown | SD | |
| STRIP1 | SNV | Missense_Mutation | rs775147531 | c.1639N>T | p.Asp547Tyr | p.D547Y | Q5VSL9 | protein_coding | deleterious(0) | probably_damaging(0.992) | TCGA-AR-A0TQ-01 | Breast | breast invasive carcinoma | Female | <65 | III/IV | Chemotherapy | doxorubicin | SD |
| STRIP1 | SNV | Missense_Mutation | c.1136N>A | p.Arg379Gln | p.R379Q | Q5VSL9 | protein_coding | tolerated(0.53) | benign(0.086) | TCGA-AR-A1AV-01 | Breast | breast invasive carcinoma | Male | >=65 | I/II | Chemotherapy | cytoxan | SD | |
| STRIP1 | SNV | Missense_Mutation | c.757N>T | p.Gly253Cys | p.G253C | Q5VSL9 | protein_coding | deleterious(0.02) | probably_damaging(0.935) | TCGA-BH-A1FC-01 | Breast | breast invasive carcinoma | Female | >=65 | I/II | Unknown | Unknown | SD | |
| STRIP1 | insertion | Frame_Shift_Ins | novel | c.1914_1915insCTGGGAGGCCTTGCCCTGTCAAGTTCAGCAGGATCATCAATTTCTT | p.Cys639LeufsTer20 | p.C639Lfs*20 | Q5VSL9 | protein_coding | TCGA-A8-A097-01 | Breast | breast invasive carcinoma | Female | >=65 | I/II | Hormone Therapy | tamoxiphen | SD | ||
| STRIP1 | insertion | In_Frame_Ins | novel | c.600_601insCCACCTCCCGGCTTCAAGCTATTCTCCTGCCTCAGCCTTCTGAGT | p.Ser200_Ser201insProProProGlyPheLysLeuPheSerCysLeuSerLeuLeuSer | p.S200_S201insPPPGFKLFSCLSLLS | Q5VSL9 | protein_coding | TCGA-AO-A0J5-01 | Breast | breast invasive carcinoma | Female | <65 | III/IV | Other, specify in notesBisphosphonate | zoledronic | PD | ||
| STRIP1 | insertion | In_Frame_Ins | novel | c.289_290insGCTGCTGCCACTGCCACTCTC | p.Asn97delinsSerCysCysHisCysHisSerHis | p.N97delinsSCCHCHSH | Q5VSL9 | protein_coding | TCGA-AR-A0TY-01 | Breast | breast invasive carcinoma | Female | <65 | I/II | Unspecific | Paclitaxel | PD | ||
| STRIP1 | insertion | Frame_Shift_Ins | novel | c.1109_1110insTTGCTGTGTGT | p.Asp371CysfsTer37 | p.D371Cfs*37 | Q5VSL9 | protein_coding | TCGA-B6-A0IB-01 | Breast | breast invasive carcinoma | Female | <65 | III/IV | Unknown | Unknown | PD | ||
| STRIP1 | insertion | Nonsense_Mutation | novel | c.1661_1661+1insGTGA | p.Thr555Ter | p.T555* | Q5VSL9 | protein_coding | TCGA-D8-A143-01 | Breast | breast invasive carcinoma | Female | <65 | I/II | Chemotherapy | doxorubicin | SD |
| Page: 1 2 3 4 5 6 7 8 |
Top |
Related drugs of malignant transformation related genes |
| Identification of chemicals and drugs interact with genes involved in malignant transfromation |
| (DGIdb 4.0) |
| Entrez ID | Symbol | Category | Interaction Types | Drug Claim Name | Drug Name | PMIDs |
| Page: 1 |

Copyright 2023-Present -The University of Texas Health Science Center at Houston |