
|
|||||
|
 | |
| |
| |
| |
| |
| |
|
Gene: STRBP |
Gene summary for STRBP |
| Gene information | Species | Human | Gene symbol | STRBP | Gene ID | 55342 |
| Gene name | spermatid perinuclear RNA binding protein | |
| Gene Alias | HEL162 | |
| Cytomap | 9q33.3 | |
| Gene Type | protein-coding | GO ID | GO:0000003 | UniProtAcc | Q96SI9 |
Top |
Malignant transformation analysis |
| Identification of the aberrant gene expression in precancerous and cancerous lesions by comparing the gene expression of stem-like cells in diseased tissues with normal stem cells |
| Entrez ID | Symbol | Replicates | Species | Organ | Tissue | Adj P-value | Log2FC | Malignancy |
| 55342 | STRBP | CCI_2 | Human | Cervix | CC | 1.63e-16 | 1.43e+00 | 0.5249 |
| 55342 | STRBP | CCI_3 | Human | Cervix | CC | 7.35e-21 | 1.27e+00 | 0.516 |
| 55342 | STRBP | HTA11_3410_2000001011 | Human | Colorectum | AD | 1.36e-24 | -6.21e-01 | 0.0155 |
| 55342 | STRBP | HTA11_2951_2000001011 | Human | Colorectum | AD | 6.16e-06 | -7.93e-01 | 0.0216 |
| 55342 | STRBP | HTA11_3361_2000001011 | Human | Colorectum | AD | 2.53e-05 | -5.04e-01 | -0.1207 |
| 55342 | STRBP | HTA11_5216_2000001011 | Human | Colorectum | SER | 9.45e-06 | -4.71e-01 | -0.1462 |
| 55342 | STRBP | HTA11_866_3004761011 | Human | Colorectum | AD | 6.36e-11 | -5.34e-01 | 0.096 |
| 55342 | STRBP | HTA11_4255_2000001011 | Human | Colorectum | SER | 9.28e-03 | -5.16e-01 | 0.0446 |
| 55342 | STRBP | HTA11_8622_2000001021 | Human | Colorectum | SER | 3.39e-07 | -6.27e-01 | 0.0528 |
| 55342 | STRBP | HTA11_10711_2000001011 | Human | Colorectum | AD | 4.90e-02 | -3.69e-01 | 0.0338 |
| 55342 | STRBP | HTA11_11156_2000001011 | Human | Colorectum | AD | 3.17e-04 | -7.11e-01 | 0.0397 |
| 55342 | STRBP | HTA11_99999970781_79442 | Human | Colorectum | MSS | 3.32e-02 | -2.61e-01 | 0.294 |
| 55342 | STRBP | HTA11_99999973899_84307 | Human | Colorectum | MSS | 2.35e-06 | -6.30e-01 | 0.2585 |
| 55342 | STRBP | HTA11_99999974143_84620 | Human | Colorectum | MSS | 8.67e-35 | -8.12e-01 | 0.3005 |
| 55342 | STRBP | F007 | Human | Colorectum | FAP | 8.28e-05 | -2.11e-01 | 0.1176 |
| 55342 | STRBP | A001-C-207 | Human | Colorectum | FAP | 1.32e-04 | -2.55e-01 | 0.1278 |
| 55342 | STRBP | A015-C-203 | Human | Colorectum | FAP | 1.53e-38 | -5.58e-01 | -0.1294 |
| 55342 | STRBP | A015-C-204 | Human | Colorectum | FAP | 9.23e-07 | -2.56e-01 | -0.0228 |
| 55342 | STRBP | A014-C-040 | Human | Colorectum | FAP | 6.52e-09 | -5.93e-01 | -0.1184 |
| 55342 | STRBP | A002-C-201 | Human | Colorectum | FAP | 2.67e-19 | -4.00e-01 | 0.0324 |
| Page: 1 2 3 4 5 6 7 8 |
| Tissue | Expression Dynamics | Abbreviation |
| Cervix | 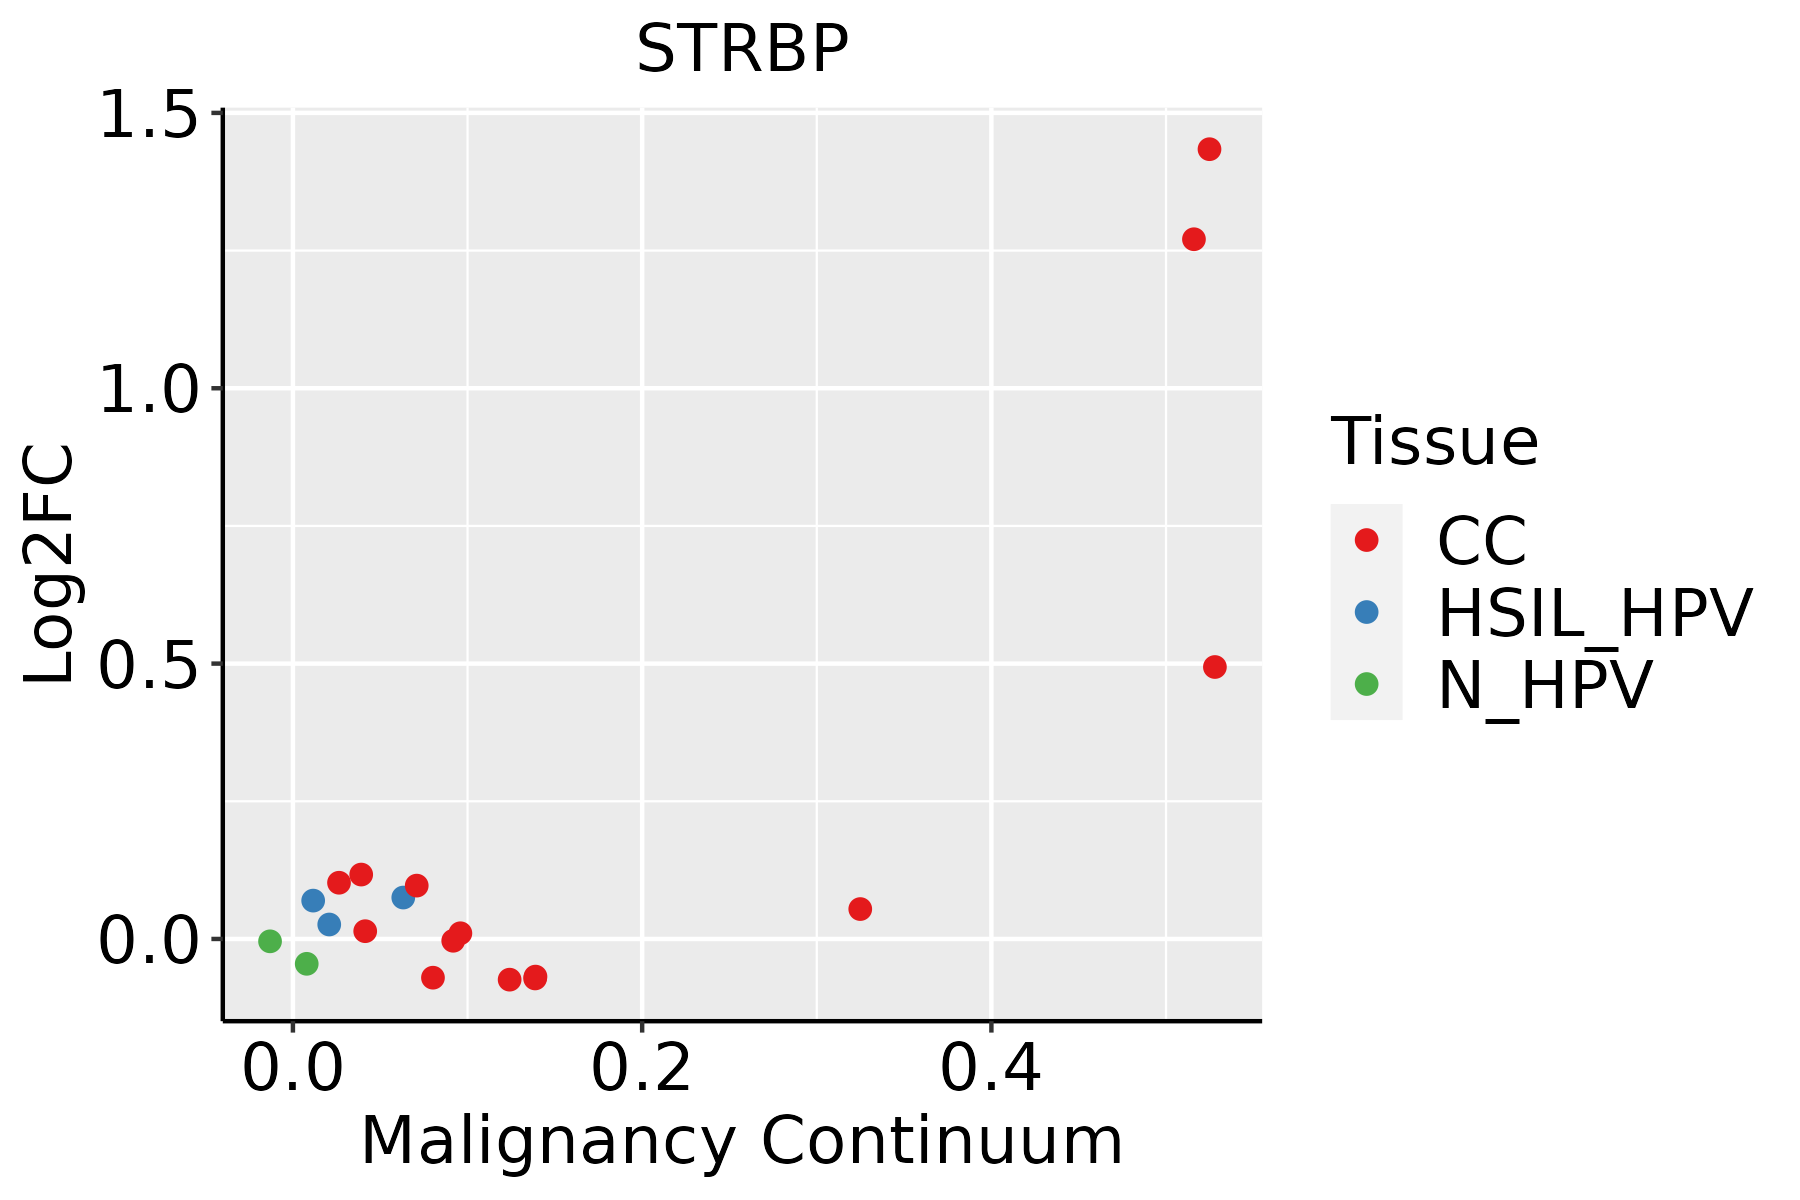 | CC: Cervix cancer |
| HSIL_HPV: HPV-infected high-grade squamous intraepithelial lesions | ||
| N_HPV: HPV-infected normal cervix | ||
| Colorectum (GSE201348) |  | FAP: Familial adenomatous polyposis |
| CRC: Colorectal cancer | ||
| Colorectum (HTA11) |  | AD: Adenomas |
| SER: Sessile serrated lesions | ||
| MSI-H: Microsatellite-high colorectal cancer | ||
| MSS: Microsatellite stable colorectal cancer | ||
| Endometrium | 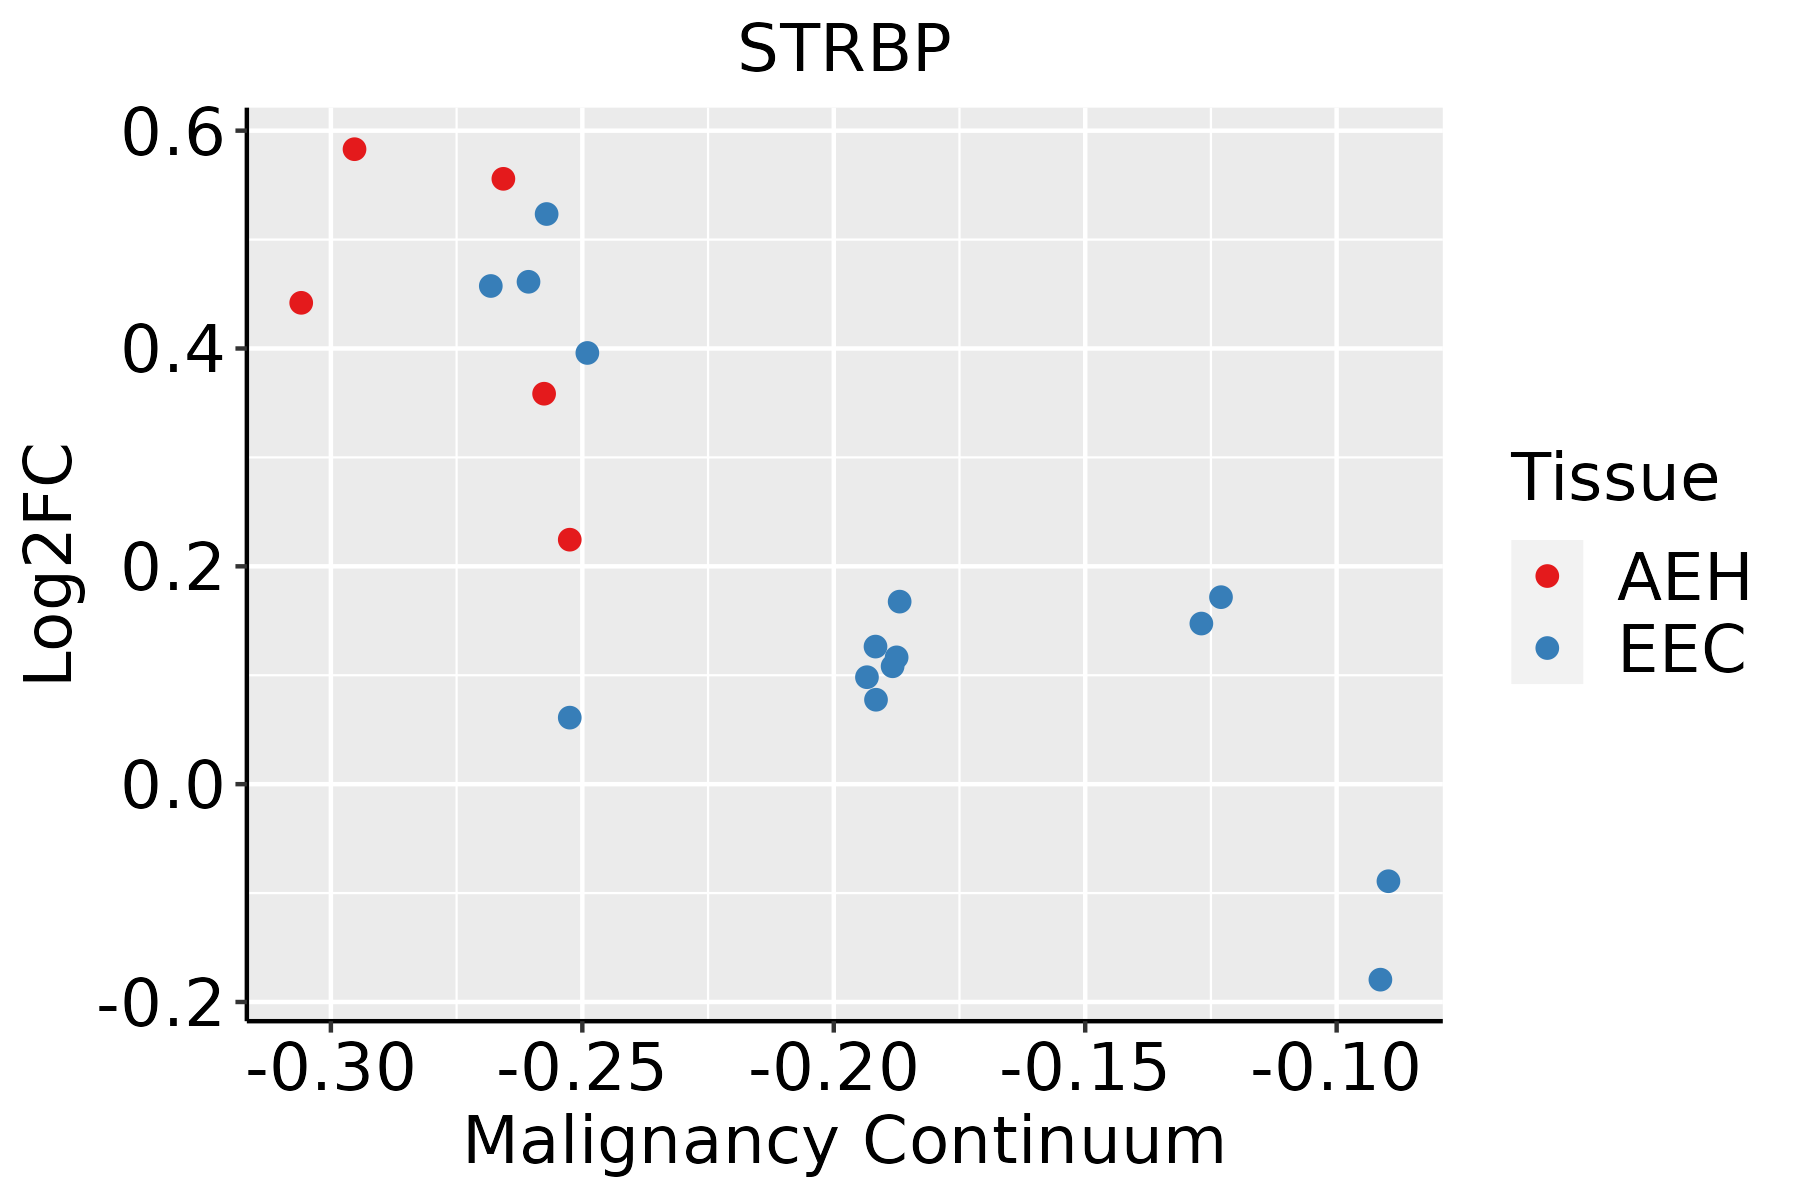 | AEH: Atypical endometrial hyperplasia |
| EEC: Endometrioid Cancer | ||
| Esophagus | 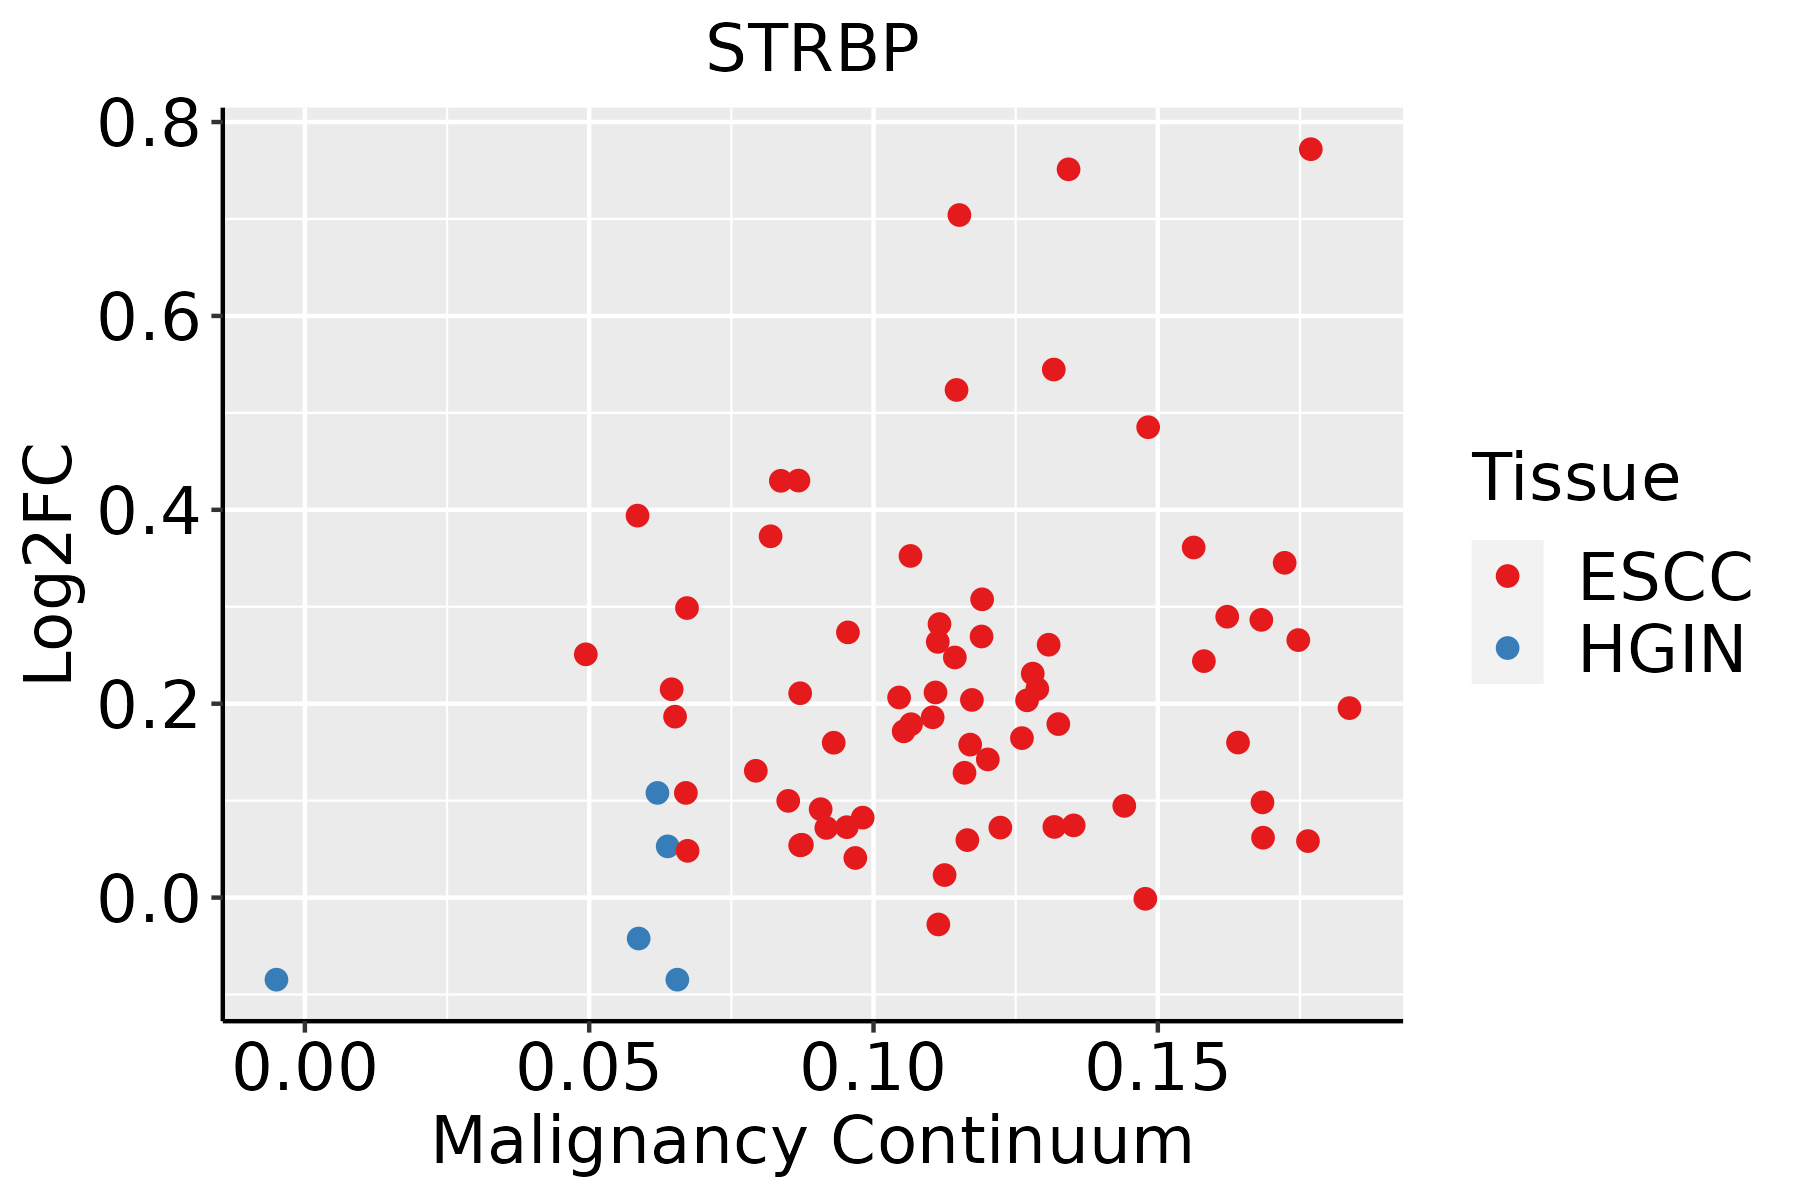 | ESCC: Esophageal squamous cell carcinoma |
| HGIN: High-grade intraepithelial neoplasias | ||
| LGIN: Low-grade intraepithelial neoplasias | ||
| Liver |  | HCC: Hepatocellular carcinoma |
| NAFLD: Non-alcoholic fatty liver disease | ||
| Lung |  | AAH: Atypical adenomatous hyperplasia |
| AIS: Adenocarcinoma in situ | ||
| IAC: Invasive lung adenocarcinoma | ||
| MIA: Minimally invasive adenocarcinoma | ||
| Oral Cavity | 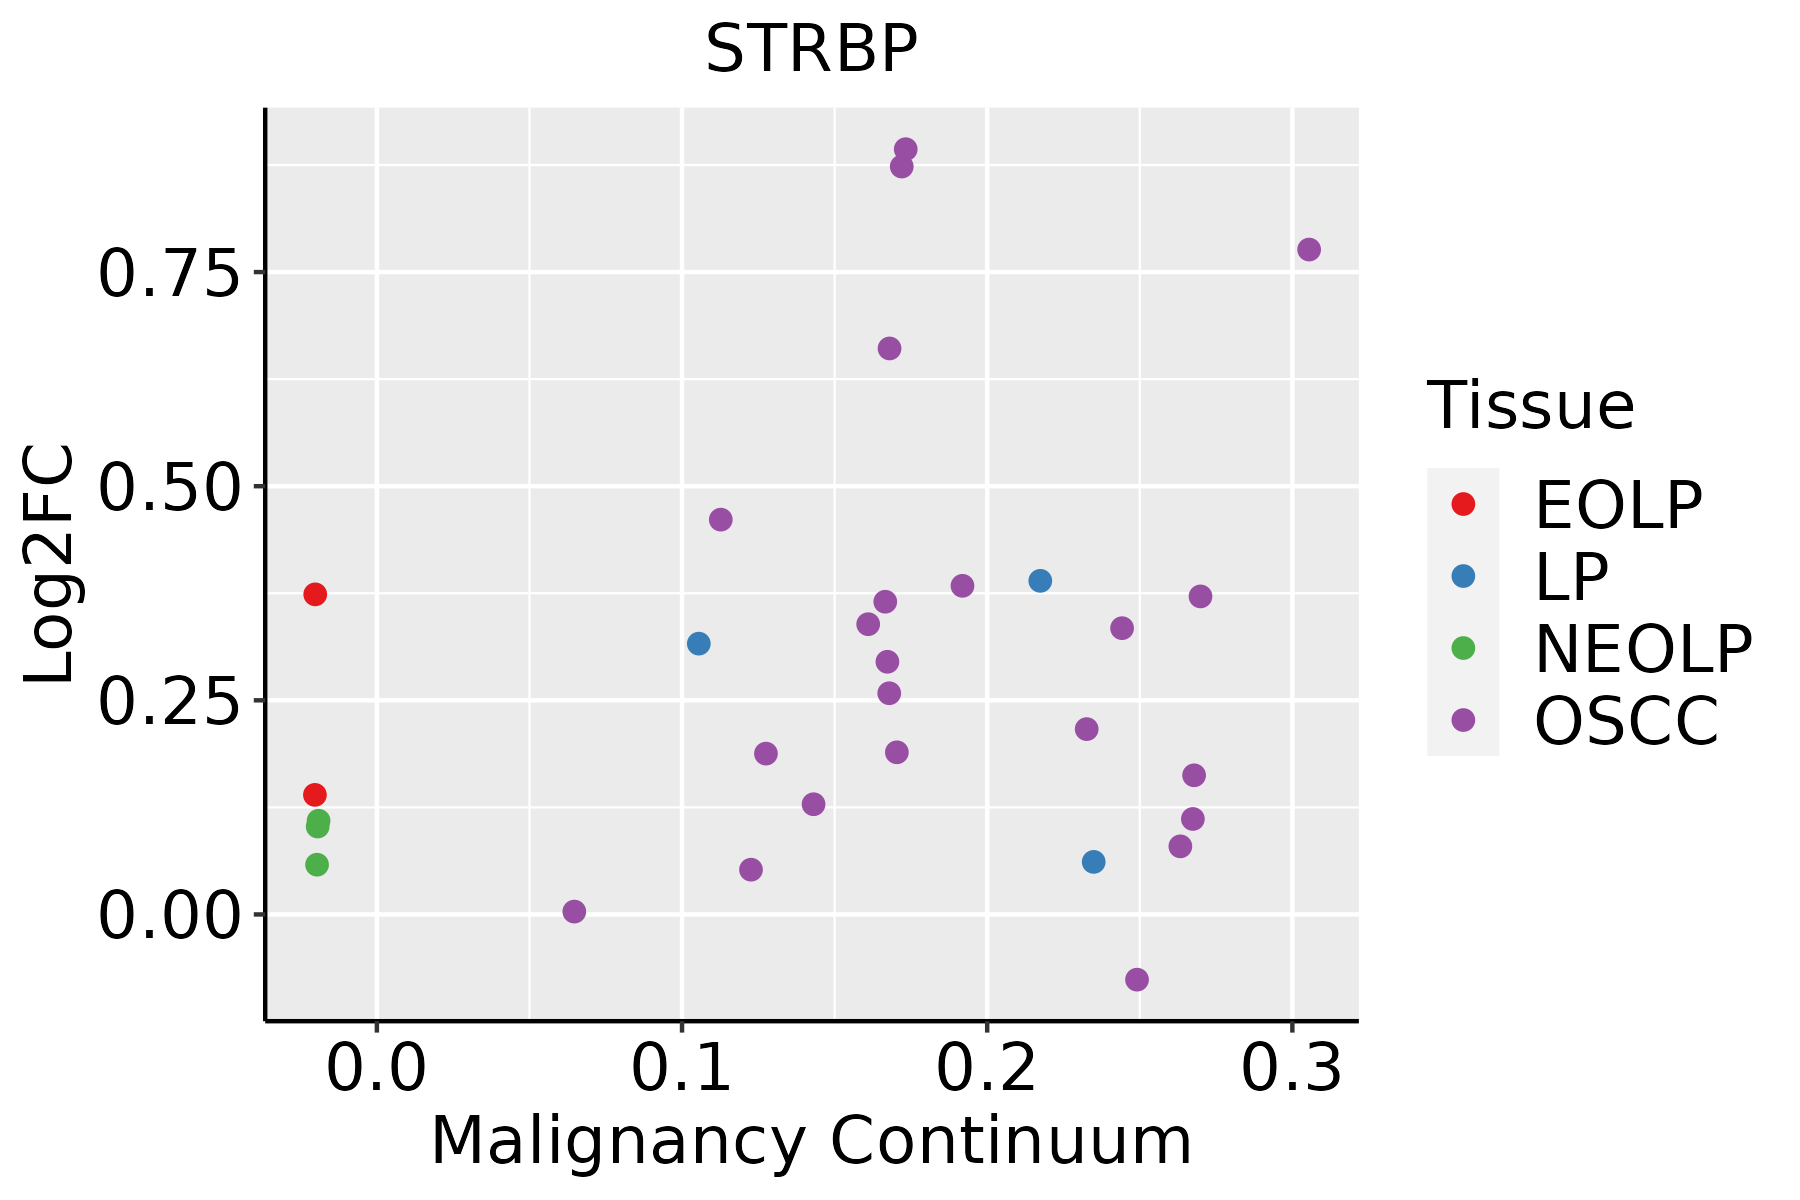 | EOLP: Erosive Oral lichen planus |
| LP: leukoplakia | ||
| NEOLP: Non-erosive oral lichen planus | ||
| OSCC: Oral squamous cell carcinoma | ||
| Thyroid |  | ATC: Anaplastic thyroid cancer |
| HT: Hashimoto's thyroiditis | ||
| PTC: Papillary thyroid cancer |
| ∗log2FC in expression of this searched gene in stem-like cells from each diseased tissue sample relative to stem-like cells in normal samples in each tissue plotted against the malignancy continuum. Samples are colored based on if they are from different disease stage. |
Top |
Malignant transformation related pathway analysis |
| Find out the enriched GO biological processes and KEGG pathways involved in transition from healthy to precancer to cancer |
| Tissue | Disease Stage | Enriched GO biological Processes |
| Colorectum | AD |  |
| Colorectum | SER |  |
| Colorectum | MSS |  |
| Colorectum | MSI-H |  |
| Colorectum | FAP |  |
| ∗Top 15 enriched GO BP terms are showed in the bar plot of each disease state in each tissue. Each row represents a significant GO biological process which is colored according to the -log10(p.adjust). |
| Page: 1 2 3 4 5 6 7 8 9 |
| GO ID | Tissue | Disease Stage | Description | Gene Ratio | Bg Ratio | pvalue | p.adjust | Count |
| GO:00096127 | Cervix | CC | response to mechanical stimulus | 48/2311 | 216/18723 | 3.23e-05 | 5.29e-04 | 48 |
| GO:00096128 | Endometrium | AEH | response to mechanical stimulus | 42/2100 | 216/18723 | 2.58e-04 | 3.04e-03 | 42 |
| GO:000961213 | Endometrium | EEC | response to mechanical stimulus | 45/2168 | 216/18723 | 6.17e-05 | 9.28e-04 | 45 |
| GO:000961216 | Esophagus | ESCC | response to mechanical stimulus | 124/8552 | 216/18723 | 3.30e-04 | 1.94e-03 | 124 |
| GO:00096124 | Liver | HCC | response to mechanical stimulus | 113/7958 | 216/18723 | 2.20e-03 | 1.10e-02 | 113 |
| GO:00096125 | Lung | IAC | response to mechanical stimulus | 39/2061 | 216/18723 | 1.29e-03 | 1.45e-02 | 39 |
| GO:000961210 | Oral cavity | OSCC | response to mechanical stimulus | 115/7305 | 216/18723 | 1.43e-05 | 1.44e-04 | 115 |
| GO:000961223 | Oral cavity | EOLP | response to mechanical stimulus | 39/2218 | 216/18723 | 4.72e-03 | 2.54e-02 | 39 |
| GO:0009612110 | Thyroid | PTC | response to mechanical stimulus | 98/5968 | 216/18723 | 2.09e-05 | 2.09e-04 | 98 |
| GO:000961225 | Thyroid | ATC | response to mechanical stimulus | 105/6293 | 216/18723 | 3.29e-06 | 3.70e-05 | 105 |
| Page: 1 |
| Pathway ID | Tissue | Disease Stage | Description | Gene Ratio | Bg Ratio | pvalue | p.adjust | qvalue | Count |
| Page: 1 |
Top |
Cell-cell communication analysis |
| Identification of potential cell-cell interactions between two cell types and their ligand-receptor pairs for different disease states |
| Ligand | Receptor | LRpair | Pathway | Tissue | Disease Stage |
| Page: 1 |
Top |
Single-cell gene regulatory network inference analysis |
| Find out the significant the regulons (TFs) and the target genes of each regulon across cell types for different disease states |
| TF | Cell Type | Tissue | Disease Stage | Target Gene | RSS | Regulon Activity |
| ∗The dot plots of a searched regulon are shown for all cell subpopulations in each disease state of each tissue based on the regulon specific score inferred using pySCENIC and by calculating the average expression. |
| Page: 1 |
Top |
Somatic mutation of malignant transformation related genes |
| Annotation of somatic variants for genes involved in malignant transformation |
| Hugo Symbol | Variant Class | Variant Classification | dbSNP RS | HGVSc | HGVSp | HGVSp Short | SWISSPROT | BIOTYPE | SIFT | PolyPhen | Tumor Sample Barcode | Tissue | Histology | Sex | Age | Stage | Therapy Types | Drugs | Outcome |
| STRBP | SNV | Missense_Mutation | c.1502N>A | p.Arg501Lys | p.R501K | Q96SI9 | protein_coding | tolerated(0.52) | benign(0.074) | TCGA-A2-A04U-01 | Breast | breast invasive carcinoma | Female | <65 | I/II | Chemotherapy | adriamycin | SD | |
| STRBP | SNV | Missense_Mutation | c.853N>A | p.Asp285Asn | p.D285N | Q96SI9 | protein_coding | deleterious(0) | probably_damaging(1) | TCGA-BH-A0HF-01 | Breast | breast invasive carcinoma | Female | >=65 | I/II | Hormone Therapy | arimidex | SD | |
| STRBP | SNV | Missense_Mutation | novel | c.579G>C | p.Gln193His | p.Q193H | Q96SI9 | protein_coding | tolerated(0.16) | benign(0.107) | TCGA-D8-A73U-01 | Breast | breast invasive carcinoma | Female | >=65 | I/II | Hormone Therapy | tamoxiphen | SD |
| STRBP | insertion | Nonsense_Mutation | novel | c.730_731insGCTGTGTCCCCATCCAAATCTCATGTTGAATTGT | p.Glu244GlyfsTer10 | p.E244Gfs*10 | Q96SI9 | protein_coding | TCGA-BH-A0BD-01 | Breast | breast invasive carcinoma | Female | <65 | I/II | Chemotherapy | doxorubicin | SD | ||
| STRBP | insertion | Frame_Shift_Ins | novel | c.893_894insTATATTTAATCACATTTCAATAGCCATTCATAAAGCCCTTA | p.Met298IlefsTer72 | p.M298Ifs*72 | Q96SI9 | protein_coding | TCGA-BH-A0BM-01 | Breast | breast invasive carcinoma | Female | <65 | I/II | Chemotherapy | adriamycin | SD | ||
| STRBP | deletion | Frame_Shift_Del | novel | c.479delT | p.Leu160Ter | p.L160* | Q96SI9 | protein_coding | TCGA-EW-A2FV-01 | Breast | breast invasive carcinoma | Female | <65 | III/IV | Chemotherapy | docetaxel | SD | ||
| STRBP | SNV | Missense_Mutation | novel | c.107N>G | p.Ser36Cys | p.S36C | Q96SI9 | protein_coding | deleterious(0) | probably_damaging(0.99) | TCGA-VS-A959-01 | Cervix | cervical & endocervical cancer | Female | >=65 | I/II | Unknown | Unknown | SD |
| STRBP | SNV | Missense_Mutation | novel | c.1711N>G | p.Leu571Val | p.L571V | Q96SI9 | protein_coding | deleterious(0) | probably_damaging(0.998) | TCGA-5M-AAT6-01 | Colorectum | colon adenocarcinoma | Female | <65 | III/IV | Unknown | Unknown | PD |
| STRBP | SNV | Missense_Mutation | c.405N>T | p.Glu135Asp | p.E135D | Q96SI9 | protein_coding | tolerated(1) | benign(0.035) | TCGA-AA-3510-01 | Colorectum | colon adenocarcinoma | Male | >=65 | I/II | Unknown | Unknown | SD | |
| STRBP | SNV | Missense_Mutation | rs762468877 | c.139N>T | p.Asp47Tyr | p.D47Y | Q96SI9 | protein_coding | deleterious(0) | probably_damaging(0.996) | TCGA-AA-3811-01 | Colorectum | colon adenocarcinoma | Female | >=65 | III/IV | Unknown | Unknown | PD |
| Page: 1 2 3 4 5 6 7 |
Top |
Related drugs of malignant transformation related genes |
| Identification of chemicals and drugs interact with genes involved in malignant transfromation |
| (DGIdb 4.0) |
| Entrez ID | Symbol | Category | Interaction Types | Drug Claim Name | Drug Name | PMIDs |
| Page: 1 |

Copyright 2023-Present -The University of Texas Health Science Center at Houston |