
|
|||||
|
 | |
| |
| |
| |
| |
| |
|
Gene: STRAP |
Gene summary for STRAP |
| Gene information | Species | Human | Gene symbol | STRAP | Gene ID | 11171 |
| Gene name | serine/threonine kinase receptor associated protein | |
| Gene Alias | MAWD | |
| Cytomap | 12p12.3 | |
| Gene Type | protein-coding | GO ID | GO:0000122 | UniProtAcc | Q9Y3F4 |
Top |
Malignant transformation analysis |
| Identification of the aberrant gene expression in precancerous and cancerous lesions by comparing the gene expression of stem-like cells in diseased tissues with normal stem cells |
| Entrez ID | Symbol | Replicates | Species | Organ | Tissue | Adj P-value | Log2FC | Malignancy |
| 11171 | STRAP | HTA11_347_2000001011 | Human | Colorectum | AD | 9.37e-04 | 1.97e-01 | -0.1954 |
| 11171 | STRAP | HTA11_866_3004761011 | Human | Colorectum | AD | 2.23e-03 | 2.32e-01 | 0.096 |
| 11171 | STRAP | HTA11_99999970781_79442 | Human | Colorectum | MSS | 1.26e-03 | 3.04e-01 | 0.294 |
| 11171 | STRAP | HTA11_99999965062_69753 | Human | Colorectum | MSI-H | 4.28e-05 | 1.09e+00 | 0.3487 |
| 11171 | STRAP | HTA11_99999971662_82457 | Human | Colorectum | MSS | 2.20e-05 | 3.82e-01 | 0.3859 |
| 11171 | STRAP | A015-C-203 | Human | Colorectum | FAP | 8.08e-03 | -1.23e-01 | -0.1294 |
| 11171 | STRAP | A001-C-108 | Human | Colorectum | FAP | 8.16e-04 | -1.55e-01 | -0.0272 |
| 11171 | STRAP | A015-C-104 | Human | Colorectum | FAP | 8.22e-04 | -1.38e-01 | -0.1899 |
| 11171 | STRAP | A002-C-116 | Human | Colorectum | FAP | 2.38e-03 | -1.18e-01 | -0.0452 |
| 11171 | STRAP | F034 | Human | Colorectum | FAP | 1.81e-03 | -1.69e-01 | -0.0665 |
| 11171 | STRAP | AEH-subject2 | Human | Endometrium | AEH | 5.68e-04 | -2.12e-01 | -0.2525 |
| 11171 | STRAP | AEH-subject3 | Human | Endometrium | AEH | 2.38e-06 | -1.90e-01 | -0.2576 |
| 11171 | STRAP | AEH-subject4 | Human | Endometrium | AEH | 6.60e-03 | -1.68e-01 | -0.2657 |
| 11171 | STRAP | EEC-subject1 | Human | Endometrium | EEC | 7.70e-06 | -1.28e-01 | -0.2682 |
| 11171 | STRAP | EEC-subject2 | Human | Endometrium | EEC | 3.22e-07 | -2.98e-01 | -0.2607 |
| 11171 | STRAP | EEC-subject3 | Human | Endometrium | EEC | 7.51e-25 | -2.94e-01 | -0.2525 |
| 11171 | STRAP | EEC-subject4 | Human | Endometrium | EEC | 5.83e-04 | -2.21e-01 | -0.2571 |
| 11171 | STRAP | GSM5276937 | Human | Endometrium | EEC | 1.88e-16 | 3.91e-01 | -0.0897 |
| 11171 | STRAP | GSM6177620_NYU_UCEC1_lib1_lib1 | Human | Endometrium | EEC | 1.35e-24 | -2.53e-01 | -0.1869 |
| 11171 | STRAP | GSM6177620_NYU_UCEC1_lib2_lib2 | Human | Endometrium | EEC | 1.23e-19 | -1.75e-01 | -0.1875 |
| Page: 1 2 3 4 5 6 7 8 |
| Tissue | Expression Dynamics | Abbreviation |
| Colorectum (GSE201348) |  | FAP: Familial adenomatous polyposis |
| CRC: Colorectal cancer | ||
| Colorectum (HTA11) |  | AD: Adenomas |
| SER: Sessile serrated lesions | ||
| MSI-H: Microsatellite-high colorectal cancer | ||
| MSS: Microsatellite stable colorectal cancer | ||
| Endometrium |  | AEH: Atypical endometrial hyperplasia |
| EEC: Endometrioid Cancer | ||
| Esophagus | 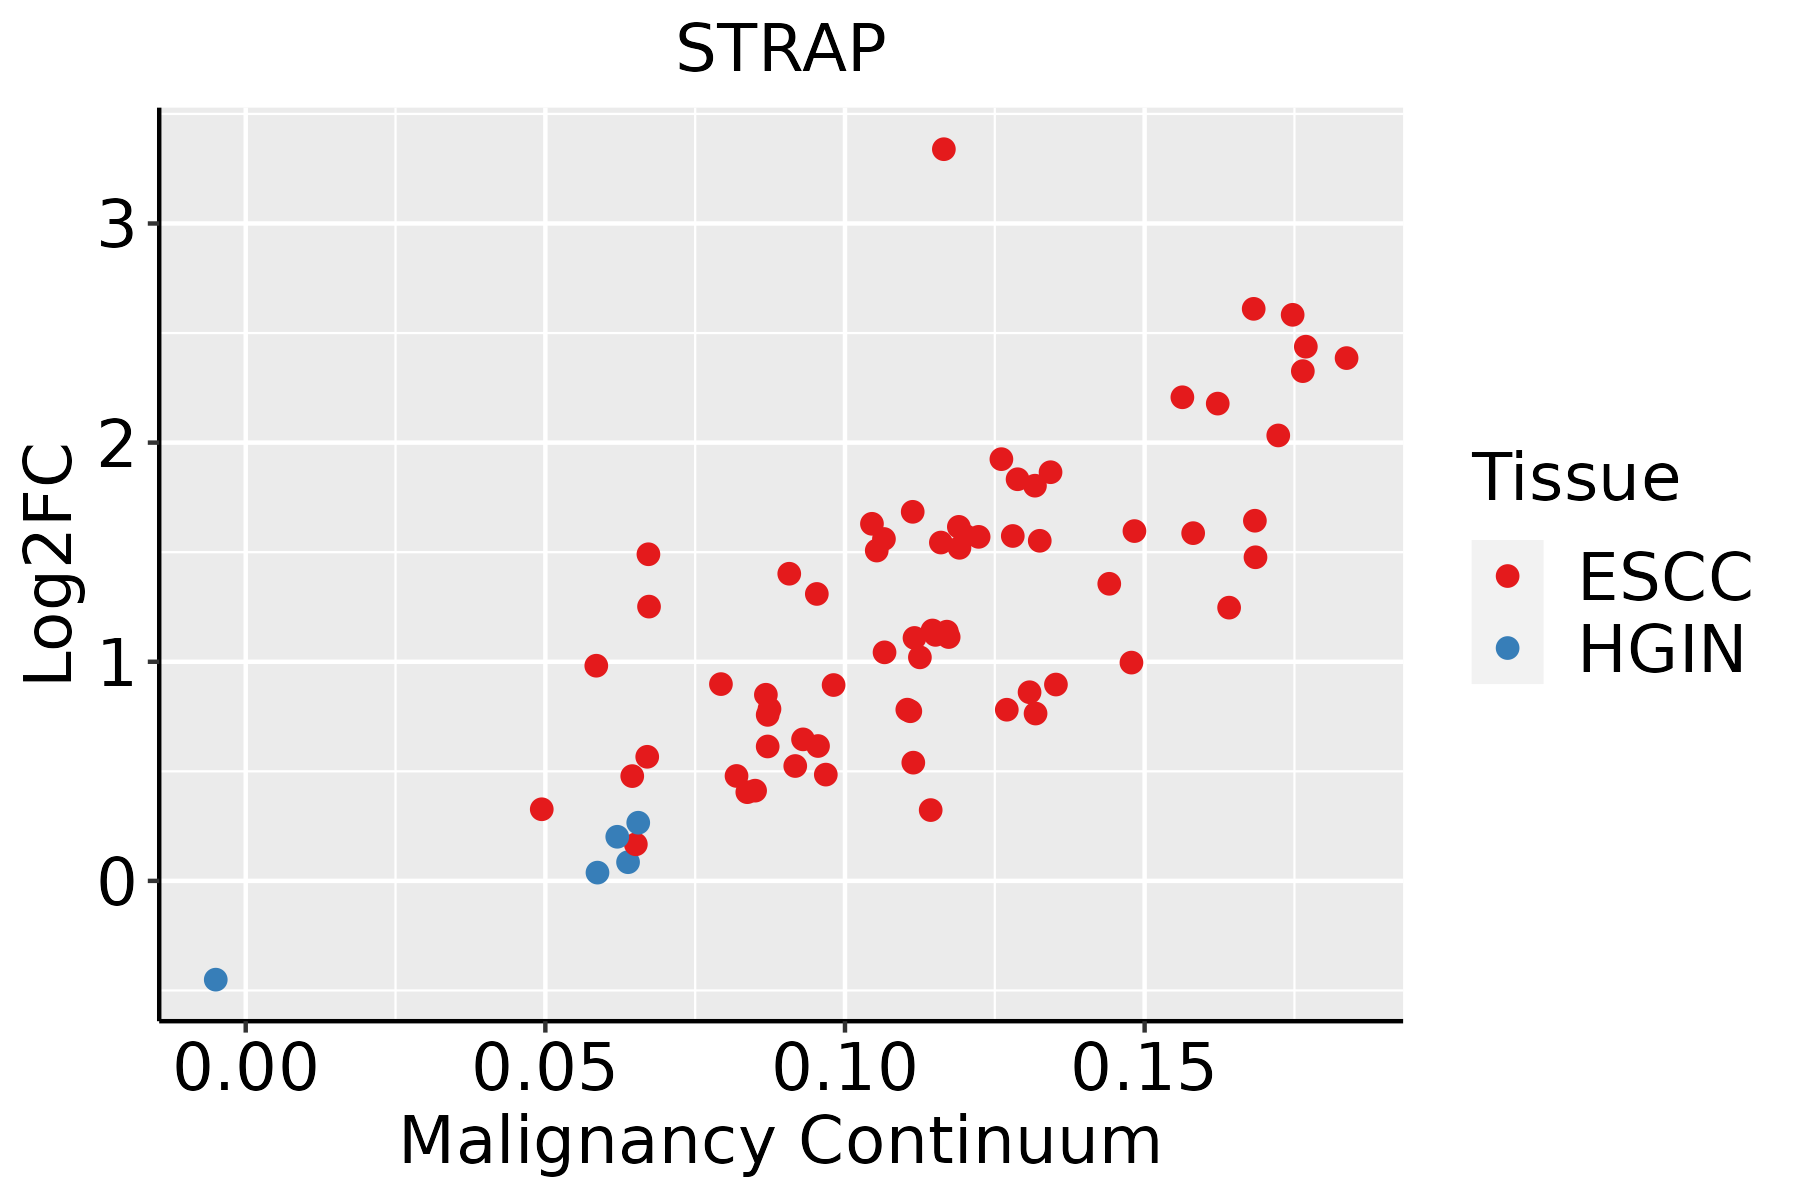 | ESCC: Esophageal squamous cell carcinoma |
| HGIN: High-grade intraepithelial neoplasias | ||
| LGIN: Low-grade intraepithelial neoplasias | ||
| Liver |  | HCC: Hepatocellular carcinoma |
| NAFLD: Non-alcoholic fatty liver disease | ||
| Oral Cavity |  | EOLP: Erosive Oral lichen planus |
| LP: leukoplakia | ||
| NEOLP: Non-erosive oral lichen planus | ||
| OSCC: Oral squamous cell carcinoma | ||
| Skin |  | AK: Actinic keratosis |
| cSCC: Cutaneous squamous cell carcinoma | ||
| SCCIS:squamous cell carcinoma in situ | ||
| Thyroid | 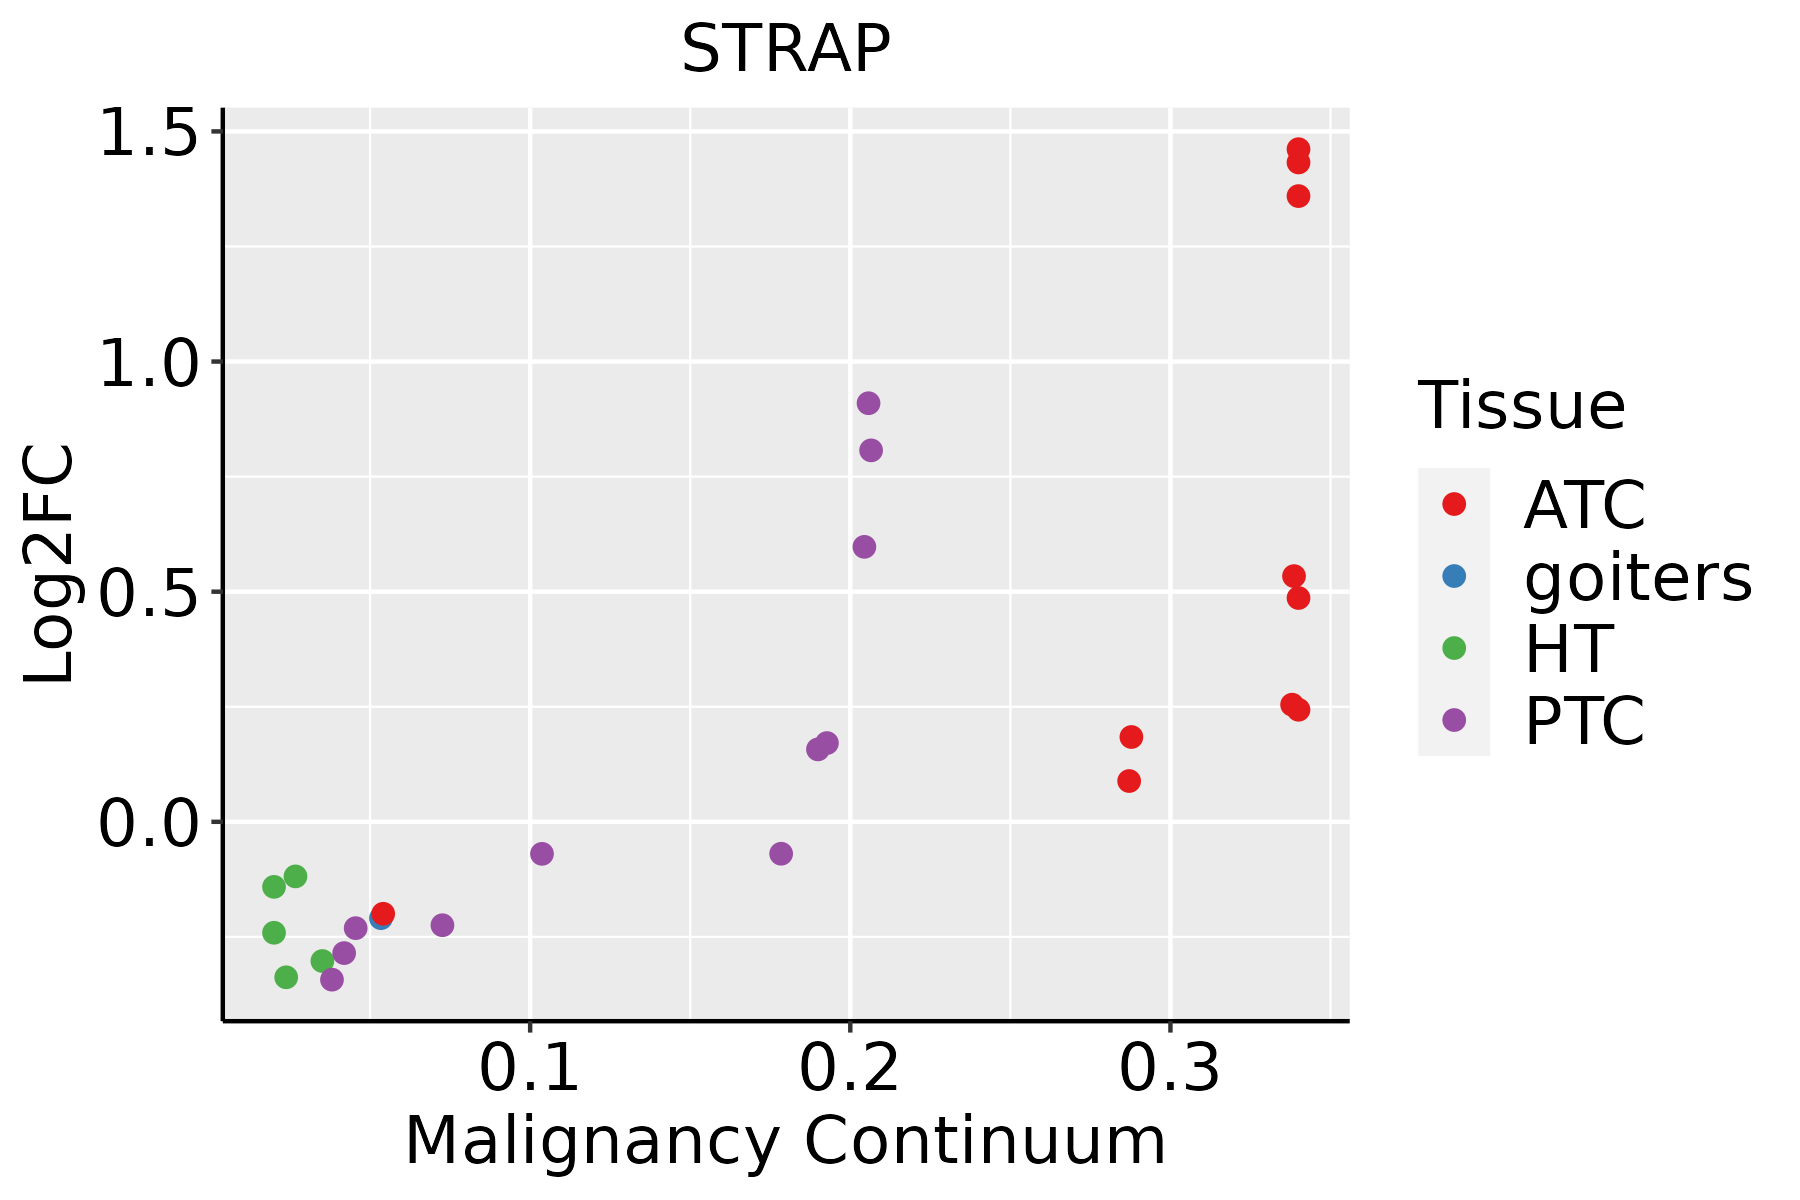 | ATC: Anaplastic thyroid cancer |
| HT: Hashimoto's thyroiditis | ||
| PTC: Papillary thyroid cancer |
| ∗log2FC in expression of this searched gene in stem-like cells from each diseased tissue sample relative to stem-like cells in normal samples in each tissue plotted against the malignancy continuum. Samples are colored based on if they are from different disease stage. |
Top |
Malignant transformation related pathway analysis |
| Find out the enriched GO biological processes and KEGG pathways involved in transition from healthy to precancer to cancer |
| Tissue | Disease Stage | Enriched GO biological Processes |
| Colorectum | AD |  |
| Colorectum | SER |  |
| Colorectum | MSS |  |
| Colorectum | MSI-H |  |
| Colorectum | FAP |  |
| ∗Top 15 enriched GO BP terms are showed in the bar plot of each disease state in each tissue. Each row represents a significant GO biological process which is colored according to the -log10(p.adjust). |
| Page: 1 2 3 4 5 6 7 8 9 |
| GO ID | Tissue | Disease Stage | Description | Gene Ratio | Bg Ratio | pvalue | p.adjust | Count |
| GO:0008380 | Colorectum | AD | RNA splicing | 169/3918 | 434/18723 | 3.59e-18 | 2.04e-15 | 169 |
| GO:0000377 | Colorectum | AD | RNA splicing, via transesterification reactions with bulged adenosine as nucleophile | 130/3918 | 320/18723 | 5.88e-16 | 2.16e-13 | 130 |
| GO:0000398 | Colorectum | AD | mRNA splicing, via spliceosome | 130/3918 | 320/18723 | 5.88e-16 | 2.16e-13 | 130 |
| GO:0000375 | Colorectum | AD | RNA splicing, via transesterification reactions | 131/3918 | 324/18723 | 7.11e-16 | 2.22e-13 | 131 |
| GO:0022618 | Colorectum | AD | ribonucleoprotein complex assembly | 92/3918 | 220/18723 | 1.49e-12 | 2.60e-10 | 92 |
| GO:0071826 | Colorectum | AD | ribonucleoprotein complex subunit organization | 94/3918 | 227/18723 | 1.70e-12 | 2.87e-10 | 94 |
| GO:0022613 | Colorectum | AD | ribonucleoprotein complex biogenesis | 151/3918 | 463/18723 | 1.96e-09 | 1.39e-07 | 151 |
| GO:0000380 | Colorectum | AD | alternative mRNA splicing, via spliceosome | 33/3918 | 77/18723 | 1.13e-05 | 2.55e-04 | 33 |
| GO:0060249 | Colorectum | AD | anatomical structure homeostasis | 94/3918 | 314/18723 | 9.37e-05 | 1.42e-03 | 94 |
| GO:0001894 | Colorectum | AD | tissue homeostasis | 81/3918 | 268/18723 | 1.96e-04 | 2.62e-03 | 81 |
| GO:0007178 | Colorectum | AD | transmembrane receptor protein serine/threonine kinase signaling pathway | 99/3918 | 355/18723 | 9.92e-04 | 9.28e-03 | 99 |
| GO:0071559 | Colorectum | AD | response to transforming growth factor beta | 74/3918 | 256/18723 | 1.45e-03 | 1.23e-02 | 74 |
| GO:0071560 | Colorectum | AD | cellular response to transforming growth factor beta stimulus | 72/3918 | 250/18723 | 1.85e-03 | 1.52e-02 | 72 |
| GO:0007179 | Colorectum | AD | transforming growth factor beta receptor signaling pathway | 59/3918 | 198/18723 | 1.94e-03 | 1.58e-02 | 59 |
| GO:0030277 | Colorectum | AD | maintenance of gastrointestinal epithelium | 10/3918 | 22/18723 | 8.52e-03 | 4.97e-02 | 10 |
| GO:00083802 | Colorectum | MSS | RNA splicing | 159/3467 | 434/18723 | 1.75e-19 | 1.22e-16 | 159 |
| GO:00003772 | Colorectum | MSS | RNA splicing, via transesterification reactions with bulged adenosine as nucleophile | 121/3467 | 320/18723 | 2.52e-16 | 8.27e-14 | 121 |
| GO:00003982 | Colorectum | MSS | mRNA splicing, via spliceosome | 121/3467 | 320/18723 | 2.52e-16 | 8.27e-14 | 121 |
| GO:00003752 | Colorectum | MSS | RNA splicing, via transesterification reactions | 122/3467 | 324/18723 | 2.75e-16 | 8.58e-14 | 122 |
| GO:00718262 | Colorectum | MSS | ribonucleoprotein complex subunit organization | 90/3467 | 227/18723 | 6.88e-14 | 1.78e-11 | 90 |
| Page: 1 2 3 4 5 6 7 8 9 10 11 12 13 |
| Pathway ID | Tissue | Disease Stage | Description | Gene Ratio | Bg Ratio | pvalue | p.adjust | qvalue | Count |
| Page: 1 |
Top |
Cell-cell communication analysis |
| Identification of potential cell-cell interactions between two cell types and their ligand-receptor pairs for different disease states |
| Ligand | Receptor | LRpair | Pathway | Tissue | Disease Stage |
| Page: 1 |
Top |
Single-cell gene regulatory network inference analysis |
| Find out the significant the regulons (TFs) and the target genes of each regulon across cell types for different disease states |
| TF | Cell Type | Tissue | Disease Stage | Target Gene | RSS | Regulon Activity |
| ∗The dot plots of a searched regulon are shown for all cell subpopulations in each disease state of each tissue based on the regulon specific score inferred using pySCENIC and by calculating the average expression. |
| Page: 1 |
Top |
Somatic mutation of malignant transformation related genes |
| Annotation of somatic variants for genes involved in malignant transformation |
| Hugo Symbol | Variant Class | Variant Classification | dbSNP RS | HGVSc | HGVSp | HGVSp Short | SWISSPROT | BIOTYPE | SIFT | PolyPhen | Tumor Sample Barcode | Tissue | Histology | Sex | Age | Stage | Therapy Types | Drugs | Outcome |
| STRAP | SNV | Missense_Mutation | c.996A>T | p.Glu332Asp | p.E332D | Q9Y3F4 | protein_coding | tolerated_low_confidence(0.35) | benign(0) | TCGA-BH-A18V-01 | Breast | breast invasive carcinoma | Female | <65 | I/II | Unknown | Unknown | SD | |
| STRAP | insertion | Nonsense_Mutation | novel | c.821_822insATCAAATGAAGTCTGTGAGGGATATTAGAGATAAAGGAGAT | p.Ser274ArgfsTer10 | p.S274Rfs*10 | Q9Y3F4 | protein_coding | TCGA-AN-A049-01 | Breast | breast invasive carcinoma | Female | <65 | I/II | Unknown | Unknown | SD | ||
| STRAP | SNV | Missense_Mutation | novel | c.397N>A | p.Glu133Lys | p.E133K | Q9Y3F4 | protein_coding | deleterious(0.04) | benign(0.164) | TCGA-C5-A1ME-01 | Cervix | cervical & endocervical cancer | Female | <65 | I/II | Unknown | Unknown | SD |
| STRAP | SNV | Missense_Mutation | rs185224819 | c.724N>A | p.Gly242Ser | p.G242S | Q9Y3F4 | protein_coding | tolerated(0.06) | benign(0.397) | TCGA-EA-A3HS-01 | Cervix | cervical & endocervical cancer | Female | <65 | I/II | Unknown | Unknown | SD |
| STRAP | SNV | Missense_Mutation | c.853N>C | p.Glu285Gln | p.E285Q | Q9Y3F4 | protein_coding | deleterious(0) | probably_damaging(1) | TCGA-IR-A3LK-01 | Cervix | cervical & endocervical cancer | Female | >=65 | I/II | Chemotherapy | cisplatin | PD | |
| STRAP | SNV | Missense_Mutation | c.130N>T | p.Arg44Cys | p.R44C | Q9Y3F4 | protein_coding | deleterious(0) | probably_damaging(1) | TCGA-AD-6895-01 | Colorectum | colon adenocarcinoma | Male | >=65 | III/IV | Unknown | Unknown | SD | |
| STRAP | SNV | Missense_Mutation | c.49G>A | p.Val17Met | p.V17M | Q9Y3F4 | protein_coding | deleterious(0) | probably_damaging(1) | TCGA-AZ-6599-01 | Colorectum | colon adenocarcinoma | Male | >=65 | I/II | Unknown | Unknown | SD | |
| STRAP | SNV | Missense_Mutation | novel | c.562N>C | p.Ser188Arg | p.S188R | Q9Y3F4 | protein_coding | deleterious(0) | possibly_damaging(0.83) | TCGA-CA-6717-01 | Colorectum | colon adenocarcinoma | Male | <65 | I/II | Chemotherapy | oxaliplatin | CR |
| STRAP | SNV | Missense_Mutation | novel | c.910N>G | p.Lys304Glu | p.K304E | Q9Y3F4 | protein_coding | deleterious(0.01) | possibly_damaging(0.51) | TCGA-CA-6717-01 | Colorectum | colon adenocarcinoma | Male | <65 | I/II | Chemotherapy | oxaliplatin | CR |
| STRAP | SNV | Missense_Mutation | rs752651730 | c.374G>A | p.Arg125His | p.R125H | Q9Y3F4 | protein_coding | deleterious(0.03) | benign(0.303) | TCGA-AG-A02N-01 | Colorectum | rectum adenocarcinoma | Male | >=65 | I/II | Chemotherapy | folinic | CR |
| Page: 1 2 3 4 |
Top |
Related drugs of malignant transformation related genes |
| Identification of chemicals and drugs interact with genes involved in malignant transfromation |
| (DGIdb 4.0) |
| Entrez ID | Symbol | Category | Interaction Types | Drug Claim Name | Drug Name | PMIDs |
| 11171 | STRAP | KINASE | ADJUVANT | 15720808 |
| Page: 1 |

Copyright 2023-Present -The University of Texas Health Science Center at Houston |