
|
|||||
|
 | |
| |
| |
| |
| |
| |
|
Gene: STRADB |
Gene summary for STRADB |
| Gene information | Species | Human | Gene symbol | STRADB | Gene ID | 55437 |
| Gene name | STE20 related adaptor beta | |
| Gene Alias | ALS2CR2 | |
| Cytomap | 2q33.1 | |
| Gene Type | protein-coding | GO ID | GO:0000165 | UniProtAcc | Q9C0K7 |
Top |
Malignant transformation analysis |
| Identification of the aberrant gene expression in precancerous and cancerous lesions by comparing the gene expression of stem-like cells in diseased tissues with normal stem cells |
| Entrez ID | Symbol | Replicates | Species | Organ | Tissue | Adj P-value | Log2FC | Malignancy |
| 55437 | STRADB | LZE24T | Human | Esophagus | ESCC | 5.64e-08 | 2.63e-01 | 0.0596 |
| 55437 | STRADB | P1T-E | Human | Esophagus | ESCC | 1.95e-03 | 1.43e-01 | 0.0875 |
| 55437 | STRADB | P2T-E | Human | Esophagus | ESCC | 1.68e-06 | 1.13e-01 | 0.1177 |
| 55437 | STRADB | P4T-E | Human | Esophagus | ESCC | 1.83e-12 | 3.33e-01 | 0.1323 |
| 55437 | STRADB | P8T-E | Human | Esophagus | ESCC | 1.15e-07 | 1.59e-01 | 0.0889 |
| 55437 | STRADB | P10T-E | Human | Esophagus | ESCC | 2.00e-07 | 5.11e-02 | 0.116 |
| 55437 | STRADB | P11T-E | Human | Esophagus | ESCC | 1.66e-07 | 3.34e-01 | 0.1426 |
| 55437 | STRADB | P12T-E | Human | Esophagus | ESCC | 1.03e-16 | 2.65e-01 | 0.1122 |
| 55437 | STRADB | P15T-E | Human | Esophagus | ESCC | 4.06e-03 | 7.53e-02 | 0.1149 |
| 55437 | STRADB | P20T-E | Human | Esophagus | ESCC | 2.51e-07 | 1.30e-01 | 0.1124 |
| 55437 | STRADB | P22T-E | Human | Esophagus | ESCC | 1.56e-13 | 1.72e-01 | 0.1236 |
| 55437 | STRADB | P23T-E | Human | Esophagus | ESCC | 7.95e-13 | 2.28e-01 | 0.108 |
| 55437 | STRADB | P24T-E | Human | Esophagus | ESCC | 8.37e-11 | 1.37e-01 | 0.1287 |
| 55437 | STRADB | P26T-E | Human | Esophagus | ESCC | 1.06e-06 | 1.52e-01 | 0.1276 |
| 55437 | STRADB | P27T-E | Human | Esophagus | ESCC | 7.56e-13 | 1.02e-01 | 0.1055 |
| 55437 | STRADB | P28T-E | Human | Esophagus | ESCC | 3.56e-04 | 1.10e-01 | 0.1149 |
| 55437 | STRADB | P30T-E | Human | Esophagus | ESCC | 4.53e-14 | 4.08e-01 | 0.137 |
| 55437 | STRADB | P32T-E | Human | Esophagus | ESCC | 5.72e-10 | 1.98e-01 | 0.1666 |
| 55437 | STRADB | P36T-E | Human | Esophagus | ESCC | 1.53e-06 | 1.95e-01 | 0.1187 |
| 55437 | STRADB | P37T-E | Human | Esophagus | ESCC | 2.25e-13 | 9.73e-02 | 0.1371 |
| Page: 1 2 3 4 |
| Tissue | Expression Dynamics | Abbreviation |
| Esophagus | 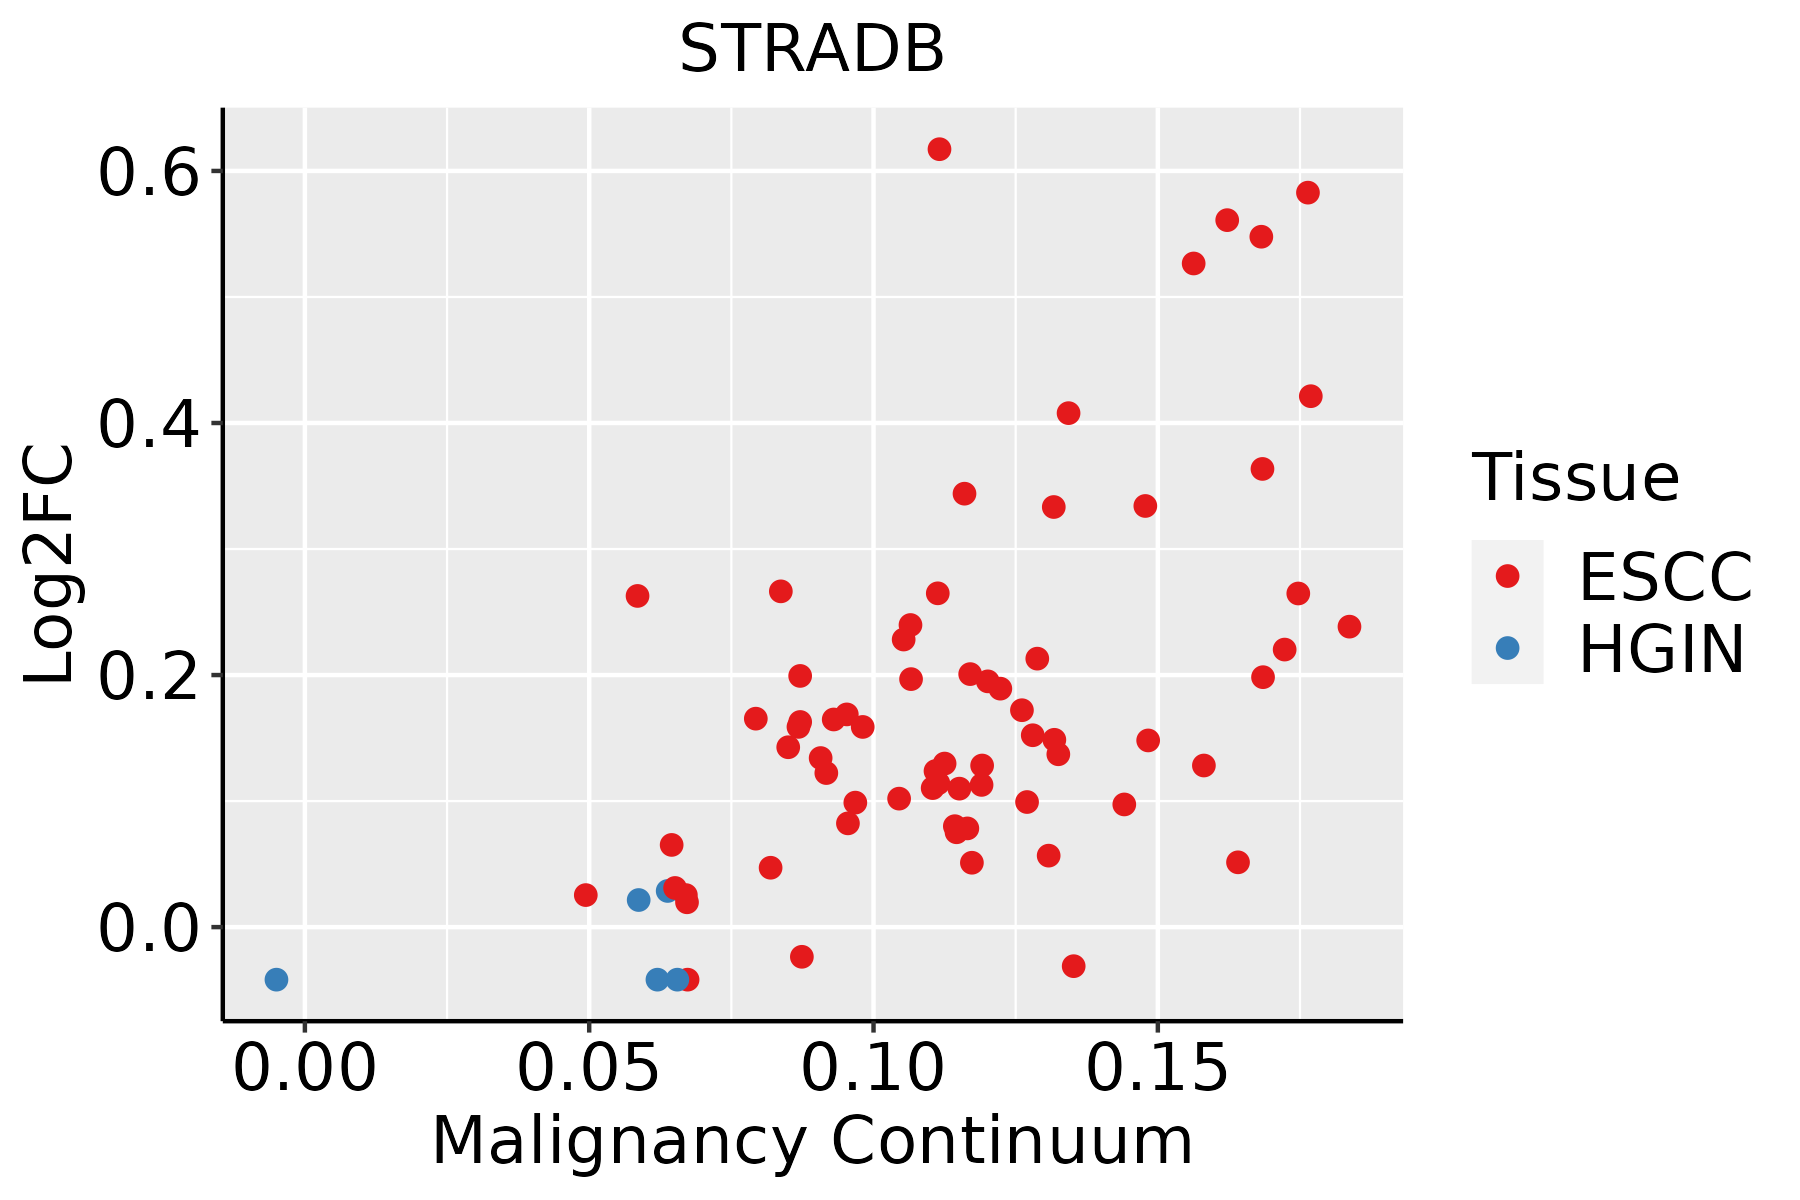 | ESCC: Esophageal squamous cell carcinoma |
| HGIN: High-grade intraepithelial neoplasias | ||
| LGIN: Low-grade intraepithelial neoplasias | ||
| Liver | 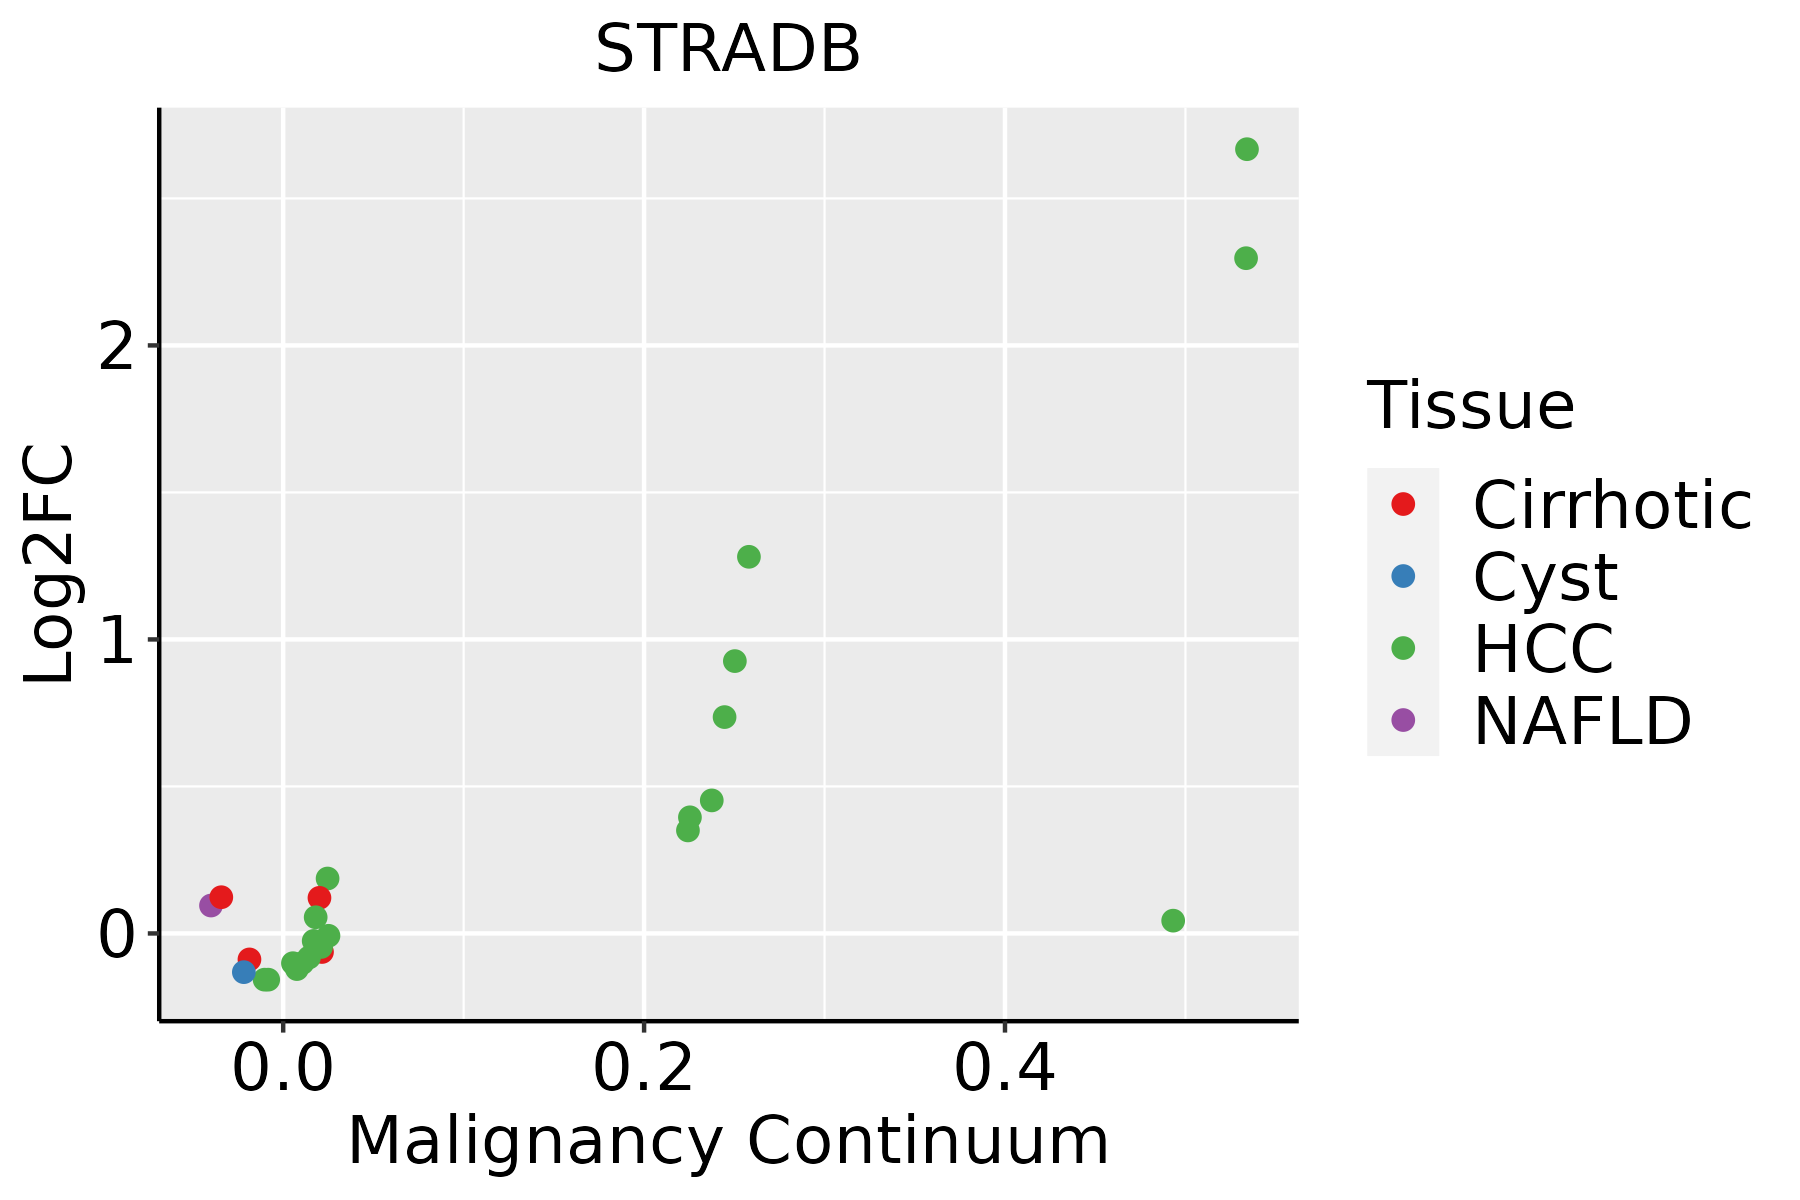 | HCC: Hepatocellular carcinoma |
| NAFLD: Non-alcoholic fatty liver disease | ||
| Thyroid | 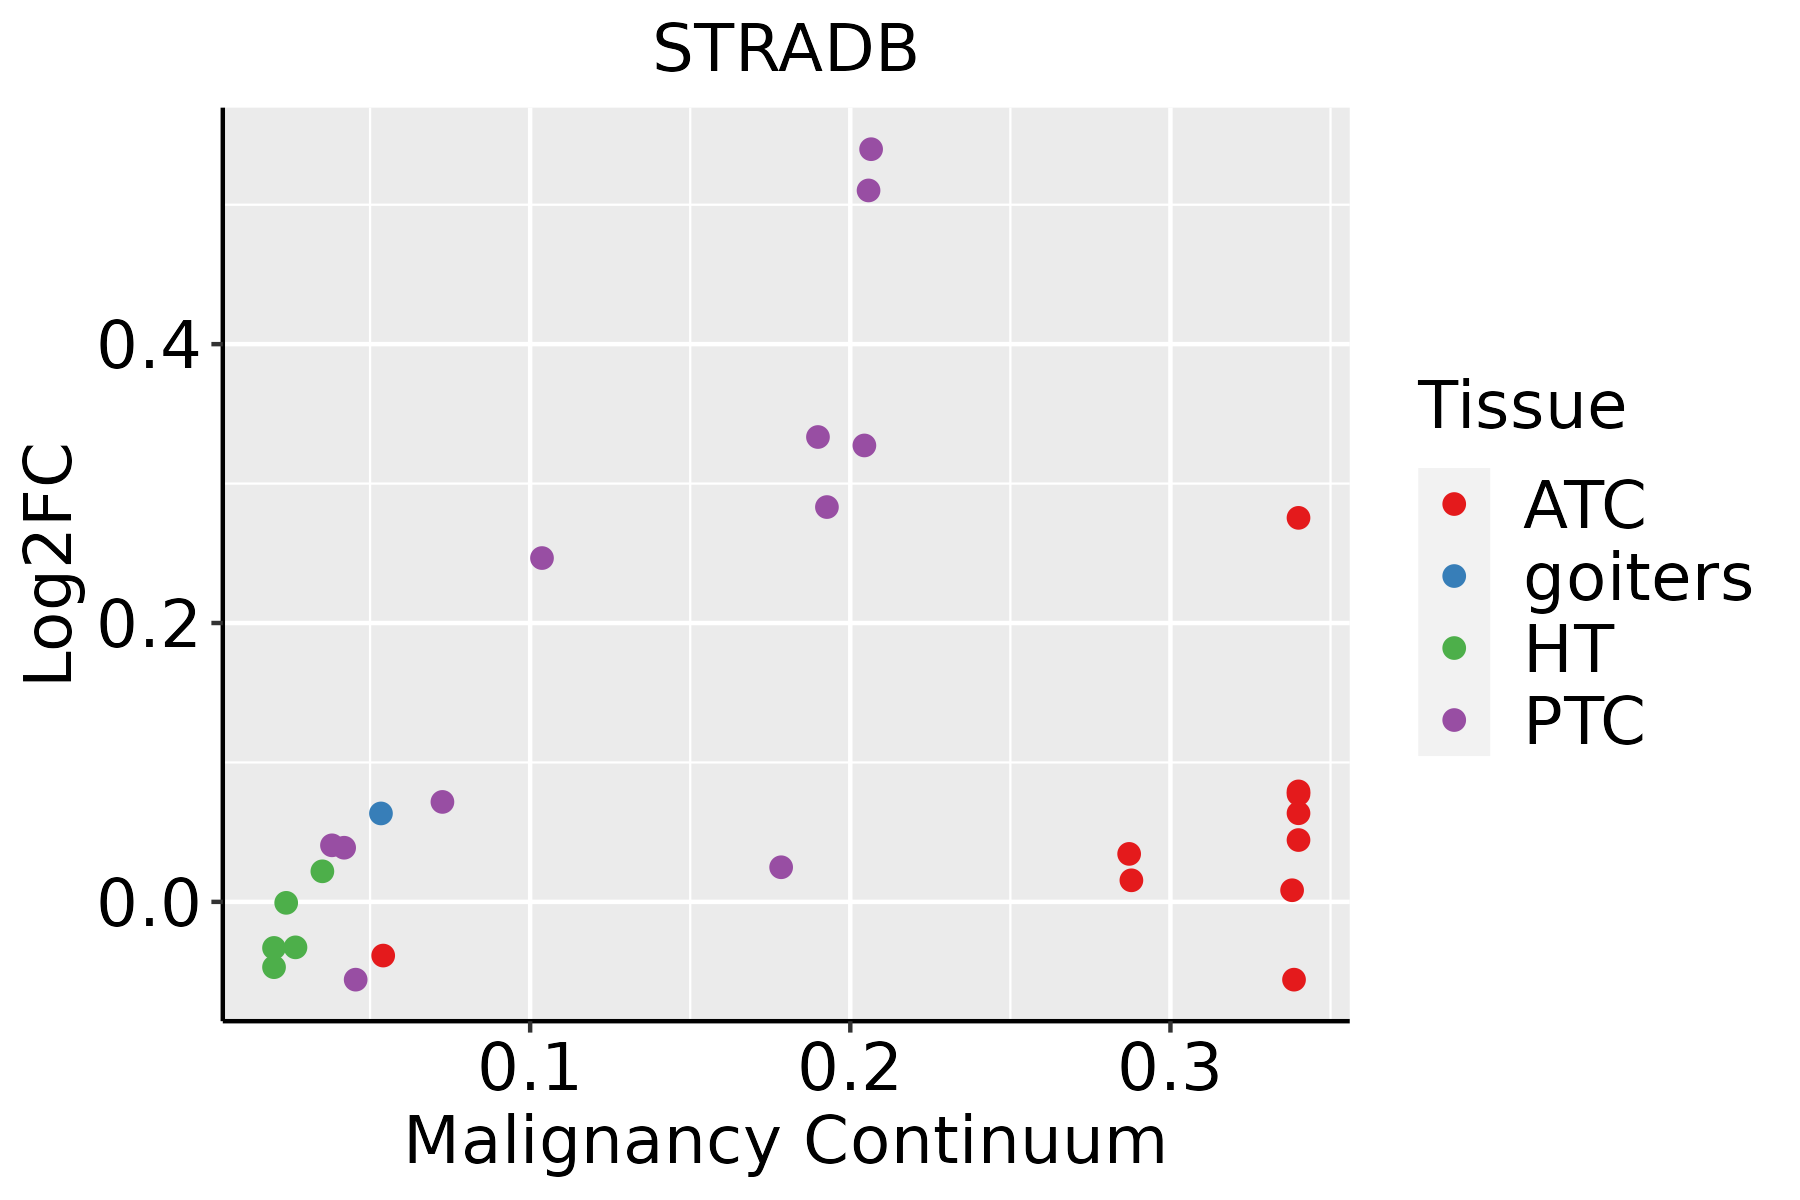 | ATC: Anaplastic thyroid cancer |
| HT: Hashimoto's thyroiditis | ||
| PTC: Papillary thyroid cancer |
| ∗log2FC in expression of this searched gene in stem-like cells from each diseased tissue sample relative to stem-like cells in normal samples in each tissue plotted against the malignancy continuum. Samples are colored based on if they are from different disease stage. |
Top |
Malignant transformation related pathway analysis |
| Find out the enriched GO biological processes and KEGG pathways involved in transition from healthy to precancer to cancer |
| Tissue | Disease Stage | Enriched GO biological Processes |
| Colorectum | AD |  |
| Colorectum | SER |  |
| Colorectum | MSS |  |
| Colorectum | MSI-H |  |
| Colorectum | FAP |  |
| ∗Top 15 enriched GO BP terms are showed in the bar plot of each disease state in each tissue. Each row represents a significant GO biological process which is colored according to the -log10(p.adjust). |
| Page: 1 2 3 4 5 6 7 8 9 |
| GO ID | Tissue | Disease Stage | Description | Gene Ratio | Bg Ratio | pvalue | p.adjust | Count |
| GO:0006913110 | Esophagus | ESCC | nucleocytoplasmic transport | 230/8552 | 301/18723 | 6.04e-28 | 2.02e-25 | 230 |
| GO:0051169110 | Esophagus | ESCC | nuclear transport | 230/8552 | 301/18723 | 6.04e-28 | 2.02e-25 | 230 |
| GO:2001233111 | Esophagus | ESCC | regulation of apoptotic signaling pathway | 256/8552 | 356/18723 | 4.11e-24 | 1.04e-21 | 256 |
| GO:0051168110 | Esophagus | ESCC | nuclear export | 126/8552 | 154/18723 | 1.88e-20 | 2.65e-18 | 126 |
| GO:0097191111 | Esophagus | ESCC | extrinsic apoptotic signaling pathway | 159/8552 | 219/18723 | 4.12e-16 | 2.94e-14 | 159 |
| GO:2001234111 | Esophagus | ESCC | negative regulation of apoptotic signaling pathway | 161/8552 | 224/18723 | 1.24e-15 | 8.09e-14 | 161 |
| GO:2001236111 | Esophagus | ESCC | regulation of extrinsic apoptotic signaling pathway | 111/8552 | 151/18723 | 2.97e-12 | 1.18e-10 | 111 |
| GO:000661117 | Esophagus | ESCC | protein export from nucleus | 48/8552 | 57/18723 | 1.92e-09 | 4.39e-08 | 48 |
| GO:003109818 | Esophagus | ESCC | stress-activated protein kinase signaling cascade | 154/8552 | 247/18723 | 8.53e-08 | 1.44e-06 | 154 |
| GO:2001237111 | Esophagus | ESCC | negative regulation of extrinsic apoptotic signaling pathway | 69/8552 | 97/18723 | 3.23e-07 | 4.55e-06 | 69 |
| GO:005140318 | Esophagus | ESCC | stress-activated MAPK cascade | 147/8552 | 239/18723 | 5.43e-07 | 7.18e-06 | 147 |
| GO:00380347 | Esophagus | ESCC | signal transduction in absence of ligand | 48/8552 | 65/18723 | 3.63e-06 | 3.97e-05 | 48 |
| GO:00971927 | Esophagus | ESCC | extrinsic apoptotic signaling pathway in absence of ligand | 48/8552 | 65/18723 | 3.63e-06 | 3.97e-05 | 48 |
| GO:004586018 | Esophagus | ESCC | positive regulation of protein kinase activity | 219/8552 | 386/18723 | 6.91e-06 | 6.97e-05 | 219 |
| GO:003367420 | Esophagus | ESCC | positive regulation of kinase activity | 260/8552 | 467/18723 | 7.26e-06 | 7.22e-05 | 260 |
| GO:00072549 | Esophagus | ESCC | JNK cascade | 102/8552 | 167/18723 | 4.22e-05 | 3.39e-04 | 102 |
| GO:20012394 | Esophagus | ESCC | regulation of extrinsic apoptotic signaling pathway in absence of ligand | 30/8552 | 43/18723 | 1.21e-03 | 5.88e-03 | 30 |
| GO:19010992 | Esophagus | ESCC | negative regulation of signal transduction in absence of ligand | 23/8552 | 33/18723 | 4.57e-03 | 1.78e-02 | 23 |
| GO:20012402 | Esophagus | ESCC | negative regulation of extrinsic apoptotic signaling pathway in absence of ligand | 23/8552 | 33/18723 | 4.57e-03 | 1.78e-02 | 23 |
| GO:000691322 | Liver | HCC | nucleocytoplasmic transport | 208/7958 | 301/18723 | 5.51e-21 | 8.12e-19 | 208 |
| Page: 1 2 3 4 |
| Pathway ID | Tissue | Disease Stage | Description | Gene Ratio | Bg Ratio | pvalue | p.adjust | qvalue | Count |
| hsa0415210 | Esophagus | ESCC | AMPK signaling pathway | 80/4205 | 121/8465 | 1.73e-04 | 6.67e-04 | 3.42e-04 | 80 |
| hsa041505 | Esophagus | ESCC | mTOR signaling pathway | 98/4205 | 156/8465 | 5.81e-04 | 1.95e-03 | 9.97e-04 | 98 |
| hsa0415213 | Esophagus | ESCC | AMPK signaling pathway | 80/4205 | 121/8465 | 1.73e-04 | 6.67e-04 | 3.42e-04 | 80 |
| hsa0415013 | Esophagus | ESCC | mTOR signaling pathway | 98/4205 | 156/8465 | 5.81e-04 | 1.95e-03 | 9.97e-04 | 98 |
| hsa0415241 | Liver | HCC | AMPK signaling pathway | 77/4020 | 121/8465 | 2.32e-04 | 1.11e-03 | 6.18e-04 | 77 |
| hsa041502 | Liver | HCC | mTOR signaling pathway | 95/4020 | 156/8465 | 4.70e-04 | 1.99e-03 | 1.11e-03 | 95 |
| hsa0415251 | Liver | HCC | AMPK signaling pathway | 77/4020 | 121/8465 | 2.32e-04 | 1.11e-03 | 6.18e-04 | 77 |
| hsa0415011 | Liver | HCC | mTOR signaling pathway | 95/4020 | 156/8465 | 4.70e-04 | 1.99e-03 | 1.11e-03 | 95 |
| Page: 1 |
Top |
Cell-cell communication analysis |
| Identification of potential cell-cell interactions between two cell types and their ligand-receptor pairs for different disease states |
| Ligand | Receptor | LRpair | Pathway | Tissue | Disease Stage |
| Page: 1 |
Top |
Single-cell gene regulatory network inference analysis |
| Find out the significant the regulons (TFs) and the target genes of each regulon across cell types for different disease states |
| TF | Cell Type | Tissue | Disease Stage | Target Gene | RSS | Regulon Activity |
| ∗The dot plots of a searched regulon are shown for all cell subpopulations in each disease state of each tissue based on the regulon specific score inferred using pySCENIC and by calculating the average expression. |
| Page: 1 |
Top |
Somatic mutation of malignant transformation related genes |
| Annotation of somatic variants for genes involved in malignant transformation |
| Hugo Symbol | Variant Class | Variant Classification | dbSNP RS | HGVSc | HGVSp | HGVSp Short | SWISSPROT | BIOTYPE | SIFT | PolyPhen | Tumor Sample Barcode | Tissue | Histology | Sex | Age | Stage | Therapy Types | Drugs | Outcome |
| STRADB | SNV | Missense_Mutation | novel | c.544C>T | p.His182Tyr | p.H182Y | Q9C0K7 | protein_coding | deleterious(0) | probably_damaging(0.982) | TCGA-AC-A62V-01 | Breast | breast invasive carcinoma | Male | <65 | III/IV | Targeted Molecular therapy | denosumab | PD |
| STRADB | SNV | Missense_Mutation | c.1225N>G | p.Pro409Ala | p.P409A | Q9C0K7 | protein_coding | tolerated(0.2) | benign(0) | TCGA-D8-A1J8-01 | Breast | breast invasive carcinoma | Female | >=65 | I/II | Hormone Therapy | nolvadex | SD | |
| STRADB | SNV | Missense_Mutation | novel | c.1123N>C | p.Glu375Gln | p.E375Q | Q9C0K7 | protein_coding | tolerated(0.68) | benign(0) | TCGA-JW-A5VL-01 | Cervix | cervical & endocervical cancer | Female | <65 | I/II | Unknown | Unknown | SD |
| STRADB | SNV | Missense_Mutation | c.659N>G | p.Tyr220Cys | p.Y220C | Q9C0K7 | protein_coding | deleterious(0.01) | possibly_damaging(0.776) | TCGA-AA-3492-01 | Colorectum | colon adenocarcinoma | Female | >=65 | I/II | Unknown | Unknown | SD | |
| STRADB | SNV | Missense_Mutation | c.658T>C | p.Tyr220His | p.Y220H | Q9C0K7 | protein_coding | tolerated(0.93) | possibly_damaging(0.635) | TCGA-AD-6964-01 | Colorectum | colon adenocarcinoma | Male | <65 | III/IV | Chemotherapy | folfox | PD | |
| STRADB | SNV | Missense_Mutation | novel | c.1219N>T | p.Asp407Tyr | p.D407Y | Q9C0K7 | protein_coding | tolerated(0.08) | benign(0.037) | TCGA-CA-6717-01 | Colorectum | colon adenocarcinoma | Male | <65 | I/II | Chemotherapy | oxaliplatin | CR |
| STRADB | SNV | Missense_Mutation | novel | c.1065N>T | p.Glu355Asp | p.E355D | Q9C0K7 | protein_coding | tolerated(0.3) | possibly_damaging(0.859) | TCGA-AG-A002-01 | Colorectum | rectum adenocarcinoma | Male | <65 | I/II | Unknown | Unknown | SD |
| STRADB | SNV | Missense_Mutation | c.251N>T | p.Thr84Ile | p.T84I | Q9C0K7 | protein_coding | tolerated(0.07) | benign(0.238) | TCGA-AG-A01W-01 | Colorectum | rectum adenocarcinoma | Female | >=65 | I/II | Chemotherapy | 5-fluorouracil | CR | |
| STRADB | SNV | Missense_Mutation | novel | c.166N>A | p.Ser56Thr | p.S56T | Q9C0K7 | protein_coding | deleterious(0.01) | benign(0.001) | TCGA-EF-5831-01 | Colorectum | rectum adenocarcinoma | Male | >=65 | I/II | Unknown | Unknown | SD |
| STRADB | SNV | Missense_Mutation | novel | c.1019N>A | p.Pro340His | p.P340H | Q9C0K7 | protein_coding | tolerated(0.05) | probably_damaging(0.921) | TCGA-A5-A0G2-01 | Endometrium | uterine corpus endometrioid carcinoma | Female | <65 | III/IV | Unknown | Unknown | SD |
| Page: 1 2 3 4 |
Top |
Related drugs of malignant transformation related genes |
| Identification of chemicals and drugs interact with genes involved in malignant transfromation |
| (DGIdb 4.0) |
| Entrez ID | Symbol | Category | Interaction Types | Drug Claim Name | Drug Name | PMIDs |
| Page: 1 |

Copyright 2023-Present -The University of Texas Health Science Center at Houston |