
|
|||||
|
 | |
| |
| |
| |
| |
| |
|
Gene: STRADA |
Gene summary for STRADA |
| Gene information | Species | Human | Gene symbol | STRADA | Gene ID | 92335 |
| Gene name | STE20 related adaptor alpha | |
| Gene Alias | LYK5 | |
| Cytomap | 17q23.3 | |
| Gene Type | protein-coding | GO ID | GO:0001932 | UniProtAcc | Q7RTN6 |
Top |
Malignant transformation analysis |
| Identification of the aberrant gene expression in precancerous and cancerous lesions by comparing the gene expression of stem-like cells in diseased tissues with normal stem cells |
| Entrez ID | Symbol | Replicates | Species | Organ | Tissue | Adj P-value | Log2FC | Malignancy |
| 92335 | STRADA | LZE4T | Human | Esophagus | ESCC | 1.70e-03 | 1.49e-01 | 0.0811 |
| 92335 | STRADA | LZE7T | Human | Esophagus | ESCC | 2.07e-15 | 5.61e-01 | 0.0667 |
| 92335 | STRADA | LZE8T | Human | Esophagus | ESCC | 9.77e-06 | 1.76e-01 | 0.067 |
| 92335 | STRADA | LZE24T | Human | Esophagus | ESCC | 1.68e-09 | 2.63e-01 | 0.0596 |
| 92335 | STRADA | LZE21T | Human | Esophagus | ESCC | 6.52e-03 | 2.74e-01 | 0.0655 |
| 92335 | STRADA | P1T-E | Human | Esophagus | ESCC | 2.65e-12 | 4.12e-01 | 0.0875 |
| 92335 | STRADA | P2T-E | Human | Esophagus | ESCC | 2.06e-08 | 1.80e-01 | 0.1177 |
| 92335 | STRADA | P4T-E | Human | Esophagus | ESCC | 1.36e-04 | 1.26e-01 | 0.1323 |
| 92335 | STRADA | P8T-E | Human | Esophagus | ESCC | 2.06e-08 | 1.65e-01 | 0.0889 |
| 92335 | STRADA | P9T-E | Human | Esophagus | ESCC | 1.11e-03 | 1.39e-01 | 0.1131 |
| 92335 | STRADA | P10T-E | Human | Esophagus | ESCC | 1.88e-11 | 2.19e-01 | 0.116 |
| 92335 | STRADA | P11T-E | Human | Esophagus | ESCC | 4.50e-19 | 5.24e-01 | 0.1426 |
| 92335 | STRADA | P12T-E | Human | Esophagus | ESCC | 4.40e-09 | 1.85e-01 | 0.1122 |
| 92335 | STRADA | P15T-E | Human | Esophagus | ESCC | 5.19e-07 | 1.83e-01 | 0.1149 |
| 92335 | STRADA | P16T-E | Human | Esophagus | ESCC | 3.89e-12 | 2.69e-01 | 0.1153 |
| 92335 | STRADA | P17T-E | Human | Esophagus | ESCC | 2.68e-03 | 1.71e-01 | 0.1278 |
| 92335 | STRADA | P20T-E | Human | Esophagus | ESCC | 4.83e-12 | 2.53e-01 | 0.1124 |
| 92335 | STRADA | P21T-E | Human | Esophagus | ESCC | 8.56e-12 | 2.32e-01 | 0.1617 |
| 92335 | STRADA | P22T-E | Human | Esophagus | ESCC | 9.20e-06 | 1.42e-01 | 0.1236 |
| 92335 | STRADA | P23T-E | Human | Esophagus | ESCC | 2.27e-24 | 4.94e-01 | 0.108 |
| Page: 1 2 3 4 |
| Tissue | Expression Dynamics | Abbreviation |
| Esophagus |  | ESCC: Esophageal squamous cell carcinoma |
| HGIN: High-grade intraepithelial neoplasias | ||
| LGIN: Low-grade intraepithelial neoplasias | ||
| Lung | 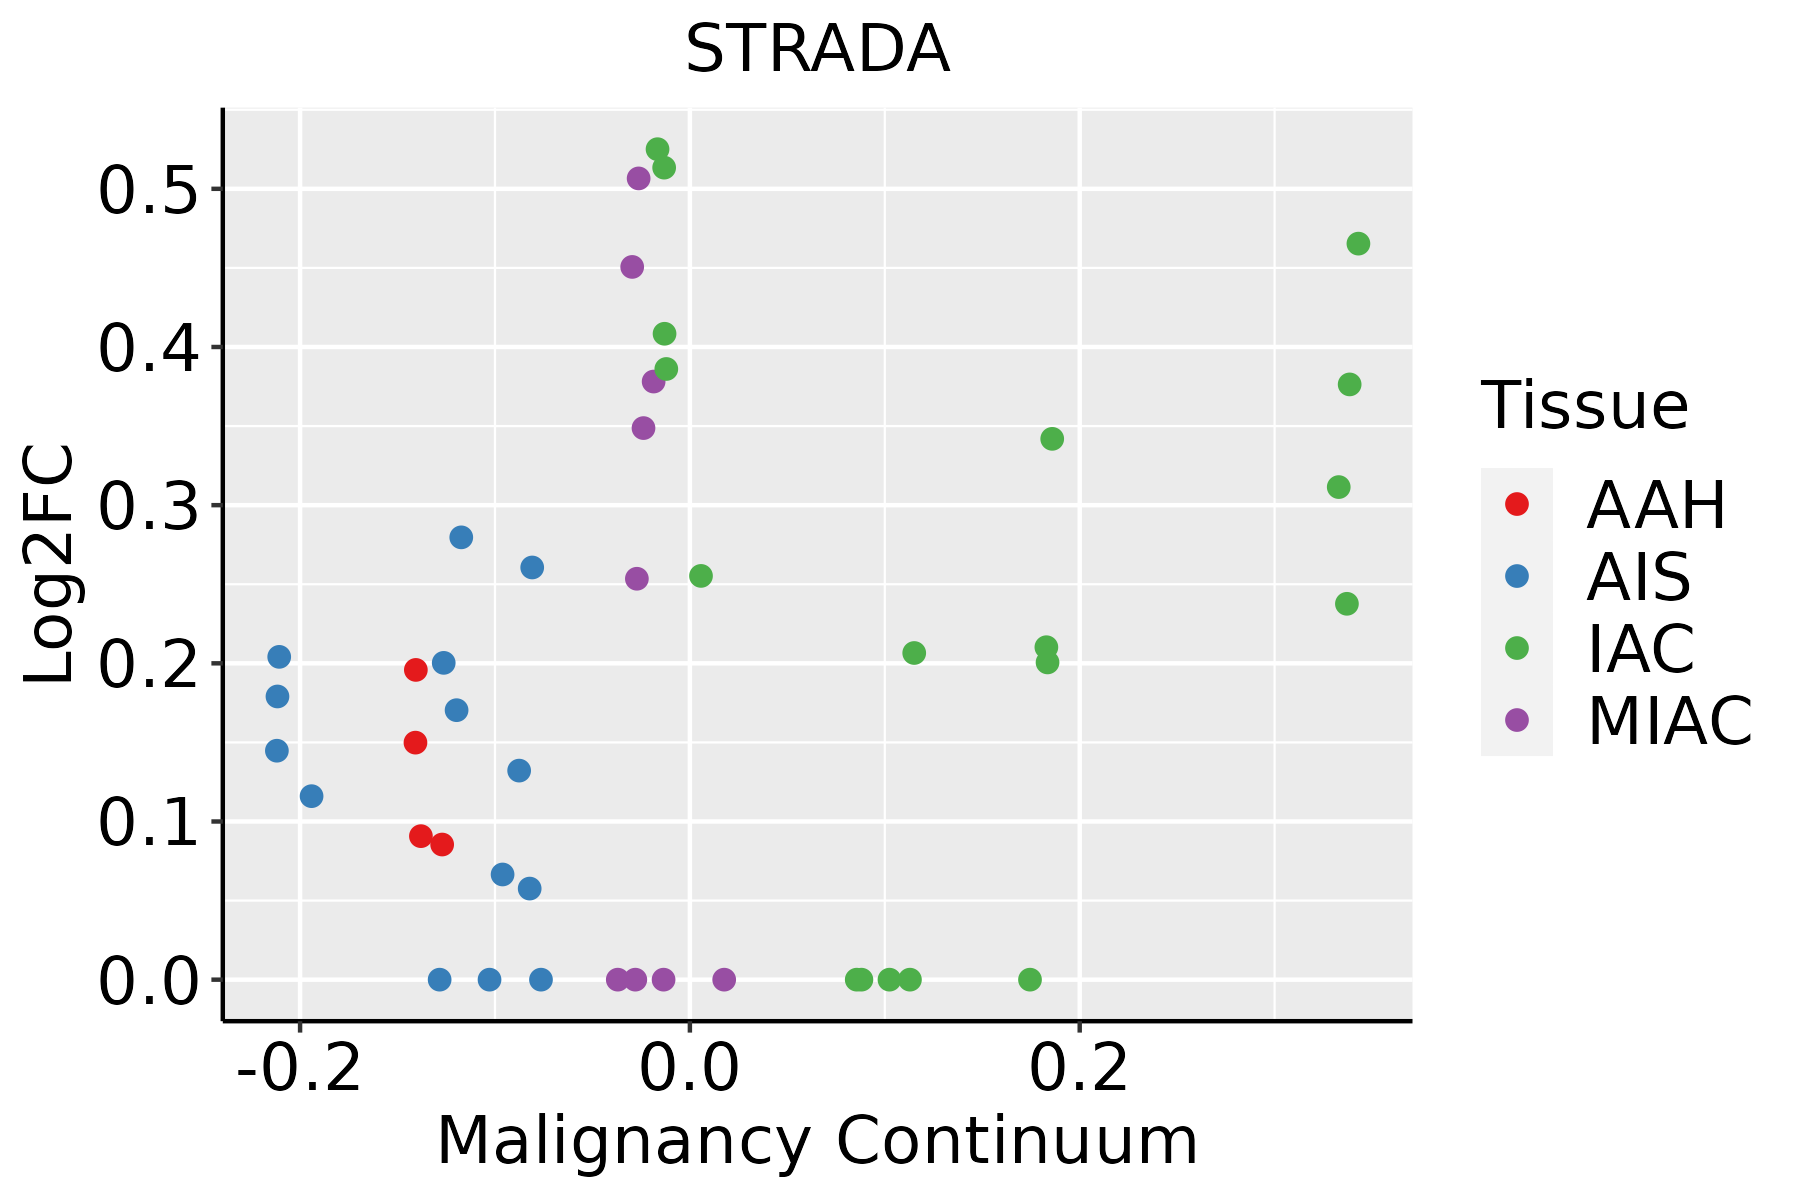 | AAH: Atypical adenomatous hyperplasia |
| AIS: Adenocarcinoma in situ | ||
| IAC: Invasive lung adenocarcinoma | ||
| MIA: Minimally invasive adenocarcinoma |
| ∗log2FC in expression of this searched gene in stem-like cells from each diseased tissue sample relative to stem-like cells in normal samples in each tissue plotted against the malignancy continuum. Samples are colored based on if they are from different disease stage. |
Top |
Malignant transformation related pathway analysis |
| Find out the enriched GO biological processes and KEGG pathways involved in transition from healthy to precancer to cancer |
| Tissue | Disease Stage | Enriched GO biological Processes |
| Colorectum | AD |  |
| Colorectum | SER |  |
| Colorectum | MSS |  |
| Colorectum | MSI-H |  |
| Colorectum | FAP |  |
| ∗Top 15 enriched GO BP terms are showed in the bar plot of each disease state in each tissue. Each row represents a significant GO biological process which is colored according to the -log10(p.adjust). |
| Page: 1 2 3 4 5 6 7 8 9 |
| GO ID | Tissue | Disease Stage | Description | Gene Ratio | Bg Ratio | pvalue | p.adjust | Count |
| GO:0006913110 | Esophagus | ESCC | nucleocytoplasmic transport | 230/8552 | 301/18723 | 6.04e-28 | 2.02e-25 | 230 |
| GO:0051169110 | Esophagus | ESCC | nuclear transport | 230/8552 | 301/18723 | 6.04e-28 | 2.02e-25 | 230 |
| GO:0051168110 | Esophagus | ESCC | nuclear export | 126/8552 | 154/18723 | 1.88e-20 | 2.65e-18 | 126 |
| GO:007190016 | Esophagus | ESCC | regulation of protein serine/threonine kinase activity | 227/8552 | 359/18723 | 1.12e-11 | 4.10e-10 | 227 |
| GO:000661117 | Esophagus | ESCC | protein export from nucleus | 48/8552 | 57/18723 | 1.92e-09 | 4.39e-08 | 48 |
| GO:00719029 | Esophagus | ESCC | positive regulation of protein serine/threonine kinase activity | 124/8552 | 200/18723 | 2.27e-06 | 2.61e-05 | 124 |
| GO:004586018 | Esophagus | ESCC | positive regulation of protein kinase activity | 219/8552 | 386/18723 | 6.91e-06 | 6.97e-05 | 219 |
| GO:003367420 | Esophagus | ESCC | positive regulation of kinase activity | 260/8552 | 467/18723 | 7.26e-06 | 7.22e-05 | 260 |
| GO:00069138 | Lung | IAC | nucleocytoplasmic transport | 63/2061 | 301/18723 | 3.50e-07 | 2.54e-05 | 63 |
| GO:00511698 | Lung | IAC | nuclear transport | 63/2061 | 301/18723 | 3.50e-07 | 2.54e-05 | 63 |
| GO:00719006 | Lung | IAC | regulation of protein serine/threonine kinase activity | 71/2061 | 359/18723 | 6.33e-07 | 3.72e-05 | 71 |
| GO:00511688 | Lung | IAC | nuclear export | 38/2061 | 154/18723 | 1.24e-06 | 6.45e-05 | 38 |
| GO:00458607 | Lung | IAC | positive regulation of protein kinase activity | 72/2061 | 386/18723 | 4.89e-06 | 1.96e-04 | 72 |
| GO:00719024 | Lung | IAC | positive regulation of protein serine/threonine kinase activity | 44/2061 | 200/18723 | 5.16e-06 | 2.04e-04 | 44 |
| GO:00336748 | Lung | IAC | positive regulation of kinase activity | 83/2061 | 467/18723 | 6.76e-06 | 2.45e-04 | 83 |
| GO:00066115 | Lung | IAC | protein export from nucleus | 14/2061 | 57/18723 | 2.93e-03 | 2.61e-02 | 14 |
| GO:005116823 | Lung | MIAC | nuclear export | 18/967 | 154/18723 | 1.01e-03 | 2.07e-02 | 18 |
| GO:003367431 | Lung | MIAC | positive regulation of kinase activity | 40/967 | 467/18723 | 1.22e-03 | 2.31e-02 | 40 |
| GO:000661122 | Lung | MIAC | protein export from nucleus | 9/967 | 57/18723 | 2.43e-03 | 3.56e-02 | 9 |
| GO:004586022 | Lung | MIAC | positive regulation of protein kinase activity | 33/967 | 386/18723 | 3.24e-03 | 4.27e-02 | 33 |
| Page: 1 2 |
| Pathway ID | Tissue | Disease Stage | Description | Gene Ratio | Bg Ratio | pvalue | p.adjust | qvalue | Count |
| hsa0415210 | Esophagus | ESCC | AMPK signaling pathway | 80/4205 | 121/8465 | 1.73e-04 | 6.67e-04 | 3.42e-04 | 80 |
| hsa041505 | Esophagus | ESCC | mTOR signaling pathway | 98/4205 | 156/8465 | 5.81e-04 | 1.95e-03 | 9.97e-04 | 98 |
| hsa0415213 | Esophagus | ESCC | AMPK signaling pathway | 80/4205 | 121/8465 | 1.73e-04 | 6.67e-04 | 3.42e-04 | 80 |
| hsa0415013 | Esophagus | ESCC | mTOR signaling pathway | 98/4205 | 156/8465 | 5.81e-04 | 1.95e-03 | 9.97e-04 | 98 |
| Page: 1 |
Top |
Cell-cell communication analysis |
| Identification of potential cell-cell interactions between two cell types and their ligand-receptor pairs for different disease states |
| Ligand | Receptor | LRpair | Pathway | Tissue | Disease Stage |
| Page: 1 |
Top |
Single-cell gene regulatory network inference analysis |
| Find out the significant the regulons (TFs) and the target genes of each regulon across cell types for different disease states |
| TF | Cell Type | Tissue | Disease Stage | Target Gene | RSS | Regulon Activity |
| ∗The dot plots of a searched regulon are shown for all cell subpopulations in each disease state of each tissue based on the regulon specific score inferred using pySCENIC and by calculating the average expression. |
| Page: 1 |
Top |
Somatic mutation of malignant transformation related genes |
| Annotation of somatic variants for genes involved in malignant transformation |
| Hugo Symbol | Variant Class | Variant Classification | dbSNP RS | HGVSc | HGVSp | HGVSp Short | SWISSPROT | BIOTYPE | SIFT | PolyPhen | Tumor Sample Barcode | Tissue | Histology | Sex | Age | Stage | Therapy Types | Drugs | Outcome |
| STRADA | SNV | Missense_Mutation | novel | c.1012N>T | p.Asp338Tyr | p.D338Y | Q7RTN6 | protein_coding | deleterious(0) | possibly_damaging(0.652) | TCGA-A2-A04P-01 | Breast | breast invasive carcinoma | Female | <65 | III/IV | Chemotherapy | taxol | PD |
| STRADA | SNV | Missense_Mutation | c.497N>A | p.Gly166Asp | p.G166D | Q7RTN6 | protein_coding | deleterious(0) | probably_damaging(1) | TCGA-A8-A07R-01 | Breast | breast invasive carcinoma | Female | >=65 | III/IV | Ancillary | zoledronic | SD | |
| STRADA | SNV | Missense_Mutation | novel | c.676N>G | p.Arg226Gly | p.R226G | Q7RTN6 | protein_coding | deleterious(0.01) | probably_damaging(0.98) | TCGA-BH-A2L8-01 | Breast | breast invasive carcinoma | Female | <65 | I/II | Chemotherapy | cytoxan | CR |
| STRADA | SNV | Missense_Mutation | c.388N>G | p.Ile130Val | p.I130V | Q7RTN6 | protein_coding | tolerated(0.12) | benign(0.116) | TCGA-E9-A228-01 | Breast | breast invasive carcinoma | Female | <65 | I/II | Chemotherapy | doxorubicin | SD | |
| STRADA | insertion | Frame_Shift_Ins | novel | c.143_144insCCCCA | p.Glu48AspfsTer5 | p.E48Dfs*5 | Q7RTN6 | protein_coding | TCGA-A8-A06X-01 | Breast | breast invasive carcinoma | Female | >=65 | I/II | Unknown | Unknown | SD | ||
| STRADA | insertion | Nonsense_Mutation | novel | c.141_142insTAGTAGGGAAAATGGTAAAACTG | p.Glu48Ter | p.E48* | Q7RTN6 | protein_coding | TCGA-A8-A06X-01 | Breast | breast invasive carcinoma | Female | >=65 | I/II | Unknown | Unknown | SD | ||
| STRADA | insertion | Nonsense_Mutation | novel | c.465_466insGGGGCCCAGGGAAGTCCTGGGAGGAGGCAGCCTTGAG | p.Lys156GlyfsTer12 | p.K156Gfs*12 | Q7RTN6 | protein_coding | TCGA-AO-A03T-01 | Breast | breast invasive carcinoma | Female | <65 | I/II | Chemotherapy | cyclophosphamide | SD | ||
| STRADA | insertion | Nonsense_Mutation | novel | c.249_250insCCCAGTCCTGACATTCCTTTCTATTCGAGAAGCAAGTAGC | p.Thr84ProfsTer13 | p.T84Pfs*13 | Q7RTN6 | protein_coding | TCGA-BH-A0DZ-01 | Breast | breast invasive carcinoma | Female | <65 | I/II | Chemotherapy | docetaxel | SD | ||
| STRADA | deletion | Frame_Shift_Del | novel | c.44delN | p.Val15AlafsTer10 | p.V15Afs*10 | Q7RTN6 | protein_coding | TCGA-D8-A27V-01 | Breast | breast invasive carcinoma | Female | <65 | I/II | Hormone Therapy | tamoxiphen | SD | ||
| STRADA | SNV | Missense_Mutation | novel | c.328N>C | p.Glu110Gln | p.E110Q | Q7RTN6 | protein_coding | deleterious(0.05) | probably_damaging(0.931) | TCGA-C5-A8XJ-01 | Cervix | cervical & endocervical cancer | Female | >=65 | I/II | Chemotherapy | cisplatin | SD |
| Page: 1 2 3 4 5 6 7 |
Top |
Related drugs of malignant transformation related genes |
| Identification of chemicals and drugs interact with genes involved in malignant transfromation |
| (DGIdb 4.0) |
| Entrez ID | Symbol | Category | Interaction Types | Drug Claim Name | Drug Name | PMIDs |
| Page: 1 |

Copyright 2023-Present -The University of Texas Health Science Center at Houston |