
|
|||||
|
 | |
| |
| |
| |
| |
| |
|
Gene: STPG1 |
Gene summary for STPG1 |
| Gene information | Species | Human | Gene symbol | STPG1 | Gene ID | 90529 |
| Gene name | sperm tail PG-rich repeat containing 1 | |
| Gene Alias | C1orf201 | |
| Cytomap | 1p36.11 | |
| Gene Type | protein-coding | GO ID | GO:0006810 | UniProtAcc | Q5TH74 |
Top |
Malignant transformation analysis |
| Identification of the aberrant gene expression in precancerous and cancerous lesions by comparing the gene expression of stem-like cells in diseased tissues with normal stem cells |
| Entrez ID | Symbol | Replicates | Species | Organ | Tissue | Adj P-value | Log2FC | Malignancy |
| 90529 | STPG1 | LZE7T | Human | Esophagus | ESCC | 8.07e-03 | 1.57e-01 | 0.0667 |
| 90529 | STPG1 | LZE20T | Human | Esophagus | ESCC | 6.21e-04 | 2.09e-01 | 0.0662 |
| 90529 | STPG1 | LZE22T | Human | Esophagus | ESCC | 1.58e-02 | 2.60e-01 | 0.068 |
| 90529 | STPG1 | LZE24T | Human | Esophagus | ESCC | 2.73e-09 | 3.34e-01 | 0.0596 |
| 90529 | STPG1 | LZE21T | Human | Esophagus | ESCC | 9.55e-05 | 2.33e-01 | 0.0655 |
| 90529 | STPG1 | P1T-E | Human | Esophagus | ESCC | 4.79e-04 | 1.83e-01 | 0.0875 |
| 90529 | STPG1 | P2T-E | Human | Esophagus | ESCC | 9.71e-10 | 1.75e-01 | 0.1177 |
| 90529 | STPG1 | P4T-E | Human | Esophagus | ESCC | 3.01e-09 | 1.83e-01 | 0.1323 |
| 90529 | STPG1 | P5T-E | Human | Esophagus | ESCC | 1.80e-13 | 2.50e-01 | 0.1327 |
| 90529 | STPG1 | P8T-E | Human | Esophagus | ESCC | 2.03e-18 | 1.59e-01 | 0.0889 |
| 90529 | STPG1 | P9T-E | Human | Esophagus | ESCC | 5.33e-10 | 2.88e-01 | 0.1131 |
| 90529 | STPG1 | P10T-E | Human | Esophagus | ESCC | 4.70e-25 | 4.73e-01 | 0.116 |
| 90529 | STPG1 | P11T-E | Human | Esophagus | ESCC | 2.21e-03 | 1.42e-01 | 0.1426 |
| 90529 | STPG1 | P12T-E | Human | Esophagus | ESCC | 2.52e-26 | 4.56e-01 | 0.1122 |
| 90529 | STPG1 | P15T-E | Human | Esophagus | ESCC | 8.85e-21 | 3.26e-01 | 0.1149 |
| 90529 | STPG1 | P16T-E | Human | Esophagus | ESCC | 3.21e-04 | 7.85e-02 | 0.1153 |
| 90529 | STPG1 | P19T-E | Human | Esophagus | ESCC | 5.19e-07 | 2.94e-01 | 0.1662 |
| 90529 | STPG1 | P20T-E | Human | Esophagus | ESCC | 2.66e-12 | 1.94e-01 | 0.1124 |
| 90529 | STPG1 | P21T-E | Human | Esophagus | ESCC | 1.82e-24 | 3.72e-01 | 0.1617 |
| 90529 | STPG1 | P22T-E | Human | Esophagus | ESCC | 2.98e-04 | 1.28e-01 | 0.1236 |
| Page: 1 2 3 4 |
| Tissue | Expression Dynamics | Abbreviation |
| Esophagus | 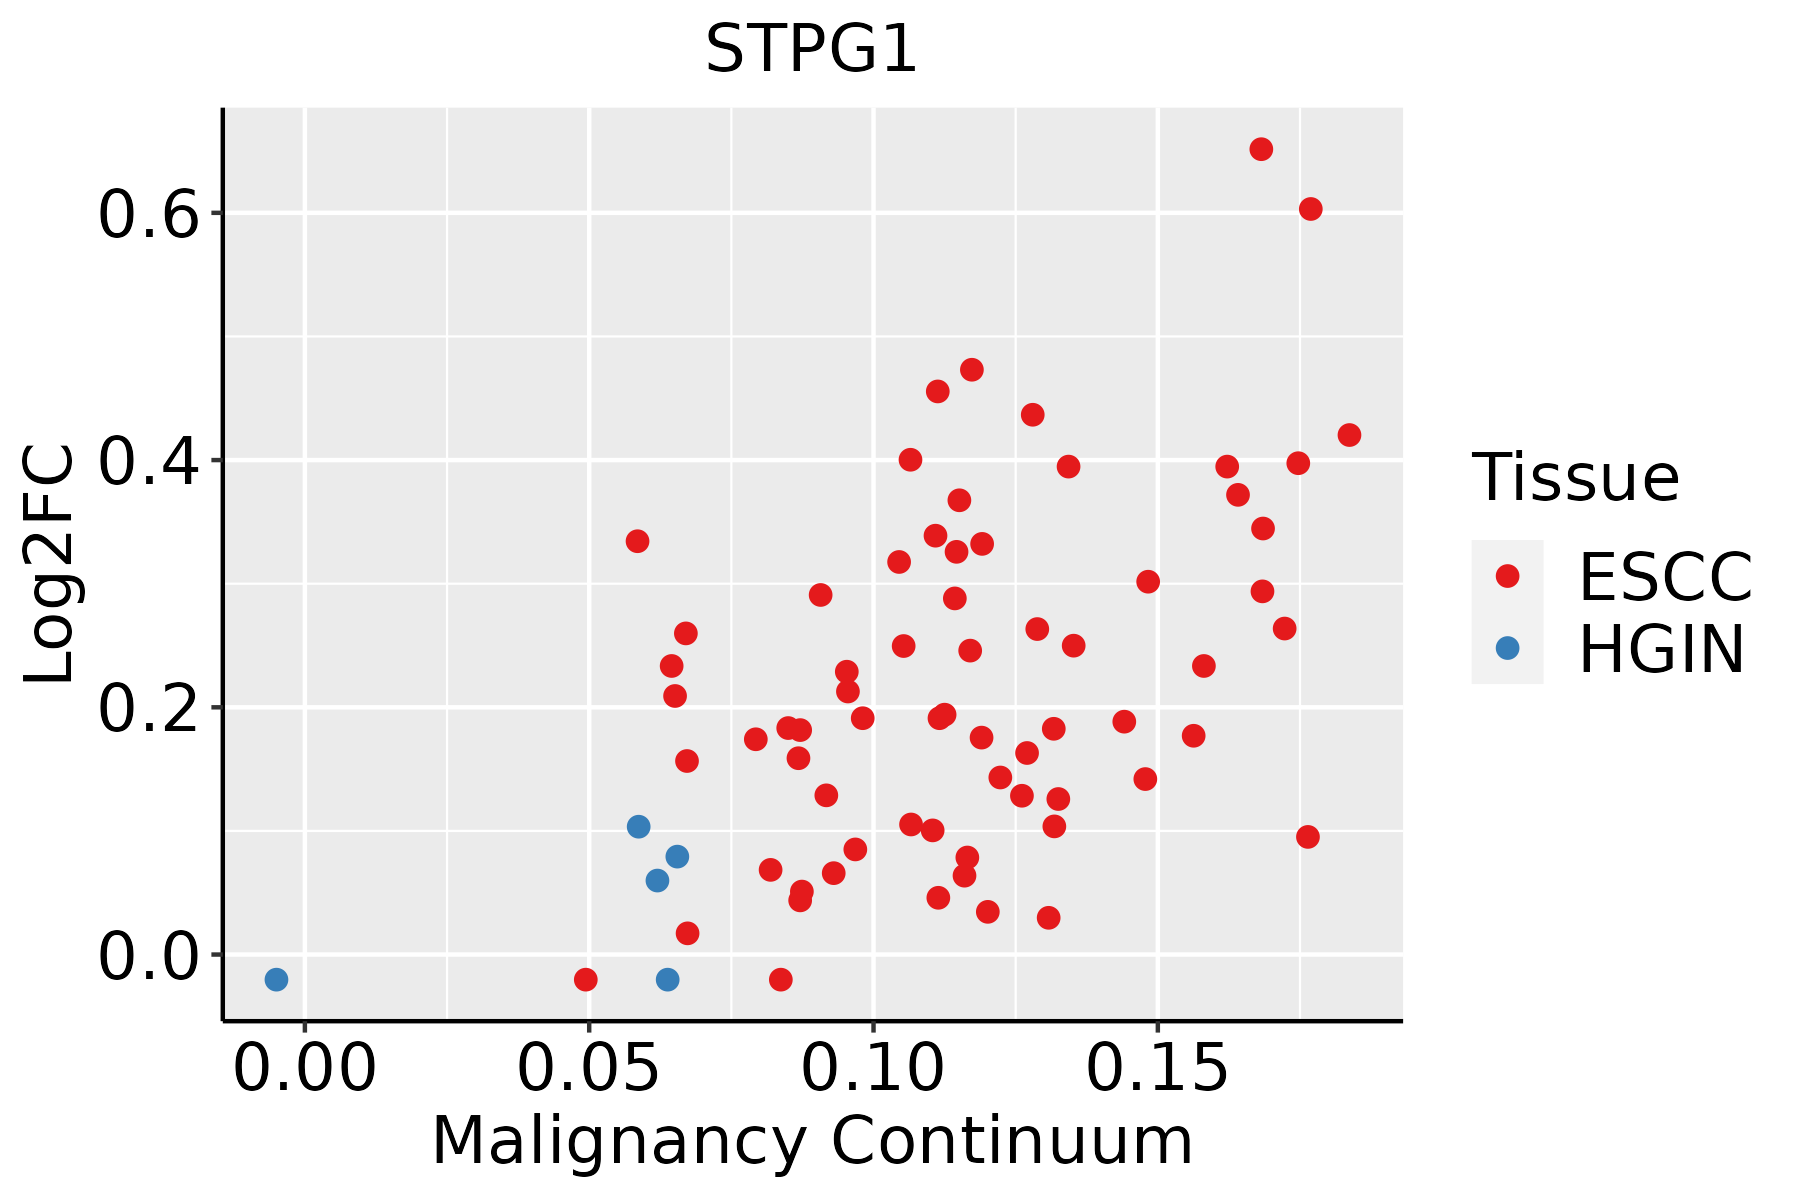 | ESCC: Esophageal squamous cell carcinoma |
| HGIN: High-grade intraepithelial neoplasias | ||
| LGIN: Low-grade intraepithelial neoplasias | ||
| Oral Cavity | 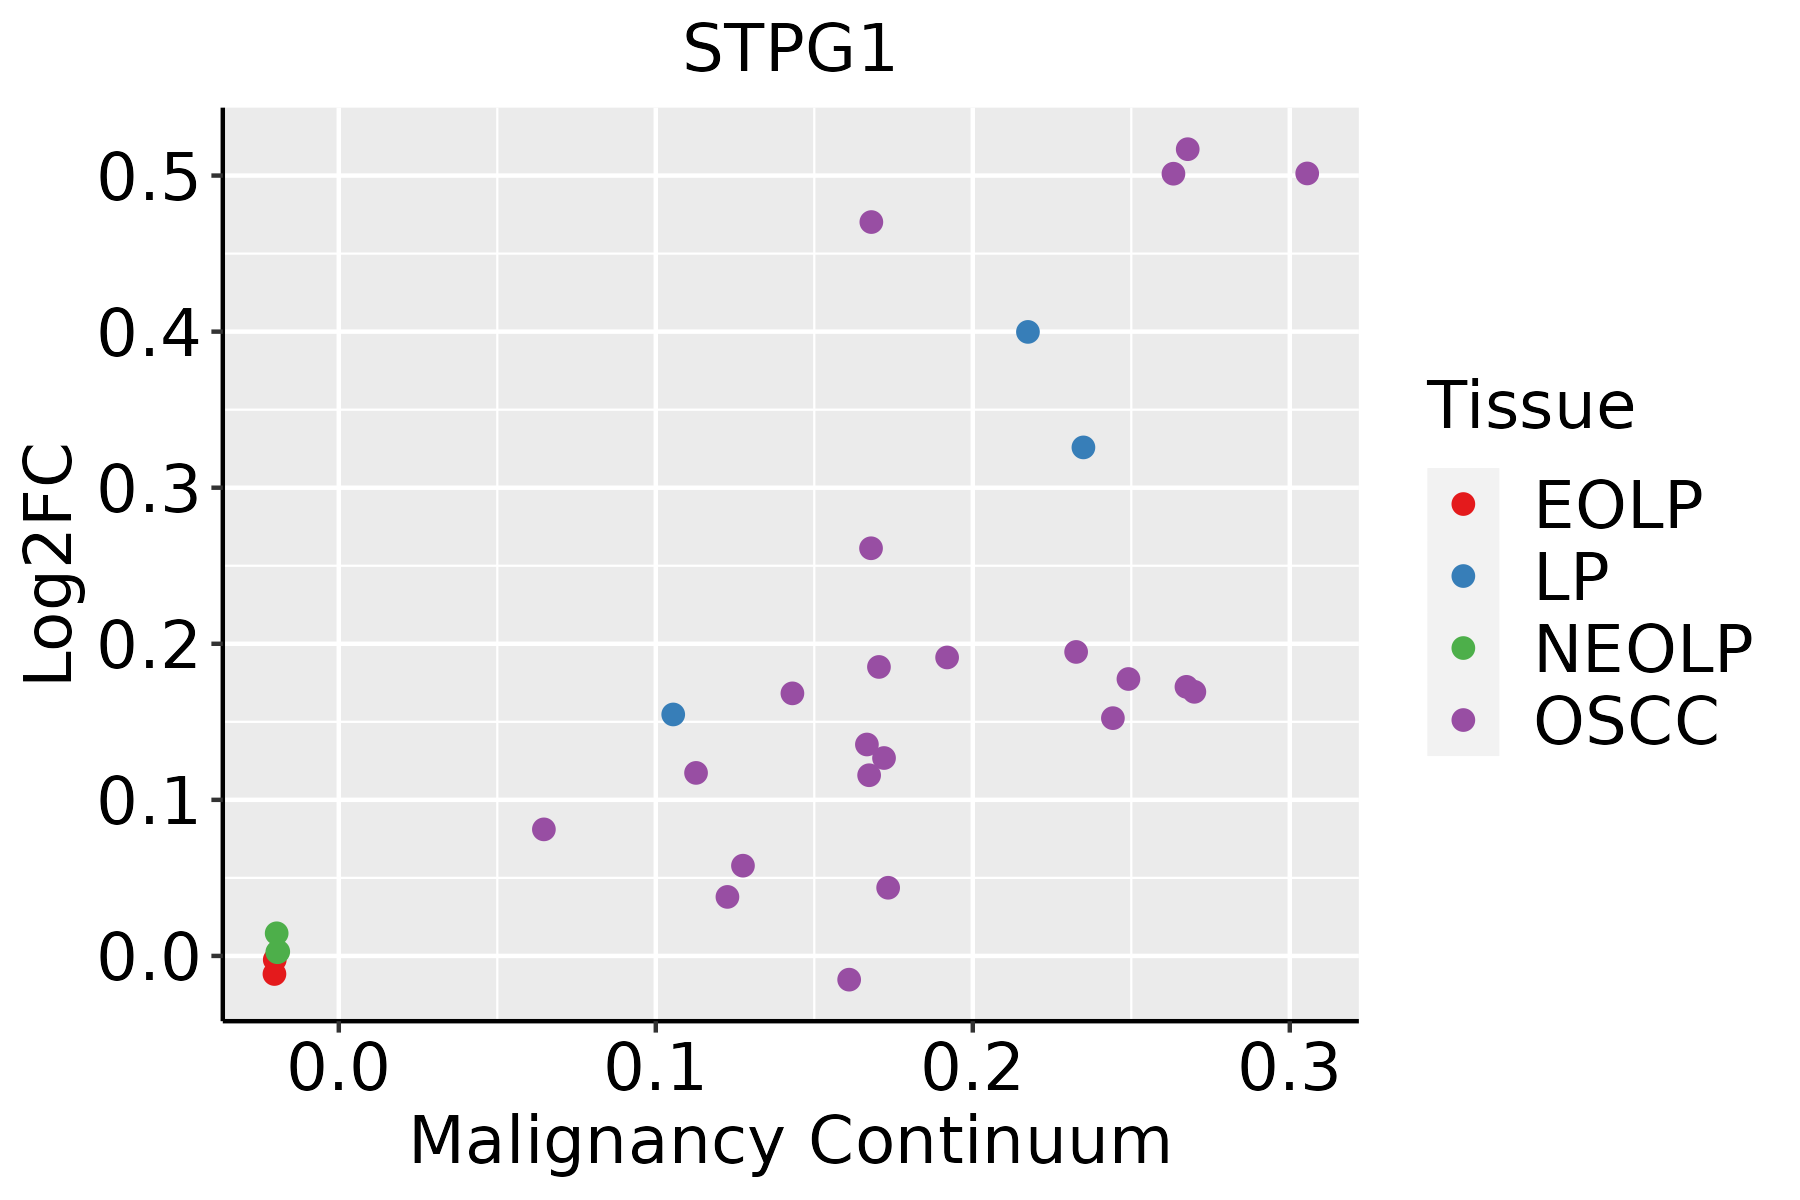 | EOLP: Erosive Oral lichen planus |
| LP: leukoplakia | ||
| NEOLP: Non-erosive oral lichen planus | ||
| OSCC: Oral squamous cell carcinoma |
| ∗log2FC in expression of this searched gene in stem-like cells from each diseased tissue sample relative to stem-like cells in normal samples in each tissue plotted against the malignancy continuum. Samples are colored based on if they are from different disease stage. |
Top |
Malignant transformation related pathway analysis |
| Find out the enriched GO biological processes and KEGG pathways involved in transition from healthy to precancer to cancer |
| Tissue | Disease Stage | Enriched GO biological Processes |
| Colorectum | AD |  |
| Colorectum | SER |  |
| Colorectum | MSS |  |
| Colorectum | MSI-H |  |
| Colorectum | FAP |  |
| ∗Top 15 enriched GO BP terms are showed in the bar plot of each disease state in each tissue. Each row represents a significant GO biological process which is colored according to the -log10(p.adjust). |
| Page: 1 2 3 4 5 6 7 8 9 |
| GO ID | Tissue | Disease Stage | Description | Gene Ratio | Bg Ratio | pvalue | p.adjust | Count |
| GO:0006839110 | Esophagus | ESCC | mitochondrial transport | 187/8552 | 254/18723 | 8.35e-20 | 9.81e-18 | 187 |
| GO:000700619 | Esophagus | ESCC | mitochondrial membrane organization | 93/8552 | 116/18723 | 2.16e-14 | 1.11e-12 | 93 |
| GO:0008637110 | Esophagus | ESCC | apoptotic mitochondrial changes | 83/8552 | 107/18723 | 1.43e-11 | 5.08e-10 | 83 |
| GO:004690217 | Esophagus | ESCC | regulation of mitochondrial membrane permeability | 49/8552 | 63/18723 | 1.91e-07 | 2.97e-06 | 49 |
| GO:00905599 | Esophagus | ESCC | regulation of membrane permeability | 58/8552 | 78/18723 | 2.38e-07 | 3.61e-06 | 58 |
| GO:00357948 | Esophagus | ESCC | positive regulation of mitochondrial membrane permeability | 36/8552 | 43/18723 | 2.90e-07 | 4.20e-06 | 36 |
| GO:190268614 | Esophagus | ESCC | mitochondrial outer membrane permeabilization involved in programmed cell death | 33/8552 | 40/18723 | 1.80e-06 | 2.11e-05 | 33 |
| GO:19021108 | Esophagus | ESCC | positive regulation of mitochondrial membrane permeability involved in apoptotic process | 31/8552 | 38/18723 | 5.93e-06 | 6.10e-05 | 31 |
| GO:19057108 | Esophagus | ESCC | positive regulation of membrane permeability | 37/8552 | 48/18723 | 8.99e-06 | 8.65e-05 | 37 |
| GO:19021086 | Esophagus | ESCC | regulation of mitochondrial membrane permeability involved in apoptotic process | 34/8552 | 45/18723 | 4.37e-05 | 3.49e-04 | 34 |
| GO:000683918 | Oral cavity | OSCC | mitochondrial transport | 162/7305 | 254/18723 | 8.96e-16 | 6.52e-14 | 162 |
| GO:000700610 | Oral cavity | OSCC | mitochondrial membrane organization | 85/7305 | 116/18723 | 6.29e-14 | 3.40e-12 | 85 |
| GO:000863718 | Oral cavity | OSCC | apoptotic mitochondrial changes | 78/7305 | 107/18723 | 1.06e-12 | 4.78e-11 | 78 |
| GO:00905598 | Oral cavity | OSCC | regulation of membrane permeability | 54/7305 | 78/18723 | 6.05e-08 | 1.09e-06 | 54 |
| GO:00469028 | Oral cavity | OSCC | regulation of mitochondrial membrane permeability | 45/7305 | 63/18723 | 1.80e-07 | 2.92e-06 | 45 |
| GO:00357947 | Oral cavity | OSCC | positive regulation of mitochondrial membrane permeability | 31/7305 | 43/18723 | 1.10e-05 | 1.14e-04 | 31 |
| GO:19026868 | Oral cavity | OSCC | mitochondrial outer membrane permeabilization involved in programmed cell death | 28/7305 | 40/18723 | 7.00e-05 | 5.60e-04 | 28 |
| GO:19057107 | Oral cavity | OSCC | positive regulation of membrane permeability | 32/7305 | 48/18723 | 9.60e-05 | 7.25e-04 | 32 |
| GO:19021107 | Oral cavity | OSCC | positive regulation of mitochondrial membrane permeability involved in apoptotic process | 26/7305 | 38/18723 | 2.29e-04 | 1.49e-03 | 26 |
| GO:19021085 | Oral cavity | OSCC | regulation of mitochondrial membrane permeability involved in apoptotic process | 29/7305 | 45/18723 | 4.85e-04 | 2.86e-03 | 29 |
| Page: 1 |
| Pathway ID | Tissue | Disease Stage | Description | Gene Ratio | Bg Ratio | pvalue | p.adjust | qvalue | Count |
| Page: 1 |
Top |
Cell-cell communication analysis |
| Identification of potential cell-cell interactions between two cell types and their ligand-receptor pairs for different disease states |
| Ligand | Receptor | LRpair | Pathway | Tissue | Disease Stage |
| Page: 1 |
Top |
Single-cell gene regulatory network inference analysis |
| Find out the significant the regulons (TFs) and the target genes of each regulon across cell types for different disease states |
| TF | Cell Type | Tissue | Disease Stage | Target Gene | RSS | Regulon Activity |
| ∗The dot plots of a searched regulon are shown for all cell subpopulations in each disease state of each tissue based on the regulon specific score inferred using pySCENIC and by calculating the average expression. |
| Page: 1 |
Top |
Somatic mutation of malignant transformation related genes |
| Annotation of somatic variants for genes involved in malignant transformation |
| Hugo Symbol | Variant Class | Variant Classification | dbSNP RS | HGVSc | HGVSp | HGVSp Short | SWISSPROT | BIOTYPE | SIFT | PolyPhen | Tumor Sample Barcode | Tissue | Histology | Sex | Age | Stage | Therapy Types | Drugs | Outcome |
| STPG1 | SNV | Missense_Mutation | novel | c.826G>A | p.Asp276Asn | p.D276N | Q5TH74 | protein_coding | tolerated(0.31) | benign(0.028) | TCGA-MA-AA42-01 | Cervix | cervical & endocervical cancer | Female | >=65 | I/II | Unknown | Unknown | SD |
| STPG1 | SNV | Missense_Mutation | novel | c.353N>T | p.Ser118Leu | p.S118L | Q5TH74 | protein_coding | tolerated(0.05) | possibly_damaging(0.494) | TCGA-CA-6717-01 | Colorectum | colon adenocarcinoma | Male | <65 | I/II | Chemotherapy | oxaliplatin | CR |
| STPG1 | SNV | Missense_Mutation | c.262N>G | p.Lys88Glu | p.K88E | Q5TH74 | protein_coding | deleterious(0.01) | benign(0.396) | TCGA-CM-5868-01 | Colorectum | colon adenocarcinoma | Female | <65 | I/II | Chemotherapy | fluorouracil | SD | |
| STPG1 | SNV | Missense_Mutation | rs766695337 | c.902N>T | p.Pro301Leu | p.P301L | Q5TH74 | protein_coding | tolerated(0.34) | benign(0.157) | TCGA-DY-A1DD-01 | Colorectum | rectum adenocarcinoma | Female | >=65 | III/IV | Unknown | Unknown | SD |
| STPG1 | SNV | Missense_Mutation | rs765960039 | c.589N>A | p.Glu197Lys | p.E197K | Q5TH74 | protein_coding | deleterious(0.01) | probably_damaging(0.998) | TCGA-EI-6917-01 | Colorectum | rectum adenocarcinoma | Male | <65 | III/IV | Chemotherapy | 5fluorouracil+oxaciplatina+l-folinian | SD |
| STPG1 | insertion | Frame_Shift_Ins | novel | c.150_151insA | p.Gly51ArgfsTer4 | p.G51Rfs*4 | Q5TH74 | protein_coding | TCGA-AZ-6598-01 | Colorectum | colon adenocarcinoma | Female | >=65 | I/II | Unknown | Unknown | SD | ||
| STPG1 | SNV | Missense_Mutation | novel | c.874N>G | p.Ser292Ala | p.S292A | Q5TH74 | protein_coding | deleterious(0) | probably_damaging(0.992) | TCGA-A5-A0G2-01 | Endometrium | uterine corpus endometrioid carcinoma | Female | <65 | III/IV | Unknown | Unknown | SD |
| STPG1 | SNV | Missense_Mutation | novel | c.718C>T | p.Pro240Ser | p.P240S | Q5TH74 | protein_coding | tolerated(0.48) | benign(0.031) | TCGA-AJ-A2QM-01 | Endometrium | uterine corpus endometrioid carcinoma | Female | >=65 | I/II | Chemotherapy | carboplatin | CR |
| STPG1 | SNV | Missense_Mutation | c.18G>T | p.Gln6His | p.Q6H | Q5TH74 | protein_coding | tolerated_low_confidence(0.17) | benign(0) | TCGA-AP-A056-01 | Endometrium | uterine corpus endometrioid carcinoma | Female | <65 | I/II | Unknown | Unknown | SD | |
| STPG1 | SNV | Missense_Mutation | c.781N>T | p.Pro261Ser | p.P261S | Q5TH74 | protein_coding | deleterious(0.01) | possibly_damaging(0.888) | TCGA-AP-A059-01 | Endometrium | uterine corpus endometrioid carcinoma | Female | >=65 | I/II | Unknown | Unknown | SD |
| Page: 1 2 3 4 |
Top |
Related drugs of malignant transformation related genes |
| Identification of chemicals and drugs interact with genes involved in malignant transfromation |
| (DGIdb 4.0) |
| Entrez ID | Symbol | Category | Interaction Types | Drug Claim Name | Drug Name | PMIDs |
| Page: 1 |

Copyright 2023-Present -The University of Texas Health Science Center at Houston |