| Tissue | Expression Dynamics | Abbreviation |
| Cervix | 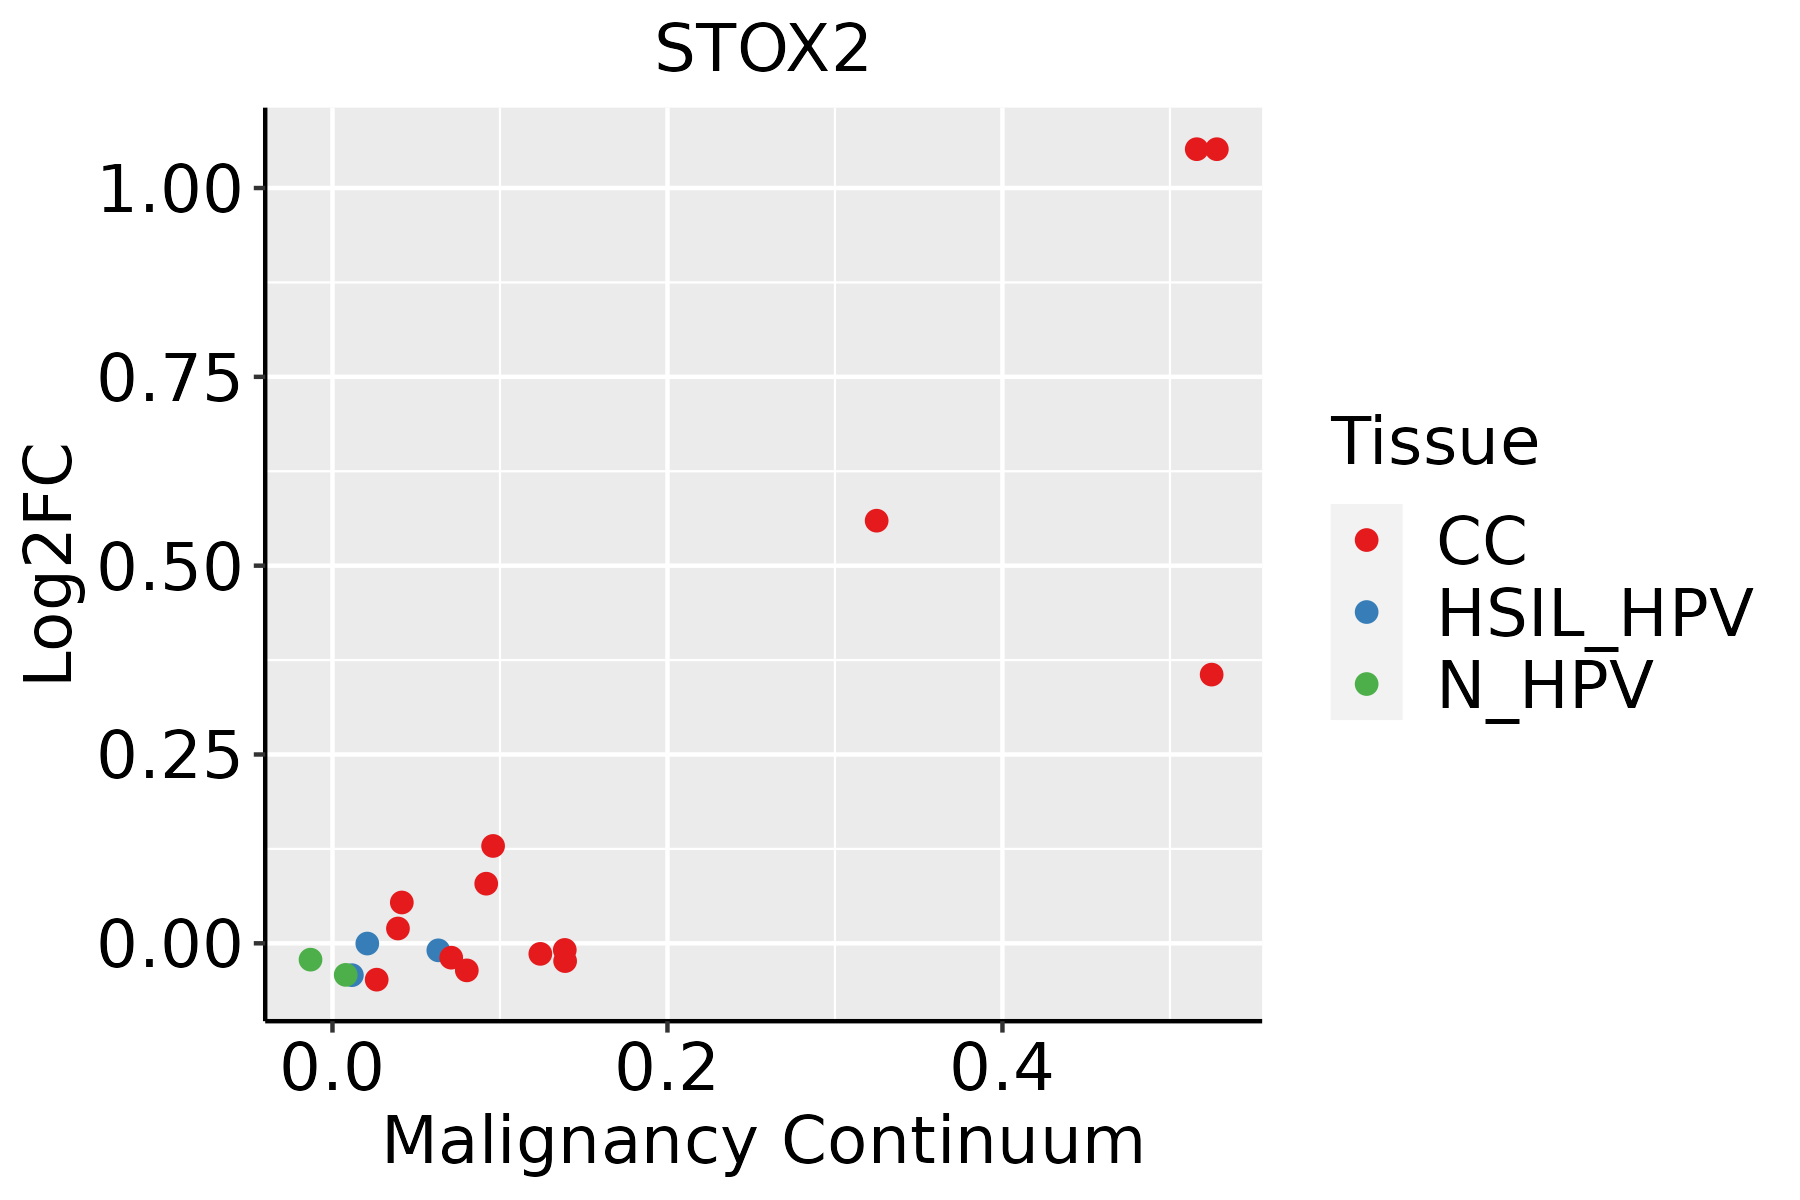 | CC: Cervix cancer |
| HSIL_HPV: HPV-infected high-grade squamous intraepithelial lesions |
| N_HPV: HPV-infected normal cervix |
| Colorectum (GSE201348) |  | FAP: Familial adenomatous polyposis |
| CRC: Colorectal cancer |
| Colorectum (HTA11) |  | AD: Adenomas |
| SER: Sessile serrated lesions |
| MSI-H: Microsatellite-high colorectal cancer |
| MSS: Microsatellite stable colorectal cancer |
| Endometrium |  | AEH: Atypical endometrial hyperplasia |
| EEC: Endometrioid Cancer |
| Lung | 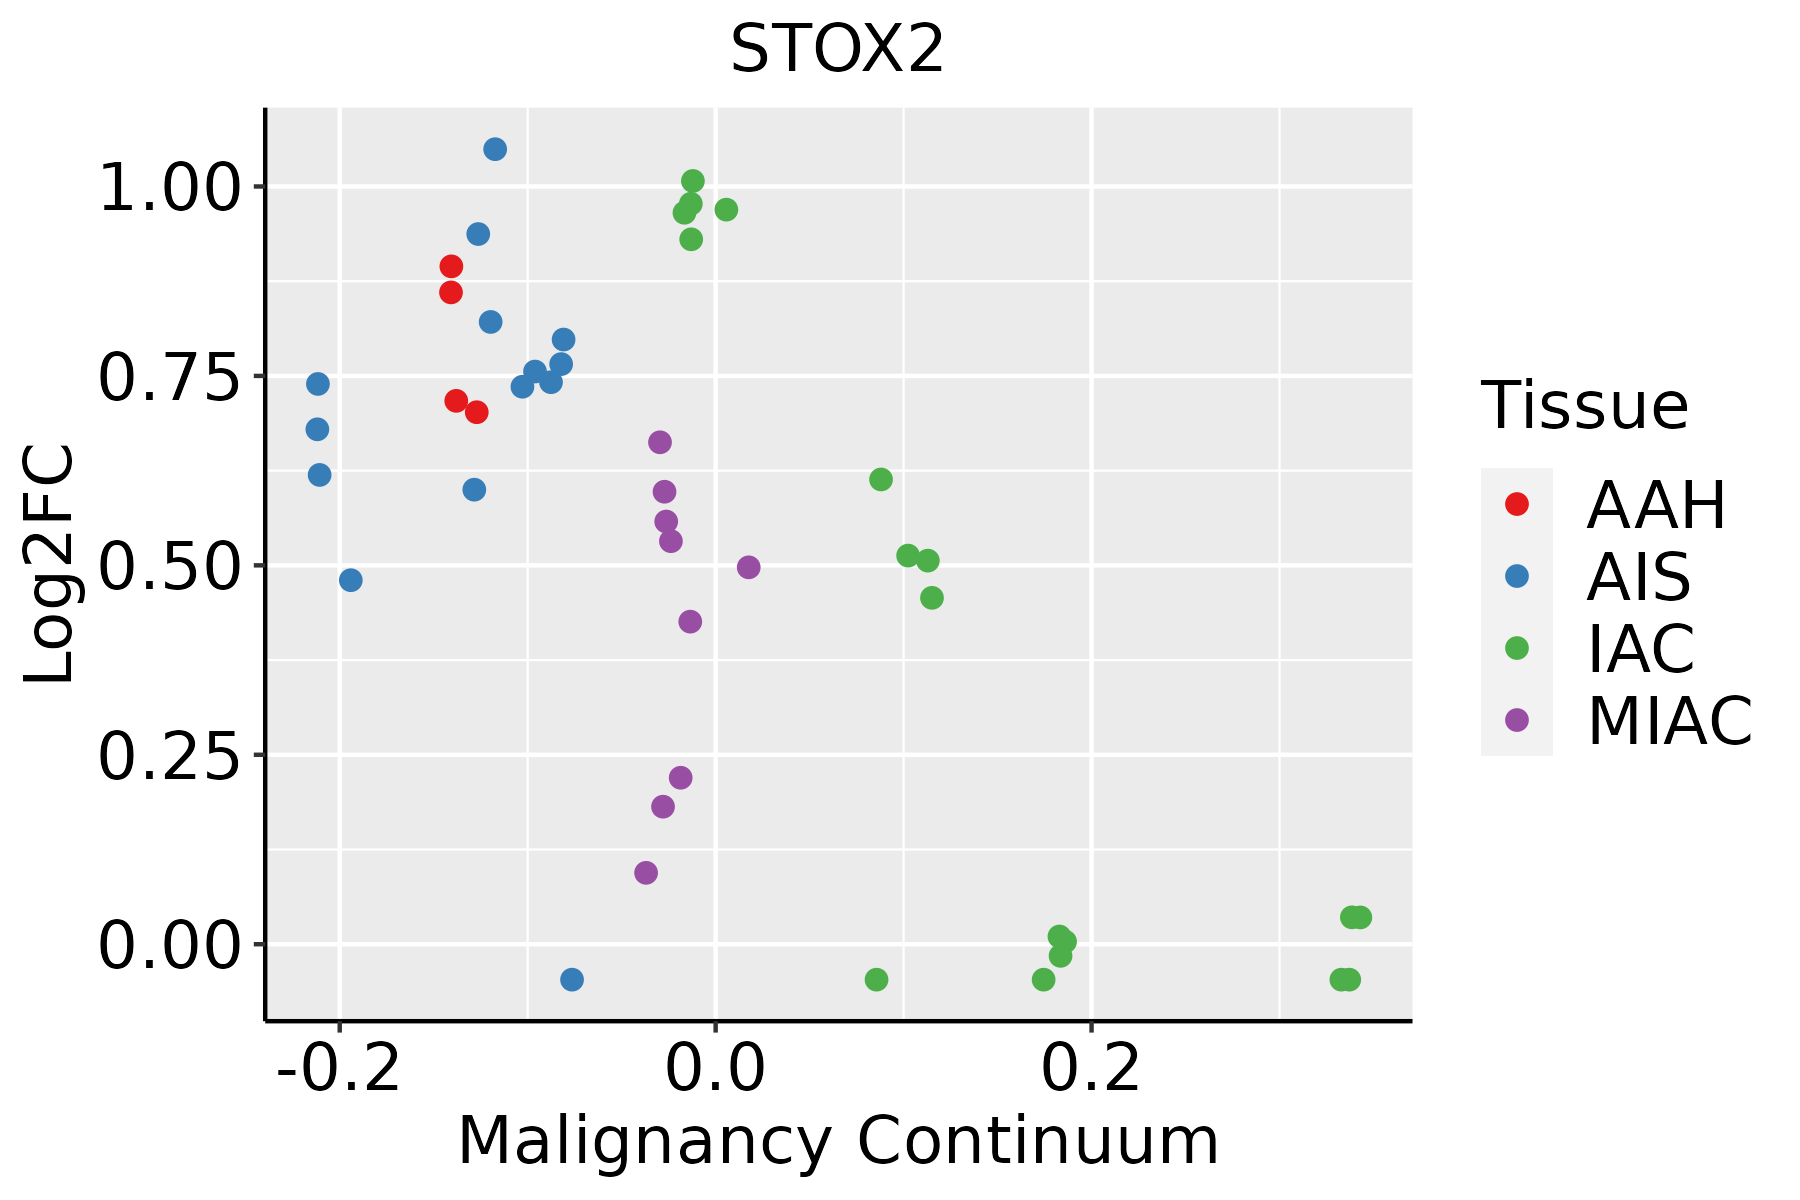 | AAH: Atypical adenomatous hyperplasia |
| AIS: Adenocarcinoma in situ |
| IAC: Invasive lung adenocarcinoma |
| MIA: Minimally invasive adenocarcinoma |
| Prostate |  | BPH: Benign Prostatic Hyperplasia |
| GO ID | Tissue | Disease Stage | Description | Gene Ratio | Bg Ratio | pvalue | p.adjust | Count |
| GO:00018908 | Cervix | CC | placenta development | 40/2311 | 144/18723 | 4.59e-07 | 1.77e-05 | 40 |
| GO:00614588 | Cervix | CC | reproductive system development | 87/2311 | 427/18723 | 1.37e-06 | 4.55e-05 | 87 |
| GO:00486088 | Cervix | CC | reproductive structure development | 86/2311 | 424/18723 | 1.90e-06 | 5.97e-05 | 86 |
| GO:00075654 | Cervix | CC | female pregnancy | 43/2311 | 193/18723 | 7.62e-05 | 1.04e-03 | 43 |
| GO:00447064 | Cervix | CC | multi-multicellular organism process | 45/2311 | 220/18723 | 4.14e-04 | 4.21e-03 | 45 |
| GO:00601353 | Cervix | CC | maternal process involved in female pregnancy | 15/2311 | 62/18723 | 7.30e-03 | 3.92e-02 | 15 |
| GO:0001890 | Colorectum | AD | placenta development | 51/3918 | 144/18723 | 3.99e-05 | 7.16e-04 | 51 |
| GO:0061458 | Colorectum | AD | reproductive system development | 116/3918 | 427/18723 | 1.11e-03 | 1.01e-02 | 116 |
| GO:0048608 | Colorectum | AD | reproductive structure development | 114/3918 | 424/18723 | 1.78e-03 | 1.47e-02 | 114 |
| GO:00018902 | Colorectum | MSS | placenta development | 51/3467 | 144/18723 | 1.10e-06 | 3.77e-05 | 51 |
| GO:00614582 | Colorectum | MSS | reproductive system development | 115/3467 | 427/18723 | 9.86e-06 | 2.39e-04 | 115 |
| GO:00486082 | Colorectum | MSS | reproductive structure development | 113/3467 | 424/18723 | 1.94e-05 | 4.18e-04 | 113 |
| GO:0001893 | Colorectum | MSS | maternal placenta development | 13/3467 | 35/18723 | 7.38e-03 | 4.68e-02 | 13 |
| GO:00018903 | Colorectum | FAP | placenta development | 38/2622 | 144/18723 | 6.22e-05 | 1.21e-03 | 38 |
| GO:00614583 | Colorectum | FAP | reproductive system development | 85/2622 | 427/18723 | 4.30e-04 | 5.13e-03 | 85 |
| GO:00486083 | Colorectum | FAP | reproductive structure development | 84/2622 | 424/18723 | 5.40e-04 | 6.10e-03 | 84 |
| GO:00614589 | Endometrium | AEH | reproductive system development | 88/2100 | 427/18723 | 9.50e-09 | 6.41e-07 | 88 |
| GO:00486089 | Endometrium | AEH | reproductive structure development | 87/2100 | 424/18723 | 1.43e-08 | 9.12e-07 | 87 |
| GO:00018909 | Endometrium | AEH | placenta development | 39/2100 | 144/18723 | 1.07e-07 | 5.20e-06 | 39 |
| GO:00075655 | Endometrium | AEH | female pregnancy | 43/2100 | 193/18723 | 7.52e-06 | 1.80e-04 | 43 |
| Hugo Symbol | Variant Class | Variant Classification | dbSNP RS | HGVSc | HGVSp | HGVSp Short | SWISSPROT | BIOTYPE | SIFT | PolyPhen | Tumor Sample Barcode | Tissue | Histology | Sex | Age | Stage | Therapy Types | Drugs | Outcome |
| STOX2 | SNV | Missense_Mutation | novel | c.2462A>T | p.Asn821Ile | p.N821I | Q9P2F5 | protein_coding | deleterious_low_confidence(0) | probably_damaging(0.942) | TCGA-A7-A0CJ-01 | Breast | breast invasive carcinoma | Female | <65 | I/II | Chemotherapy | cytoxan | SD |
| STOX2 | SNV | Missense_Mutation | | c.2364G>T | p.Lys788Asn | p.K788N | Q9P2F5 | protein_coding | deleterious_low_confidence(0.01) | benign(0.058) | TCGA-A8-A07P-01 | Breast | breast invasive carcinoma | Female | >=65 | I/II | Chemotherapy | 5-fluorouracil | SD |
| STOX2 | SNV | Missense_Mutation | novel | c.9N>C | p.Lys3Asn | p.K3N | Q9P2F5 | protein_coding | deleterious_low_confidence(0) | probably_damaging(0.981) | TCGA-AC-A3W6-01 | Breast | breast invasive carcinoma | Female | >=65 | III/IV | Unknown | Unknown | SD |
| STOX2 | SNV | Missense_Mutation | | c.233N>A | p.Leu78His | p.L78H | Q9P2F5 | protein_coding | deleterious(0) | probably_damaging(0.999) | TCGA-C8-A1HE-01 | Breast | breast invasive carcinoma | Female | <65 | I/II | Unknown | Unknown | SD |
| STOX2 | insertion | Nonsense_Mutation | novel | c.1629_1630insAGATAACTTCATCATGCACAGCAACACAAACGT | p.Arg543_Ala544insArgTerLeuHisHisAlaGlnGlnHisLysArg | p.R543_A544insR*LHHAQQHKR | Q9P2F5 | protein_coding | | | TCGA-A7-A0CJ-01 | Breast | breast invasive carcinoma | Female | <65 | I/II | Chemotherapy | cytoxan | SD |
| STOX2 | insertion | In_Frame_Ins | novel | c.2464_2465insAACAAAGCCAAGGAGAGATCCAGG | p.Leu822delinsGlnGlnSerGlnGlyGluIleGlnVal | p.L822delinsQQSQGEIQV | Q9P2F5 | protein_coding | | | TCGA-A7-A0CJ-01 | Breast | breast invasive carcinoma | Female | <65 | I/II | Chemotherapy | cytoxan | SD |
| STOX2 | insertion | Nonsense_Mutation | novel | c.1627_1628insGAACACAAACGTGCTCGAGTCCCACTTCCCCATGACACCAGAAT | p.Ala544ThrfsTer11 | p.A544Tfs*11 | Q9P2F5 | protein_coding | | | TCGA-A8-A0A4-01 | Breast | breast invasive carcinoma | Female | >=65 | I/II | Hormone Therapy | tamoxiphen | CR |
| STOX2 | insertion | Frame_Shift_Ins | novel | c.1585_1586insCTTCATCATTGAACACAAAGGAGATAACTTCATC | p.Asp529AlafsTer23 | p.D529Afs*23 | Q9P2F5 | protein_coding | | | TCGA-AO-A0J4-01 | Breast | breast invasive carcinoma | Female | <65 | I/II | Chemotherapy | doxorubicin | SD |
| STOX2 | insertion | Frame_Shift_Ins | novel | c.566_567insATTTTTCATTTTTCTCTCATTTAAA | p.Thr190PhefsTer57 | p.T190Ffs*57 | Q9P2F5 | protein_coding | | | TCGA-AO-A0JB-01 | Breast | breast invasive carcinoma | Female | <65 | III/IV | Chemotherapy | cyclophosphamide | SD |
| STOX2 | insertion | Frame_Shift_Ins | novel | c.665_666insTCCATTTTCCAAAAGACAGAGAC | p.Lys223ProfsTer30 | p.K223Pfs*30 | Q9P2F5 | protein_coding | | | TCGA-B6-A0I5-01 | Breast | breast invasive carcinoma | Female | <65 | I/II | Unknown | Unknown | SD |


