
|
|||||
|
 | |
| |
| |
| |
| |
| |
|
Gene: STON2 |
Gene summary for STON2 |
| Gene information | Species | Human | Gene symbol | STON2 | Gene ID | 85439 |
| Gene name | stonin 2 | |
| Gene Alias | STN2 | |
| Cytomap | 14q31.1 | |
| Gene Type | protein-coding | GO ID | GO:0006810 | UniProtAcc | Q8WXE9 |
Top |
Malignant transformation analysis |
| Identification of the aberrant gene expression in precancerous and cancerous lesions by comparing the gene expression of stem-like cells in diseased tissues with normal stem cells |
| Entrez ID | Symbol | Replicates | Species | Organ | Tissue | Adj P-value | Log2FC | Malignancy |
| 85439 | STON2 | CA_HPV_3 | Human | Cervix | CC | 1.81e-03 | 1.22e-01 | 0.0414 |
| 85439 | STON2 | CCI_1 | Human | Cervix | CC | 3.88e-08 | 8.03e-01 | 0.528 |
| 85439 | STON2 | CCI_2 | Human | Cervix | CC | 4.55e-09 | 9.42e-01 | 0.5249 |
| 85439 | STON2 | CCI_3 | Human | Cervix | CC | 4.23e-14 | 1.03e+00 | 0.516 |
| 85439 | STON2 | Tumor | Human | Cervix | CC | 1.47e-04 | 2.07e-01 | 0.1241 |
| 85439 | STON2 | sample3 | Human | Cervix | CC | 9.84e-06 | 2.38e-01 | 0.1387 |
| 85439 | STON2 | T3 | Human | Cervix | CC | 4.75e-07 | 2.23e-01 | 0.1389 |
| 85439 | STON2 | LZE4T | Human | Esophagus | ESCC | 1.23e-22 | 6.12e-01 | 0.0811 |
| 85439 | STON2 | LZE24T | Human | Esophagus | ESCC | 2.08e-05 | 2.30e-01 | 0.0596 |
| 85439 | STON2 | P2T-E | Human | Esophagus | ESCC | 7.95e-07 | 5.35e-02 | 0.1177 |
| 85439 | STON2 | P4T-E | Human | Esophagus | ESCC | 2.58e-08 | 1.80e-01 | 0.1323 |
| 85439 | STON2 | P5T-E | Human | Esophagus | ESCC | 1.54e-08 | 1.33e-01 | 0.1327 |
| 85439 | STON2 | P8T-E | Human | Esophagus | ESCC | 4.89e-03 | 1.54e-01 | 0.0889 |
| 85439 | STON2 | P10T-E | Human | Esophagus | ESCC | 8.54e-39 | 8.03e-01 | 0.116 |
| 85439 | STON2 | P11T-E | Human | Esophagus | ESCC | 5.15e-05 | 3.41e-01 | 0.1426 |
| 85439 | STON2 | P12T-E | Human | Esophagus | ESCC | 1.74e-22 | 4.67e-01 | 0.1122 |
| 85439 | STON2 | P15T-E | Human | Esophagus | ESCC | 1.85e-28 | 7.72e-01 | 0.1149 |
| 85439 | STON2 | P17T-E | Human | Esophagus | ESCC | 2.60e-04 | 2.23e-01 | 0.1278 |
| 85439 | STON2 | P20T-E | Human | Esophagus | ESCC | 2.51e-10 | 2.06e-01 | 0.1124 |
| 85439 | STON2 | P21T-E | Human | Esophagus | ESCC | 1.80e-10 | 2.64e-01 | 0.1617 |
| Page: 1 2 3 4 |
| Tissue | Expression Dynamics | Abbreviation |
| Cervix |  | CC: Cervix cancer |
| HSIL_HPV: HPV-infected high-grade squamous intraepithelial lesions | ||
| N_HPV: HPV-infected normal cervix | ||
| Esophagus | 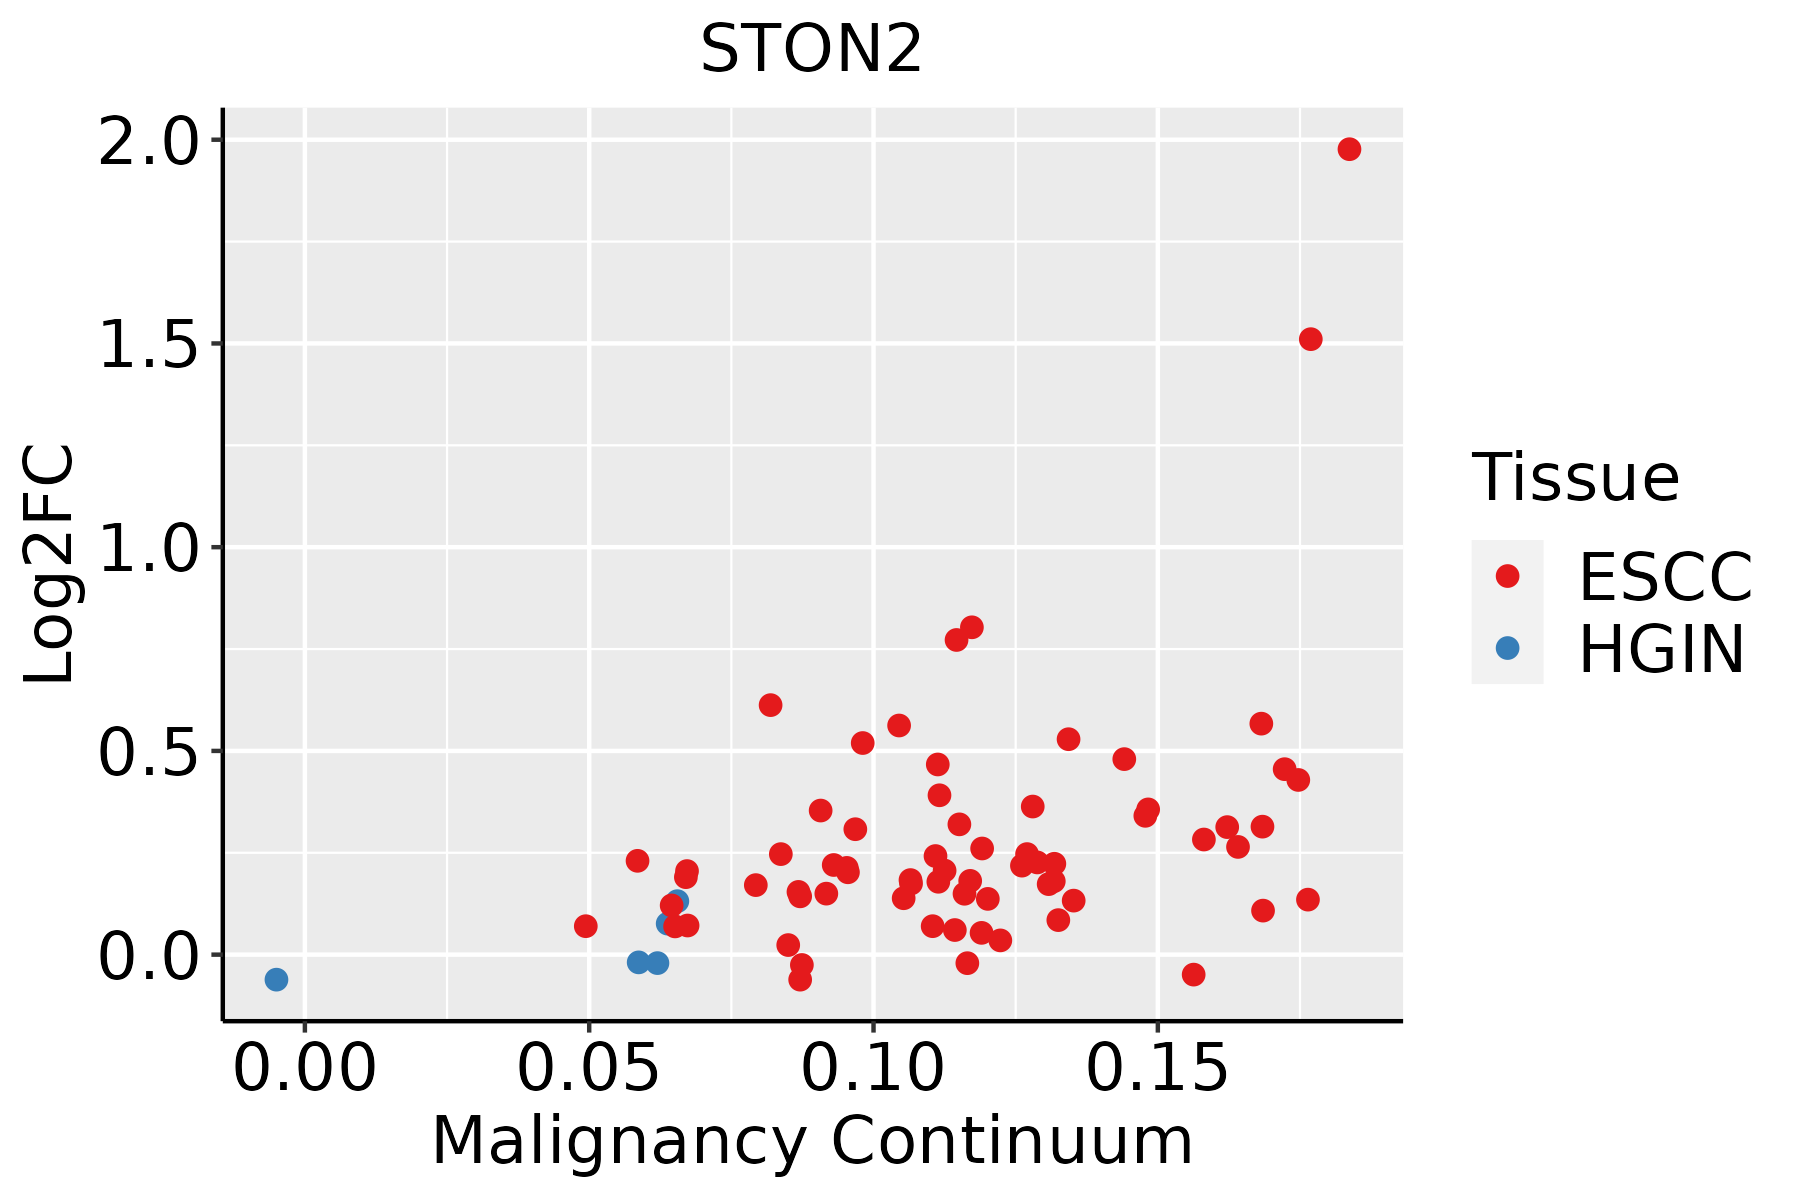 | ESCC: Esophageal squamous cell carcinoma |
| HGIN: High-grade intraepithelial neoplasias | ||
| LGIN: Low-grade intraepithelial neoplasias | ||
| Oral Cavity | 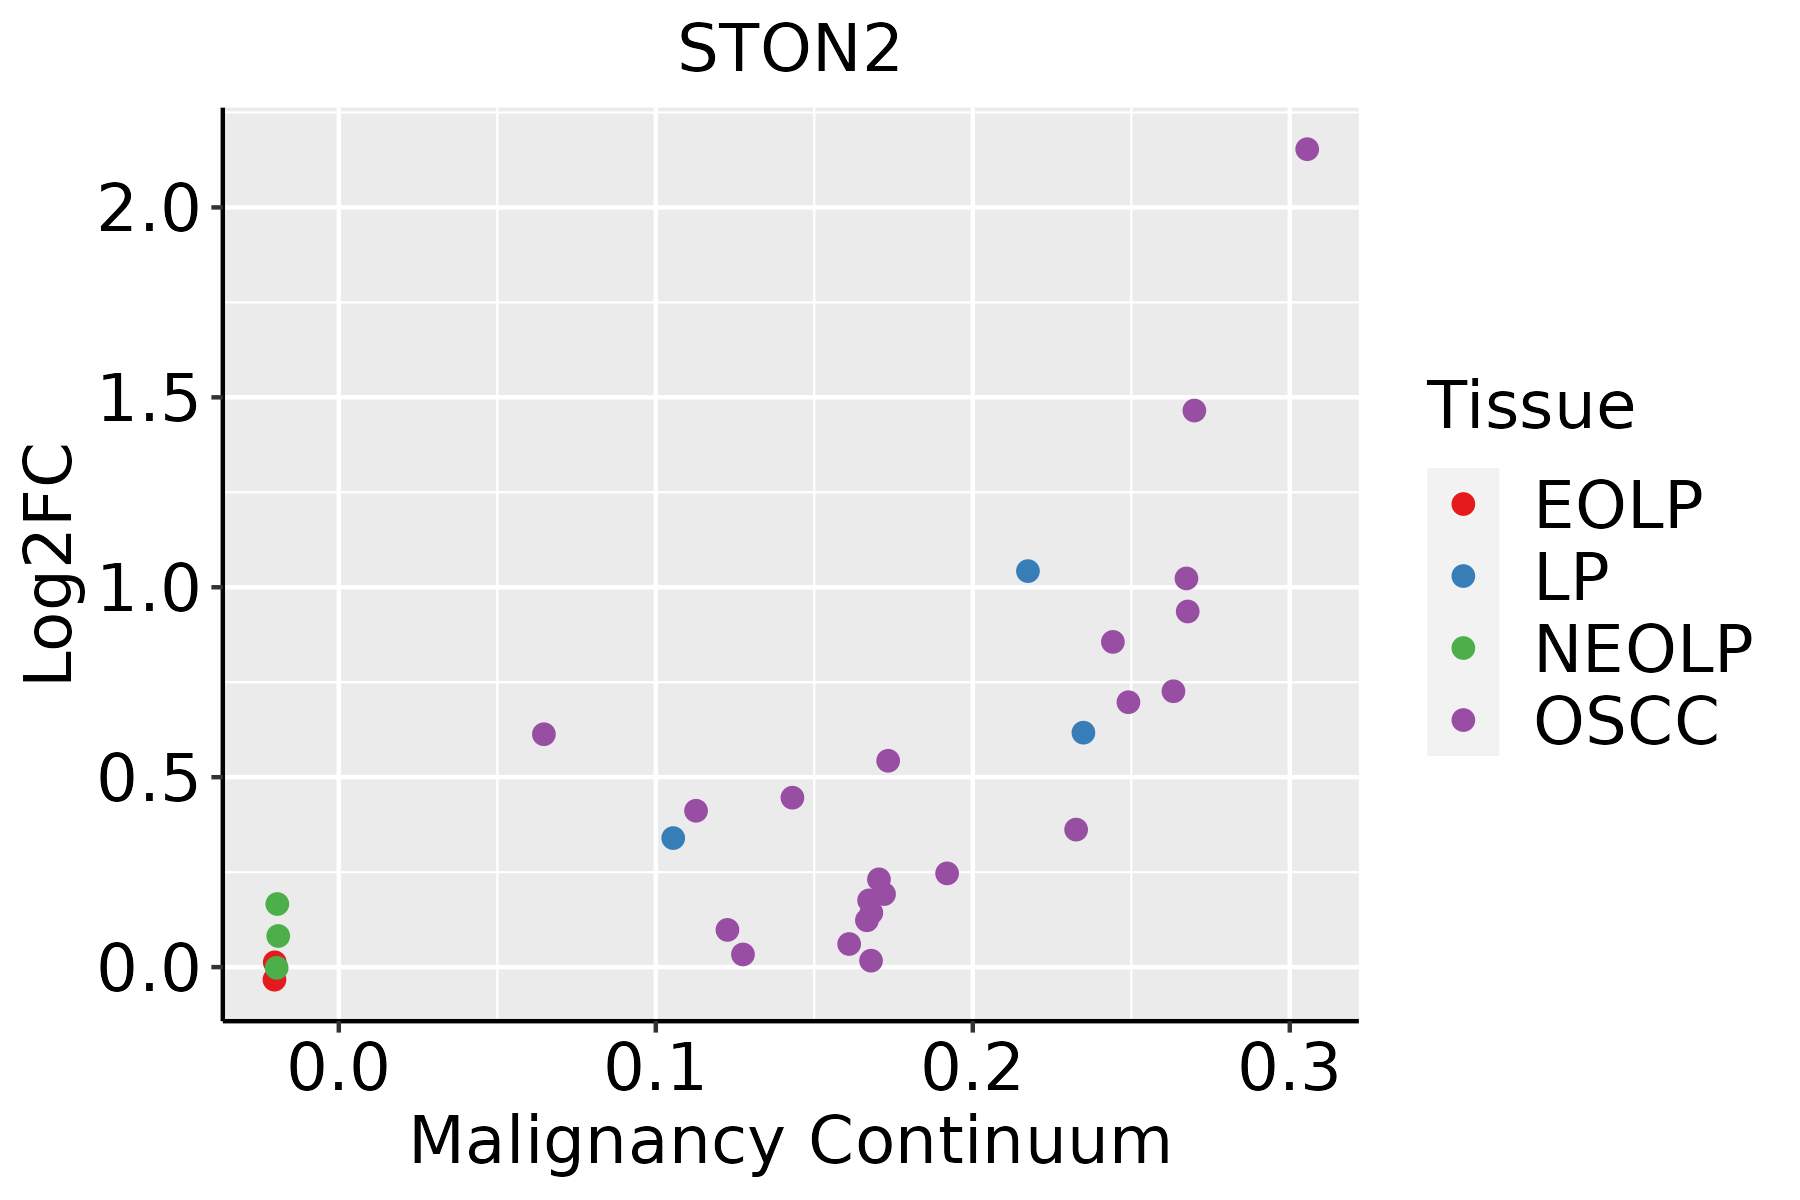 | EOLP: Erosive Oral lichen planus |
| LP: leukoplakia | ||
| NEOLP: Non-erosive oral lichen planus | ||
| OSCC: Oral squamous cell carcinoma | ||
| Skin |  | AK: Actinic keratosis |
| cSCC: Cutaneous squamous cell carcinoma | ||
| SCCIS:squamous cell carcinoma in situ |
| ∗log2FC in expression of this searched gene in stem-like cells from each diseased tissue sample relative to stem-like cells in normal samples in each tissue plotted against the malignancy continuum. Samples are colored based on if they are from different disease stage. |
Top |
Malignant transformation related pathway analysis |
| Find out the enriched GO biological processes and KEGG pathways involved in transition from healthy to precancer to cancer |
| Tissue | Disease Stage | Enriched GO biological Processes |
| Colorectum | AD |  |
| Colorectum | SER |  |
| Colorectum | MSS |  |
| Colorectum | MSI-H |  |
| Colorectum | FAP |  |
| ∗Top 15 enriched GO BP terms are showed in the bar plot of each disease state in each tissue. Each row represents a significant GO biological process which is colored according to the -log10(p.adjust). |
| Page: 1 2 3 4 5 6 7 8 9 |
| GO ID | Tissue | Disease Stage | Description | Gene Ratio | Bg Ratio | pvalue | p.adjust | Count |
| GO:00301008 | Cervix | CC | regulation of endocytosis | 47/2311 | 211/18723 | 3.65e-05 | 5.82e-04 | 47 |
| GO:00484883 | Cervix | CC | synaptic vesicle endocytosis | 16/2311 | 62/18723 | 2.87e-03 | 1.91e-02 | 16 |
| GO:01402383 | Cervix | CC | presynaptic endocytosis | 16/2311 | 62/18723 | 2.87e-03 | 1.91e-02 | 16 |
| GO:00364655 | Cervix | CC | synaptic vesicle recycling | 17/2311 | 75/18723 | 8.87e-03 | 4.53e-02 | 17 |
| GO:003010018 | Esophagus | ESCC | regulation of endocytosis | 135/8552 | 211/18723 | 5.75e-08 | 1.02e-06 | 135 |
| GO:003010016 | Oral cavity | OSCC | regulation of endocytosis | 121/7305 | 211/18723 | 4.74e-08 | 8.80e-07 | 121 |
| GO:003010017 | Oral cavity | LP | regulation of endocytosis | 81/4623 | 211/18723 | 6.57e-06 | 1.29e-04 | 81 |
| GO:003010019 | Skin | AK | regulation of endocytosis | 36/1910 | 211/18723 | 1.42e-03 | 1.05e-02 | 36 |
| GO:003010024 | Skin | cSCC | regulation of endocytosis | 72/4864 | 211/18723 | 5.06e-03 | 2.56e-02 | 72 |
| Page: 1 |
| Pathway ID | Tissue | Disease Stage | Description | Gene Ratio | Bg Ratio | pvalue | p.adjust | qvalue | Count |
| Page: 1 |
Top |
Cell-cell communication analysis |
| Identification of potential cell-cell interactions between two cell types and their ligand-receptor pairs for different disease states |
| Ligand | Receptor | LRpair | Pathway | Tissue | Disease Stage |
| Page: 1 |
Top |
Single-cell gene regulatory network inference analysis |
| Find out the significant the regulons (TFs) and the target genes of each regulon across cell types for different disease states |
| TF | Cell Type | Tissue | Disease Stage | Target Gene | RSS | Regulon Activity |
| ∗The dot plots of a searched regulon are shown for all cell subpopulations in each disease state of each tissue based on the regulon specific score inferred using pySCENIC and by calculating the average expression. |
| Page: 1 |
Top |
Somatic mutation of malignant transformation related genes |
| Annotation of somatic variants for genes involved in malignant transformation |
| Hugo Symbol | Variant Class | Variant Classification | dbSNP RS | HGVSc | HGVSp | HGVSp Short | SWISSPROT | BIOTYPE | SIFT | PolyPhen | Tumor Sample Barcode | Tissue | Histology | Sex | Age | Stage | Therapy Types | Drugs | Outcome |
| STON2 | SNV | Missense_Mutation | c.692G>A | p.Ser231Asn | p.S231N | Q8WXE9 | protein_coding | deleterious_low_confidence(0) | benign(0.189) | TCGA-A8-A09Z-01 | Breast | breast invasive carcinoma | Female | >=65 | I/II | Unknown | Unknown | SD | |
| STON2 | SNV | Missense_Mutation | c.1652A>T | p.Asp551Val | p.D551V | Q8WXE9 | protein_coding | tolerated(0.06) | benign(0.075) | TCGA-AR-A0TZ-01 | Breast | breast invasive carcinoma | Female | <65 | III/IV | Unspecific | Doxorubicin | PD | |
| STON2 | SNV | Missense_Mutation | c.2433N>A | p.Phe811Leu | p.F811L | Q8WXE9 | protein_coding | tolerated(0.41) | probably_damaging(0.987) | TCGA-BH-A0HP-01 | Breast | breast invasive carcinoma | Female | >=65 | III/IV | Chemotherapy | doxorubicin | SD | |
| STON2 | SNV | Missense_Mutation | c.612N>C | p.Met204Ile | p.M204I | Q8WXE9 | protein_coding | deleterious_low_confidence(0) | probably_damaging(0.961) | TCGA-BH-A18Q-01 | Breast | breast invasive carcinoma | Female | <65 | I/II | Unknown | Unknown | SD | |
| STON2 | SNV | Missense_Mutation | c.280N>C | p.Asp94His | p.D94H | Q8WXE9 | protein_coding | deleterious_low_confidence(0) | benign(0.027) | TCGA-BH-A18V-01 | Breast | breast invasive carcinoma | Female | <65 | I/II | Unknown | Unknown | SD | |
| STON2 | SNV | Missense_Mutation | novel | c.2599N>A | p.His867Asn | p.H867N | Q8WXE9 | protein_coding | deleterious(0.04) | probably_damaging(0.909) | TCGA-D8-A3Z6-01 | Breast | breast invasive carcinoma | Female | <65 | III/IV | Chemotherapy | cyclophosphane | SD |
| STON2 | insertion | Frame_Shift_Ins | novel | c.1256_1257insCGGGAGGTGGAGGTTGCAG | p.Ala420GlyfsTer13 | p.A420Gfs*13 | Q8WXE9 | protein_coding | TCGA-A2-A0CM-01 | Breast | breast invasive carcinoma | Female | <65 | I/II | Chemotherapy | adriamycin | PD | ||
| STON2 | insertion | Nonsense_Mutation | novel | c.2026_2027insATTAACGTATTAGCTGTGGTGCTGGAAGT | p.Arg676HisfsTer2 | p.R676Hfs*2 | Q8WXE9 | protein_coding | TCGA-AR-A0TY-01 | Breast | breast invasive carcinoma | Female | <65 | I/II | Unspecific | Paclitaxel | PD | ||
| STON2 | SNV | Missense_Mutation | c.584N>T | p.Ser195Leu | p.S195L | Q8WXE9 | protein_coding | tolerated_low_confidence(1) | benign(0.129) | TCGA-C5-A7UH-01 | Cervix | cervical & endocervical cancer | Female | <65 | III/IV | Chemotherapy | cisplatin | SD | |
| STON2 | SNV | Missense_Mutation | rs761209868 | c.1978N>T | p.Arg660Trp | p.R660W | Q8WXE9 | protein_coding | deleterious(0) | probably_damaging(1) | TCGA-EA-A410-01 | Cervix | cervical & endocervical cancer | Female | <65 | I/II | Unknown | Unknown | SD |
| Page: 1 2 3 4 5 6 7 8 9 10 |
Top |
Related drugs of malignant transformation related genes |
| Identification of chemicals and drugs interact with genes involved in malignant transfromation |
| (DGIdb 4.0) |
| Entrez ID | Symbol | Category | Interaction Types | Drug Claim Name | Drug Name | PMIDs |
| Page: 1 |

Copyright 2023-Present -The University of Texas Health Science Center at Houston |