
|
|||||
|
 | |
| |
| |
| |
| |
| |
|
Gene: STOM |
Gene summary for STOM |
| Gene information | Species | Human | Gene symbol | STOM | Gene ID | 2040 |
| Gene name | stomatin | |
| Gene Alias | BND7 | |
| Cytomap | 9q33.2 | |
| Gene Type | protein-coding | GO ID | GO:0002028 | UniProtAcc | F8VSL7 |
Top |
Malignant transformation analysis |
| Identification of the aberrant gene expression in precancerous and cancerous lesions by comparing the gene expression of stem-like cells in diseased tissues with normal stem cells |
| Entrez ID | Symbol | Replicates | Species | Organ | Tissue | Adj P-value | Log2FC | Malignancy |
| 2040 | STOM | LZE4T | Human | Esophagus | ESCC | 1.97e-14 | 7.94e-01 | 0.0811 |
| 2040 | STOM | LZE5T | Human | Esophagus | ESCC | 2.18e-04 | 1.82e-01 | 0.0514 |
| 2040 | STOM | LZE7T | Human | Esophagus | ESCC | 1.44e-07 | -1.96e-01 | 0.0667 |
| 2040 | STOM | LZE20T | Human | Esophagus | ESCC | 1.04e-09 | 8.52e-01 | 0.0662 |
| 2040 | STOM | LZE21D1 | Human | Esophagus | HGIN | 6.35e-04 | -2.51e-01 | 0.0632 |
| 2040 | STOM | LZE24D1 | Human | Esophagus | HGIN | 7.12e-08 | 3.34e-01 | 0.054 |
| 2040 | STOM | LZE24T | Human | Esophagus | ESCC | 2.51e-14 | 9.76e-01 | 0.0596 |
| 2040 | STOM | P2T-E | Human | Esophagus | ESCC | 1.46e-07 | 3.13e-01 | 0.1177 |
| 2040 | STOM | P4T-E | Human | Esophagus | ESCC | 9.71e-14 | 3.77e-01 | 0.1323 |
| 2040 | STOM | P5T-E | Human | Esophagus | ESCC | 1.40e-20 | 6.42e-01 | 0.1327 |
| 2040 | STOM | P9T-E | Human | Esophagus | ESCC | 9.62e-12 | 6.69e-01 | 0.1131 |
| 2040 | STOM | P10T-E | Human | Esophagus | ESCC | 2.46e-07 | -4.44e-01 | 0.116 |
| 2040 | STOM | P11T-E | Human | Esophagus | ESCC | 4.60e-06 | 6.64e-01 | 0.1426 |
| 2040 | STOM | P12T-E | Human | Esophagus | ESCC | 1.18e-47 | 1.55e+00 | 0.1122 |
| 2040 | STOM | P15T-E | Human | Esophagus | ESCC | 3.20e-37 | 1.26e+00 | 0.1149 |
| 2040 | STOM | P16T-E | Human | Esophagus | ESCC | 7.80e-16 | -2.68e-01 | 0.1153 |
| 2040 | STOM | P17T-E | Human | Esophagus | ESCC | 5.67e-03 | 6.19e-01 | 0.1278 |
| 2040 | STOM | P19T-E | Human | Esophagus | ESCC | 4.81e-03 | 1.23e+00 | 0.1662 |
| 2040 | STOM | P20T-E | Human | Esophagus | ESCC | 1.68e-16 | 7.22e-01 | 0.1124 |
| 2040 | STOM | P21T-E | Human | Esophagus | ESCC | 1.46e-28 | 1.06e+00 | 0.1617 |
| Page: 1 2 3 4 5 6 7 |
| Tissue | Expression Dynamics | Abbreviation |
| Esophagus |  | ESCC: Esophageal squamous cell carcinoma |
| HGIN: High-grade intraepithelial neoplasias | ||
| LGIN: Low-grade intraepithelial neoplasias | ||
| Liver | 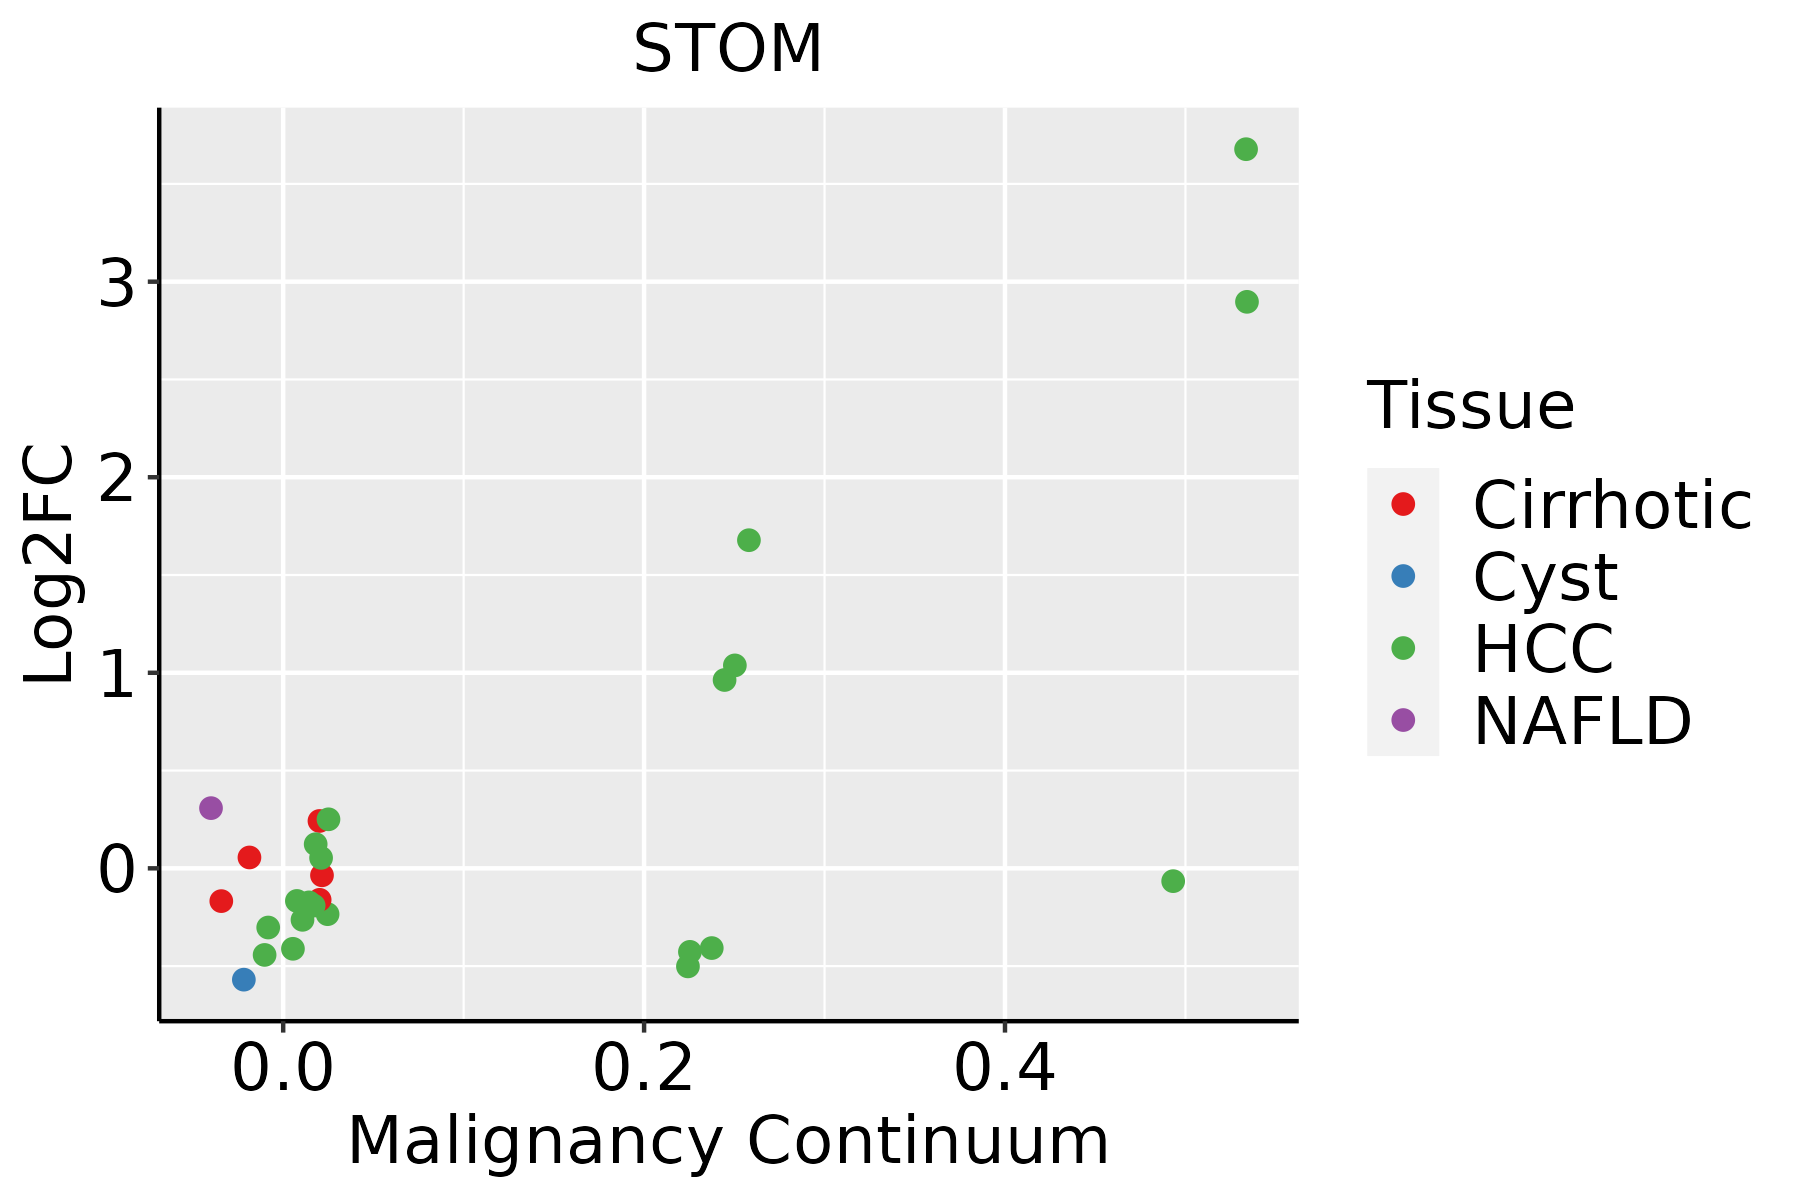 | HCC: Hepatocellular carcinoma |
| NAFLD: Non-alcoholic fatty liver disease | ||
| Lung | 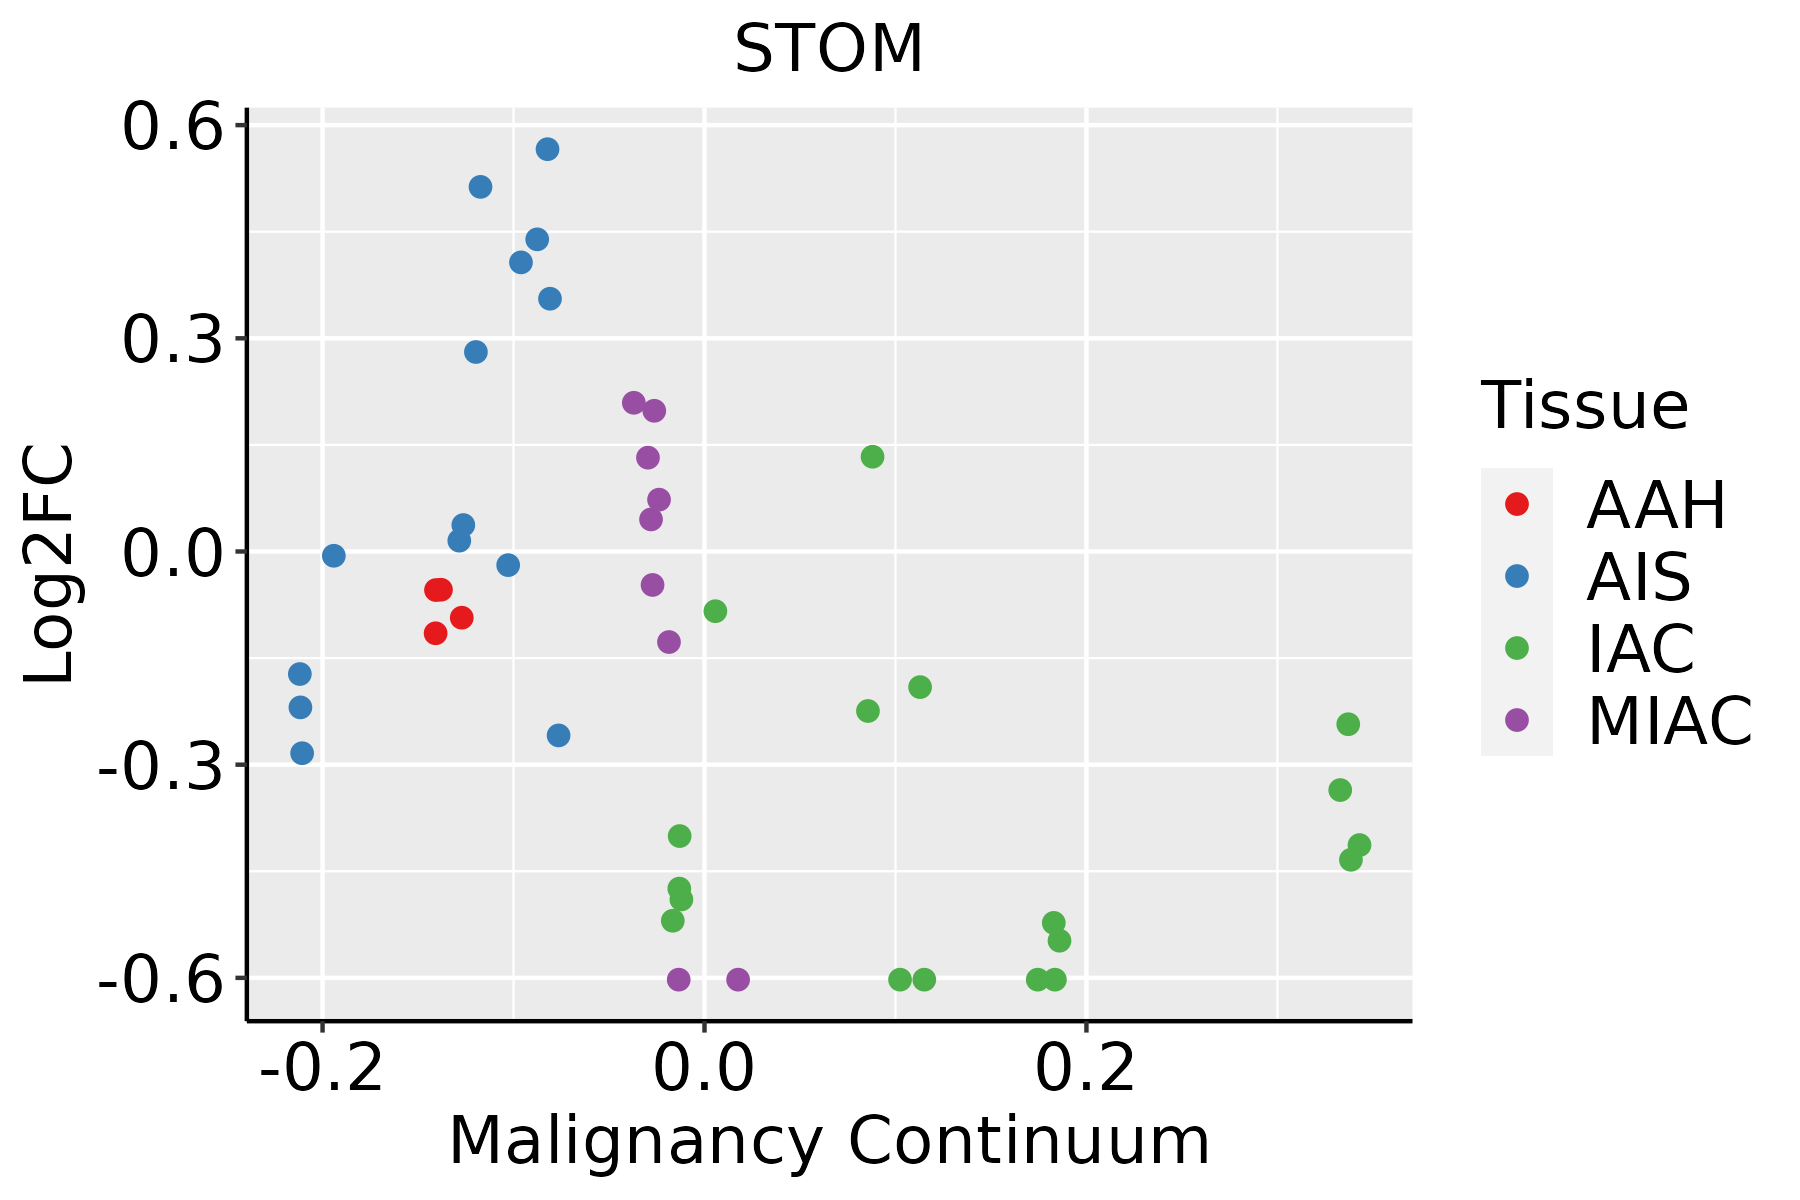 | AAH: Atypical adenomatous hyperplasia |
| AIS: Adenocarcinoma in situ | ||
| IAC: Invasive lung adenocarcinoma | ||
| MIA: Minimally invasive adenocarcinoma | ||
| Oral Cavity | 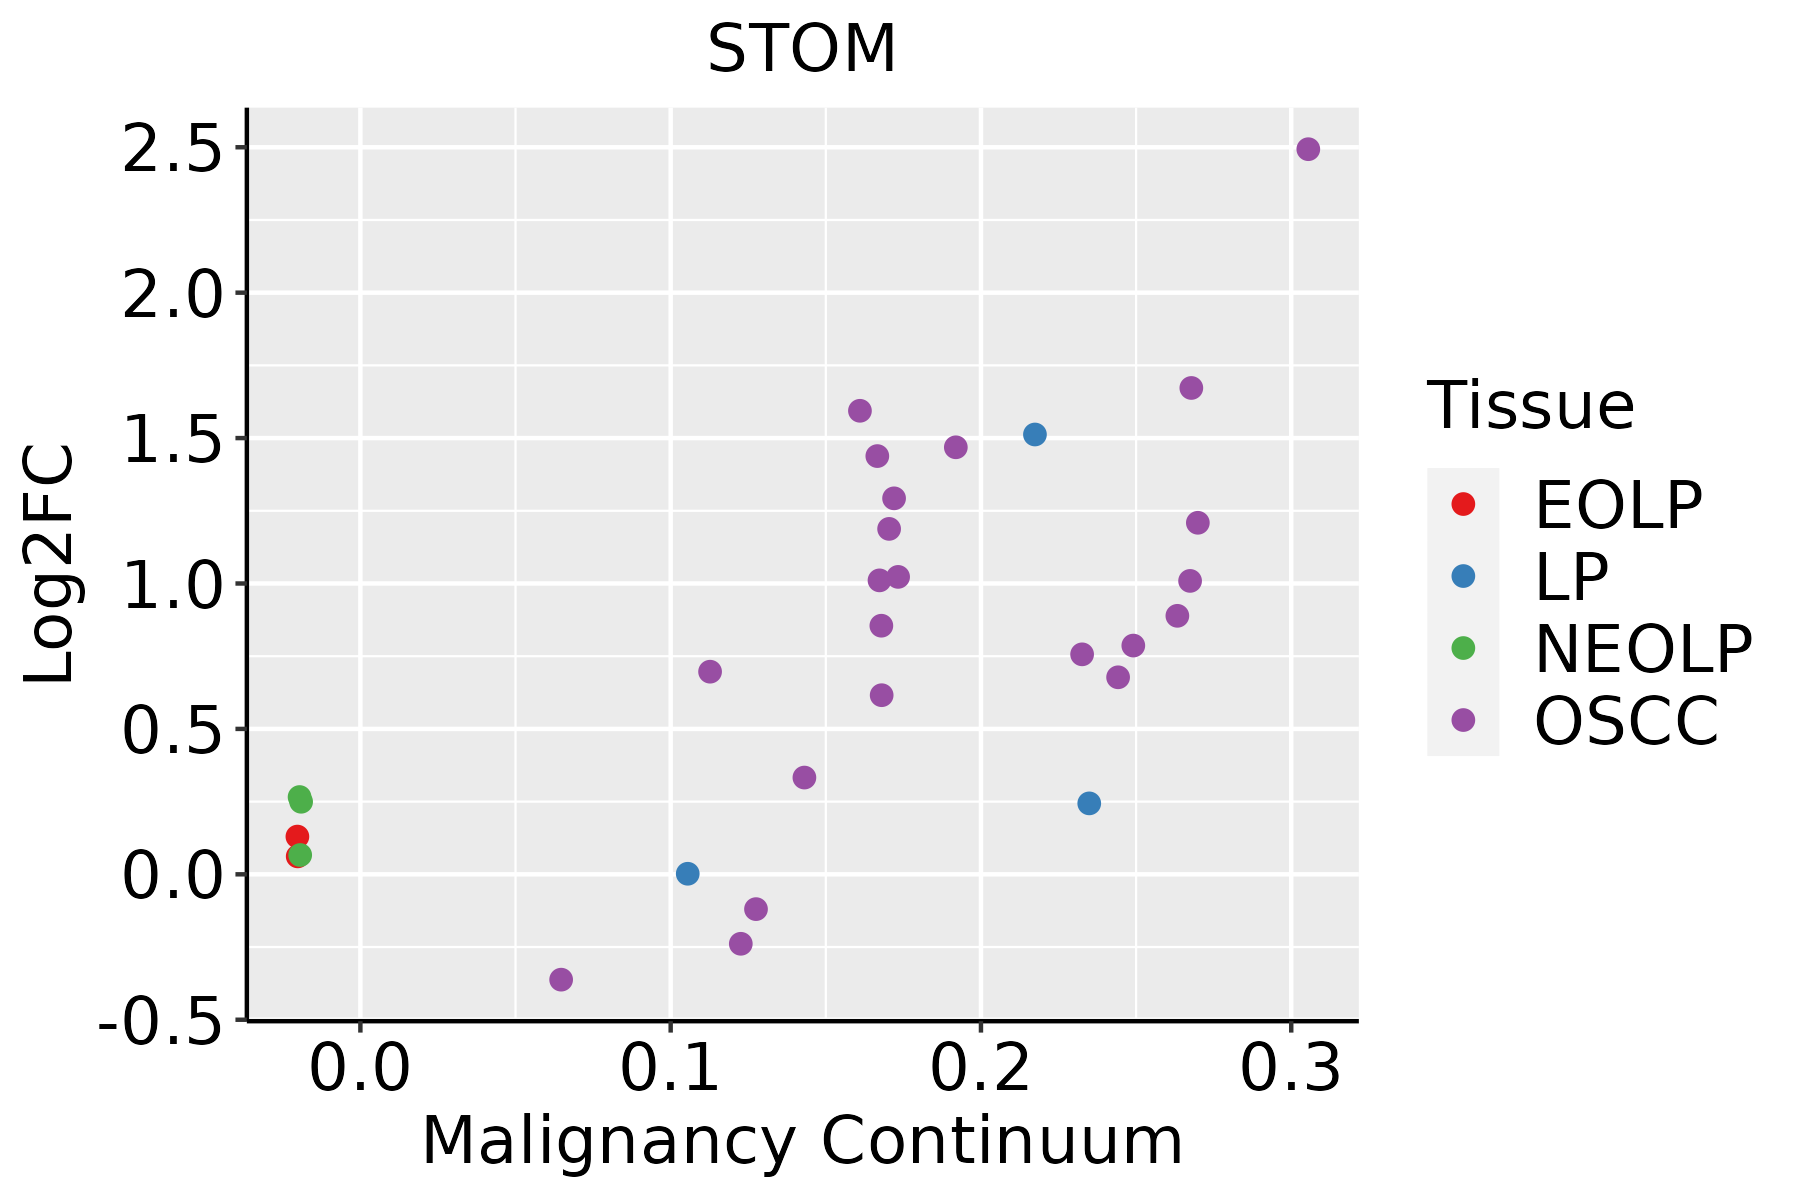 | EOLP: Erosive Oral lichen planus |
| LP: leukoplakia | ||
| NEOLP: Non-erosive oral lichen planus | ||
| OSCC: Oral squamous cell carcinoma | ||
| Prostate | 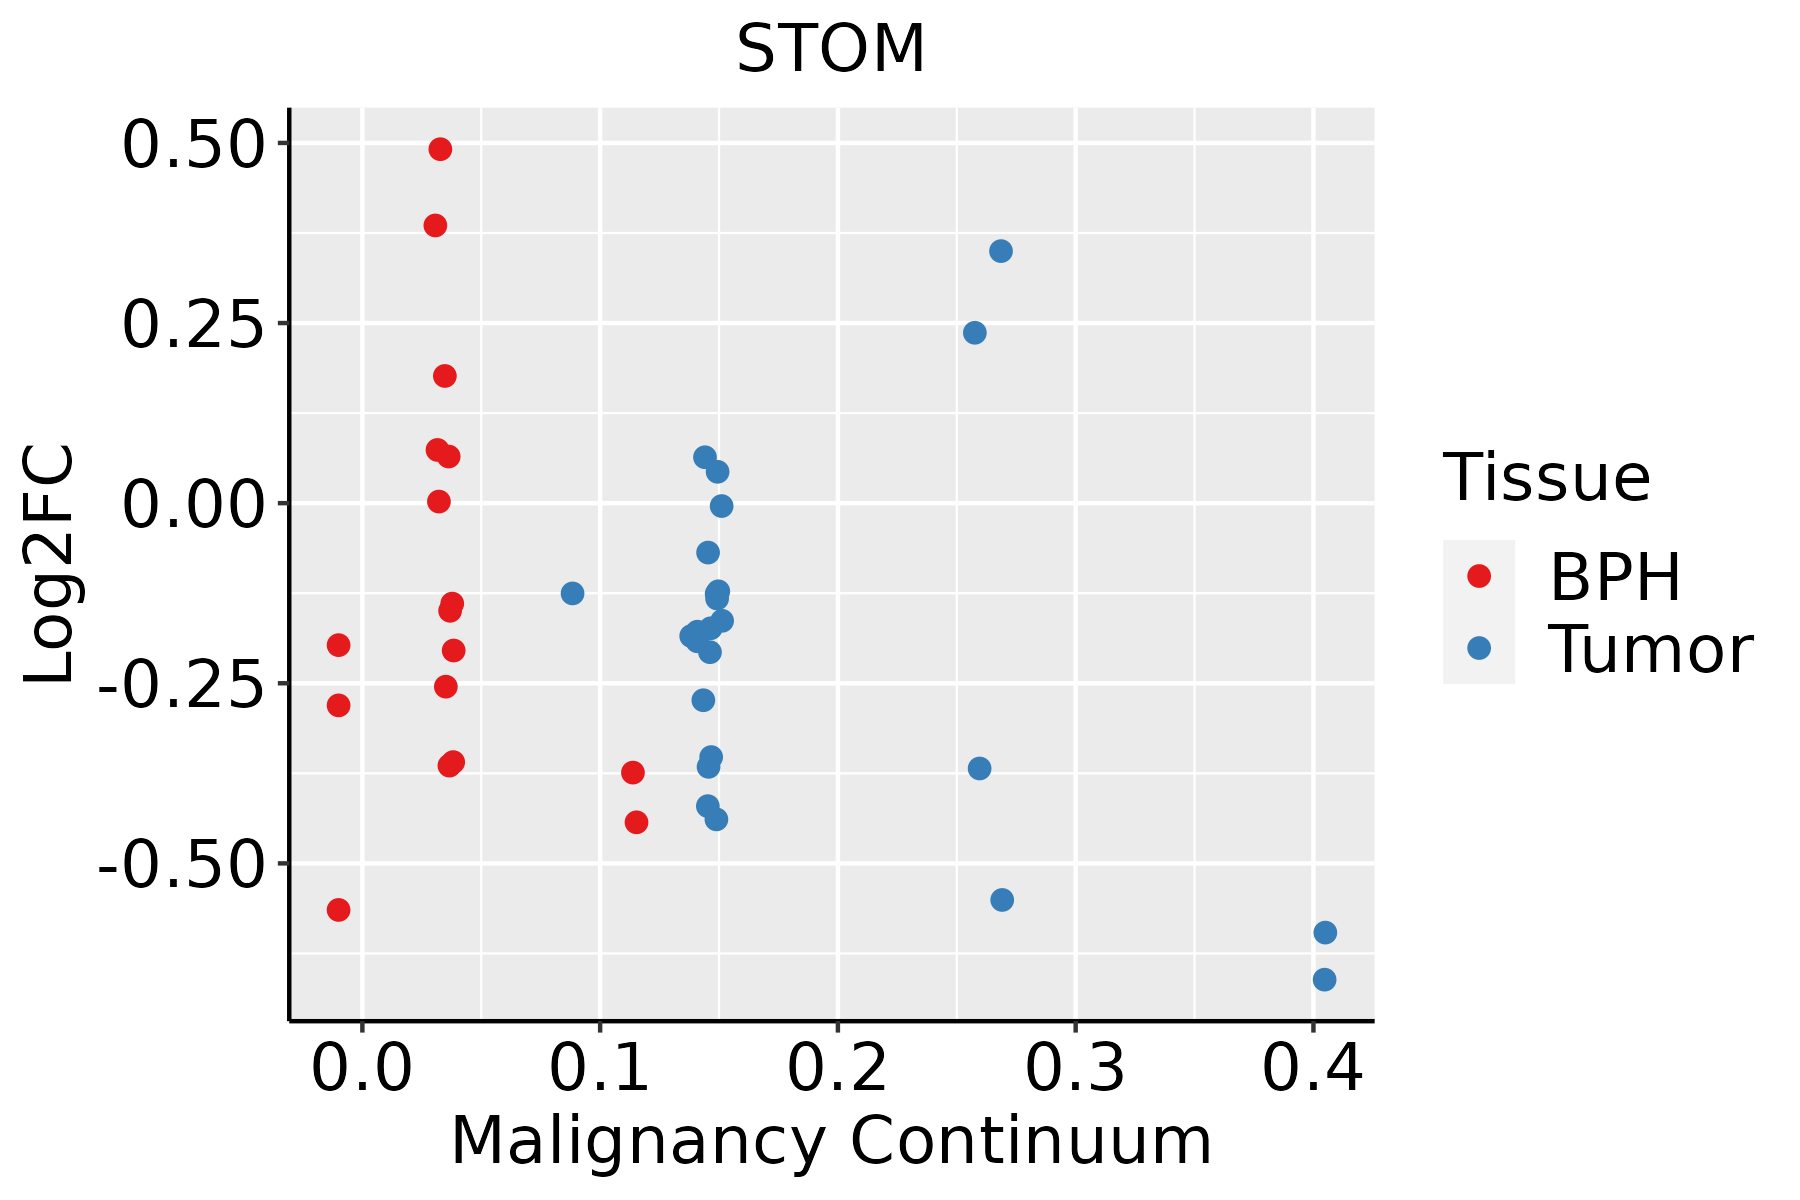 | BPH: Benign Prostatic Hyperplasia |
| Skin | 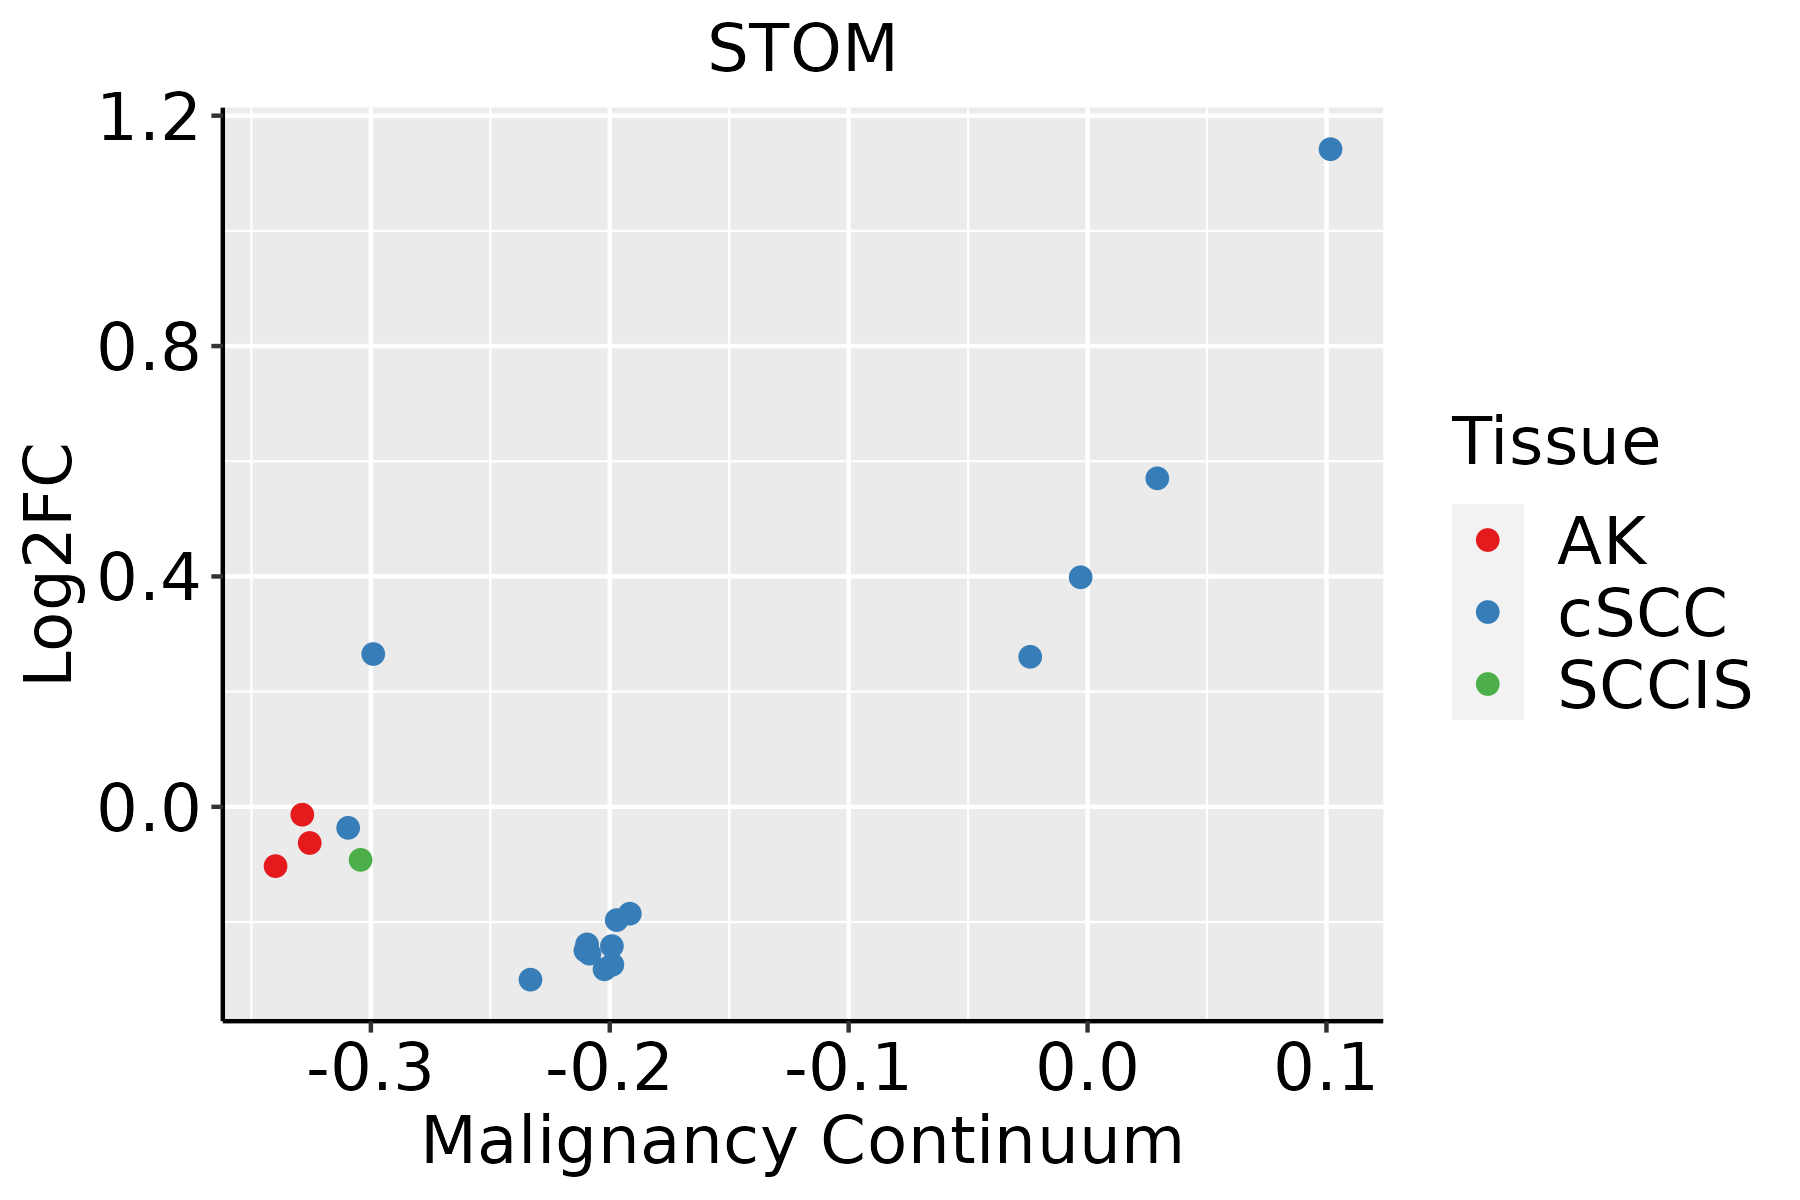 | AK: Actinic keratosis |
| cSCC: Cutaneous squamous cell carcinoma | ||
| SCCIS:squamous cell carcinoma in situ | ||
| Thyroid | 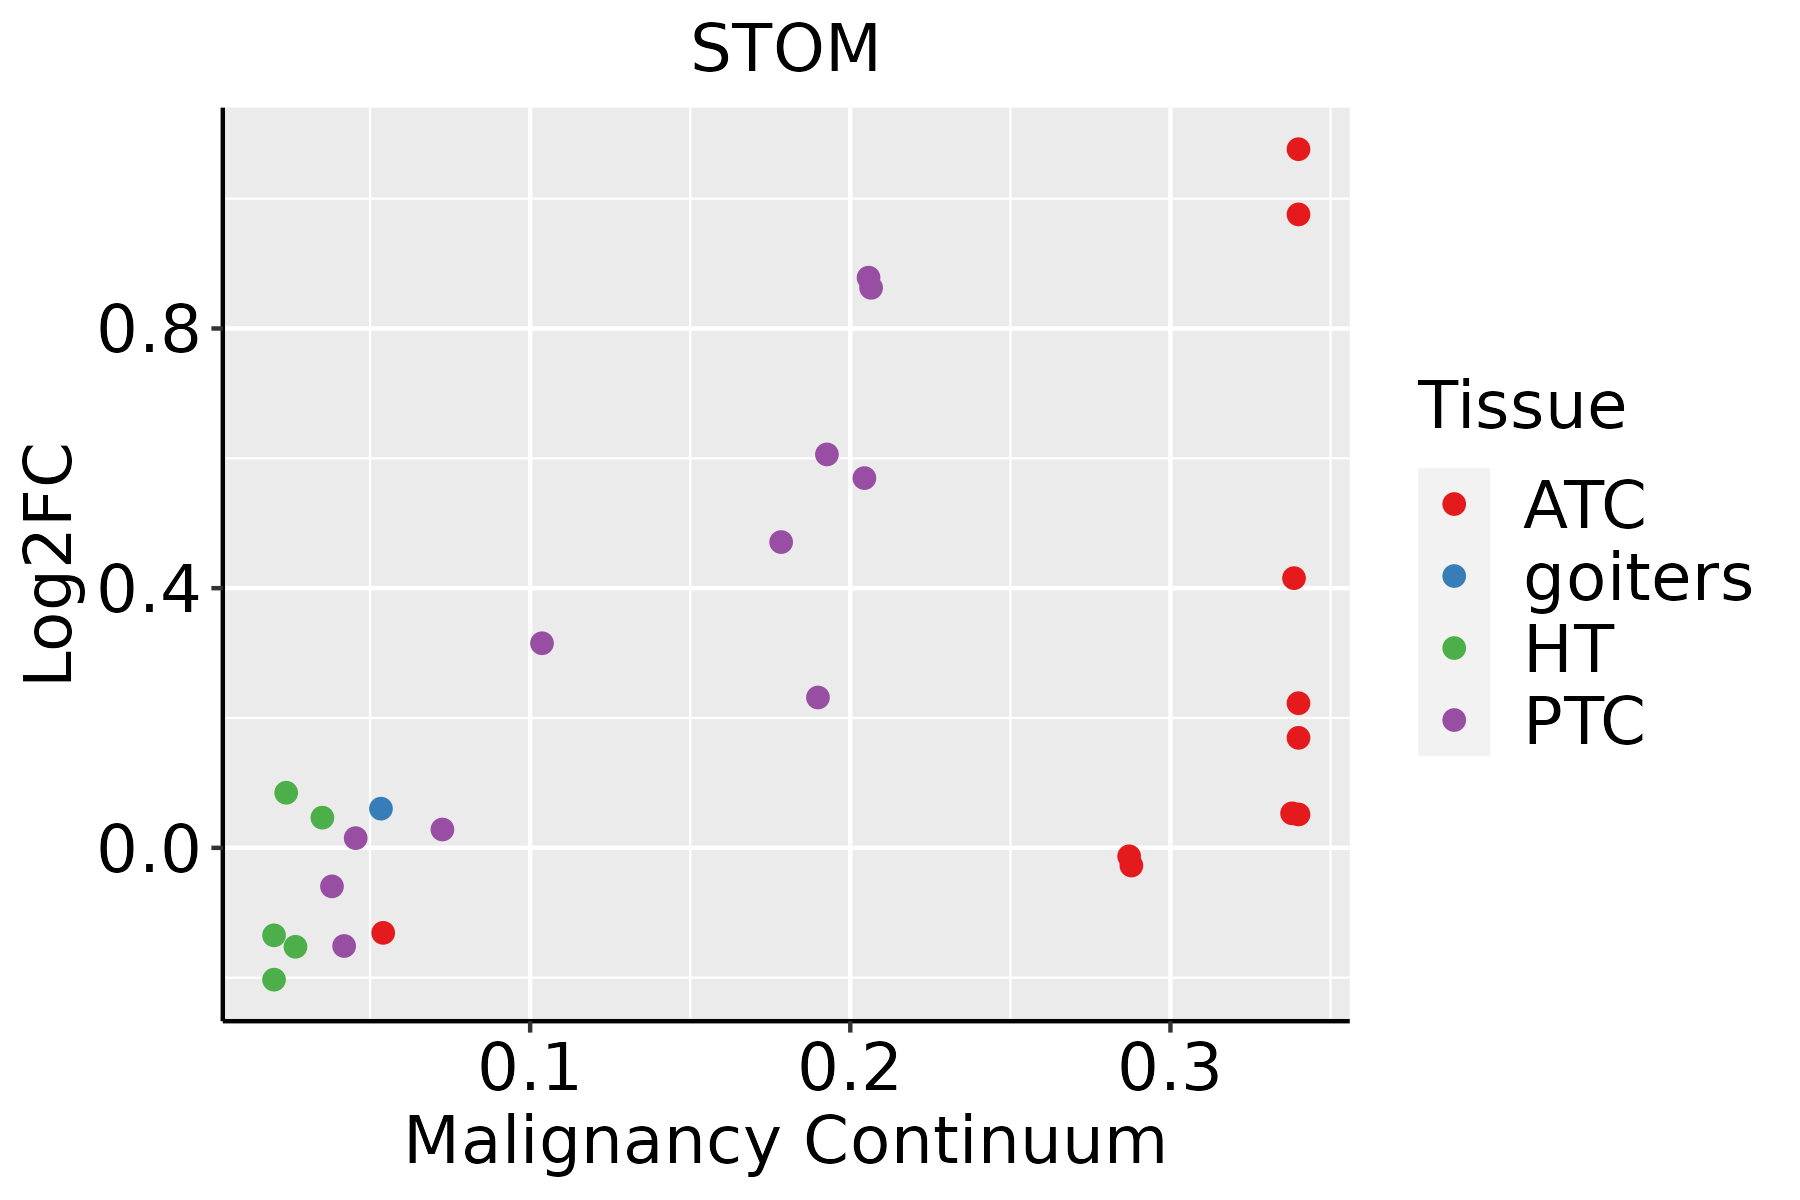 | ATC: Anaplastic thyroid cancer |
| HT: Hashimoto's thyroiditis | ||
| PTC: Papillary thyroid cancer |
| ∗log2FC in expression of this searched gene in stem-like cells from each diseased tissue sample relative to stem-like cells in normal samples in each tissue plotted against the malignancy continuum. Samples are colored based on if they are from different disease stage. |
Top |
Malignant transformation related pathway analysis |
| Find out the enriched GO biological processes and KEGG pathways involved in transition from healthy to precancer to cancer |
| Tissue | Disease Stage | Enriched GO biological Processes |
| Colorectum | AD |  |
| Colorectum | SER |  |
| Colorectum | MSS |  |
| Colorectum | MSI-H |  |
| Colorectum | FAP |  |
| ∗Top 15 enriched GO BP terms are showed in the bar plot of each disease state in each tissue. Each row represents a significant GO biological process which is colored according to the -log10(p.adjust). |
| Page: 1 2 3 4 5 6 7 8 9 |
| GO ID | Tissue | Disease Stage | Description | Gene Ratio | Bg Ratio | pvalue | p.adjust | Count |
| GO:00460349 | Breast | Precancer | ATP metabolic process | 82/1080 | 277/18723 | 1.94e-36 | 5.19e-33 | 82 |
| GO:00061199 | Breast | Precancer | oxidative phosphorylation | 53/1080 | 141/18723 | 1.15e-29 | 2.04e-26 | 53 |
| GO:00090608 | Breast | Precancer | aerobic respiration | 58/1080 | 189/18723 | 5.69e-27 | 7.62e-24 | 58 |
| GO:00060918 | Breast | Precancer | generation of precursor metabolites and energy | 94/1080 | 490/18723 | 1.54e-25 | 1.64e-22 | 94 |
| GO:00453338 | Breast | Precancer | cellular respiration | 59/1080 | 230/18723 | 5.97e-23 | 5.32e-20 | 59 |
| GO:00159808 | Breast | Precancer | energy derivation by oxidation of organic compounds | 70/1080 | 318/18723 | 8.33e-23 | 6.37e-20 | 70 |
| GO:19026008 | Breast | Precancer | proton transmembrane transport | 39/1080 | 157/18723 | 4.18e-15 | 1.18e-12 | 39 |
| GO:00159857 | Breast | Precancer | energy coupled proton transport, down electrochemical gradient | 16/1080 | 26/18723 | 4.15e-14 | 9.65e-12 | 16 |
| GO:00159867 | Breast | Precancer | ATP synthesis coupled proton transport | 16/1080 | 26/18723 | 4.15e-14 | 9.65e-12 | 16 |
| GO:00427766 | Breast | Precancer | mitochondrial ATP synthesis coupled proton transport | 13/1080 | 19/18723 | 1.43e-12 | 2.74e-10 | 13 |
| GO:00067547 | Breast | Precancer | ATP biosynthetic process | 21/1080 | 57/18723 | 2.31e-12 | 4.26e-10 | 21 |
| GO:00068398 | Breast | Precancer | mitochondrial transport | 45/1080 | 254/18723 | 1.37e-11 | 1.88e-09 | 45 |
| GO:00092067 | Breast | Precancer | purine ribonucleoside triphosphate biosynthetic process | 22/1080 | 68/18723 | 1.41e-11 | 1.88e-09 | 22 |
| GO:00091457 | Breast | Precancer | purine nucleoside triphosphate biosynthetic process | 22/1080 | 69/18723 | 1.95e-11 | 2.43e-09 | 22 |
| GO:00092017 | Breast | Precancer | ribonucleoside triphosphate biosynthetic process | 22/1080 | 74/18723 | 9.18e-11 | 1.00e-08 | 22 |
| GO:00091448 | Breast | Precancer | purine nucleoside triphosphate metabolic process | 24/1080 | 88/18723 | 9.66e-11 | 1.03e-08 | 24 |
| GO:00092057 | Breast | Precancer | purine ribonucleoside triphosphate metabolic process | 23/1080 | 82/18723 | 1.27e-10 | 1.34e-08 | 23 |
| GO:00091427 | Breast | Precancer | nucleoside triphosphate biosynthetic process | 23/1080 | 85/18723 | 2.82e-10 | 2.69e-08 | 23 |
| GO:00091997 | Breast | Precancer | ribonucleoside triphosphate metabolic process | 23/1080 | 89/18723 | 7.65e-10 | 6.66e-08 | 23 |
| GO:00091418 | Breast | Precancer | nucleoside triphosphate metabolic process | 26/1080 | 112/18723 | 7.72e-10 | 6.66e-08 | 26 |
| Page: 1 2 3 4 5 6 7 8 9 10 11 12 13 14 15 16 17 18 19 20 21 22 23 24 25 26 27 28 29 30 31 32 33 34 35 36 37 38 39 40 41 42 43 44 45 46 47 48 49 50 51 52 53 54 55 56 57 |
| Pathway ID | Tissue | Disease Stage | Description | Gene Ratio | Bg Ratio | pvalue | p.adjust | qvalue | Count |
| Page: 1 |
Top |
Cell-cell communication analysis |
| Identification of potential cell-cell interactions between two cell types and their ligand-receptor pairs for different disease states |
| Ligand | Receptor | LRpair | Pathway | Tissue | Disease Stage |
| Page: 1 |
Top |
Single-cell gene regulatory network inference analysis |
| Find out the significant the regulons (TFs) and the target genes of each regulon across cell types for different disease states |
| TF | Cell Type | Tissue | Disease Stage | Target Gene | RSS | Regulon Activity |
| ∗The dot plots of a searched regulon are shown for all cell subpopulations in each disease state of each tissue based on the regulon specific score inferred using pySCENIC and by calculating the average expression. |
| Page: 1 |
Top |
Somatic mutation of malignant transformation related genes |
| Annotation of somatic variants for genes involved in malignant transformation |
| Hugo Symbol | Variant Class | Variant Classification | dbSNP RS | HGVSc | HGVSp | HGVSp Short | SWISSPROT | BIOTYPE | SIFT | PolyPhen | Tumor Sample Barcode | Tissue | Histology | Sex | Age | Stage | Therapy Types | Drugs | Outcome |
| STOM | SNV | Missense_Mutation | c.863N>C | p.Gly288Ala | p.G288A | P27105 | protein_coding | tolerated(0.18) | benign(0) | TCGA-AN-A0FX-01 | Breast | breast invasive carcinoma | Female | <65 | I/II | Unknown | Unknown | SD | |
| STOM | SNV | Missense_Mutation | novel | c.545N>T | p.Thr182Ile | p.T182I | P27105 | protein_coding | deleterious(0) | probably_damaging(0.998) | TCGA-2W-A8YY-01 | Cervix | cervical & endocervical cancer | Female | <65 | I/II | Chemotherapy | cisplatin | CR |
| STOM | SNV | Missense_Mutation | rs747153047 | c.295N>G | p.Ile99Val | p.I99V | P27105 | protein_coding | tolerated(1) | benign(0.001) | TCGA-2W-A8YY-01 | Cervix | cervical & endocervical cancer | Female | <65 | I/II | Chemotherapy | cisplatin | CR |
| STOM | SNV | Missense_Mutation | novel | c.428N>A | p.Thr143Asn | p.T143N | P27105 | protein_coding | deleterious(0) | probably_damaging(0.993) | TCGA-IR-A3L7-01 | Cervix | cervical & endocervical cancer | Female | <65 | I/II | Chemotherapy | cisplatin | CR |
| STOM | SNV | Missense_Mutation | c.431N>A | p.Arg144His | p.R144H | P27105 | protein_coding | tolerated(0.09) | benign(0.168) | TCGA-G4-6302-01 | Colorectum | colon adenocarcinoma | Female | >=65 | I/II | Unknown | Unknown | SD | |
| STOM | SNV | Missense_Mutation | rs763192503 | c.572N>A | p.Arg191His | p.R191H | P27105 | protein_coding | deleterious(0) | probably_damaging(1) | TCGA-NH-A50T-01 | Colorectum | colon adenocarcinoma | Female | >=65 | I/II | Unknown | Unknown | SD |
| STOM | SNV | Missense_Mutation | rs201671242 | c.673N>A | p.Glu225Lys | p.E225K | P27105 | protein_coding | deleterious(0.02) | possibly_damaging(0.617) | TCGA-AG-A002-01 | Colorectum | rectum adenocarcinoma | Male | <65 | I/II | Unknown | Unknown | SD |
| STOM | SNV | Missense_Mutation | rs867557202 | c.299N>T | p.Ser100Leu | p.S100L | P27105 | protein_coding | deleterious(0) | possibly_damaging(0.672) | TCGA-EI-6917-01 | Colorectum | rectum adenocarcinoma | Male | <65 | III/IV | Chemotherapy | 5fluorouracil+oxaciplatina+l-folinian | SD |
| STOM | SNV | Missense_Mutation | novel | c.857N>G | p.His286Arg | p.H286R | P27105 | protein_coding | tolerated(0.17) | benign(0.003) | TCGA-F5-6814-01 | Colorectum | rectum adenocarcinoma | Male | <65 | I/II | Unknown | Unknown | SD |
| STOM | SNV | Missense_Mutation | novel | c.752N>A | p.Arg251Gln | p.R251Q | P27105 | protein_coding | deleterious(0) | probably_damaging(0.999) | TCGA-AJ-A3EL-01 | Endometrium | uterine corpus endometrioid carcinoma | Female | <65 | I/II | Unknown | Unknown | SD |
| Page: 1 2 |
Top |
Related drugs of malignant transformation related genes |
| Identification of chemicals and drugs interact with genes involved in malignant transfromation |
| (DGIdb 4.0) |
| Entrez ID | Symbol | Category | Interaction Types | Drug Claim Name | Drug Name | PMIDs |
| Page: 1 |

Copyright 2023-Present -The University of Texas Health Science Center at Houston |