Schematic overview of the cellular and molecular mechanisms involved in the cancer progression, including the proposed cellular and molecular mechanisms in cancer cells trajectory. AT1: alveolar type 1 cells; AT2: alveolar type 2 cells; AAH: atypical adenomatous hyperplasia; AIS: adenocarcinoma in situ; MIA: minimally invasive adenocarcinoma; IA: invasive adenocarcinoma; EMT: epithelial-mesenchymal transition

Home

Download

Statistics

Help

Contact

Center for Computational Systems Medicine
leaf

Gene summary

leaf

Malignant transformation analysis

leaf

Malignant transformation related pathway analysis

leaf

Cell-cell communication analysis

leaf

Single-cell gene regulatory network inference analysis

leaf

Somatic mutation of malignant transformation related genes

leaf

Related drugs of malignant transformation related genes

Gene: STMN3

Gene summary for STMN3

check button Gene summary.

Gene informationSpeciesHuman
Gene symbol

STMN3

Gene ID

50861

Gene namestathmin 3
Gene AliasSCLIP
Cytomap20q13.33
Gene Typeprotein-coding
GO ID

GO:0000226

UniProtAcc

Q9NZ72


Top

Malignant transformation analysis

check button Identification of the aberrant gene expression in precancerous and cancerous lesions by comparing the gene expression of stem-like cells in diseased tissues with normal stem cells
check button Malignant transformation involving gene list.
Entrez IDSymbolReplicatesSpeciesOrganTissueAdj P-valueLog2FCMalignancy
50861STMN3LZE4THumanEsophagusESCC5.01e-032.36e-010.0811
50861STMN3LZE8THumanEsophagusESCC1.77e-021.56e-010.067
50861STMN3P2T-EHumanEsophagusESCC6.96e-092.13e-010.1177
50861STMN3P4T-EHumanEsophagusESCC2.06e-041.52e-010.1323
50861STMN3P9T-EHumanEsophagusESCC1.37e-062.21e-010.1131
50861STMN3P10T-EHumanEsophagusESCC1.29e-316.10e-010.116
50861STMN3P11T-EHumanEsophagusESCC6.88e-053.18e-010.1426
50861STMN3P12T-EHumanEsophagusESCC7.62e-488.30e-010.1122
50861STMN3P16T-EHumanEsophagusESCC4.32e-541.20e+000.1153
50861STMN3P19T-EHumanEsophagusESCC1.32e-106.77e-010.1662
50861STMN3P20T-EHumanEsophagusESCC3.93e-256.91e-010.1124
50861STMN3P21T-EHumanEsophagusESCC1.60e-133.23e-010.1617
50861STMN3P22T-EHumanEsophagusESCC1.18e-113.17e-010.1236
50861STMN3P23T-EHumanEsophagusESCC2.48e-031.56e-010.108
50861STMN3P24T-EHumanEsophagusESCC2.74e-143.86e-010.1287
50861STMN3P26T-EHumanEsophagusESCC1.09e-143.09e-010.1276
50861STMN3P27T-EHumanEsophagusESCC6.94e-051.57e-010.1055
50861STMN3P28T-EHumanEsophagusESCC1.22e-041.79e-010.1149
50861STMN3P30T-EHumanEsophagusESCC2.11e-033.35e-010.137
50861STMN3P31T-EHumanEsophagusESCC1.96e-061.82e-010.1251
Page: 1 2 3 4 

check button Transcriptomic changes along malignancy continuum.
TissueExpression DynamicsAbbreviation
EsophagusThe image shows the transcriptomic changes along malignancy continuum.log2FC in expression of this searched gene in stem-like cells from each diseased tissue sample relative to stem-like cells in normal samples in each tissue plotted against the malignancy continuum. Samples are colored based on if they are from different disease stage.
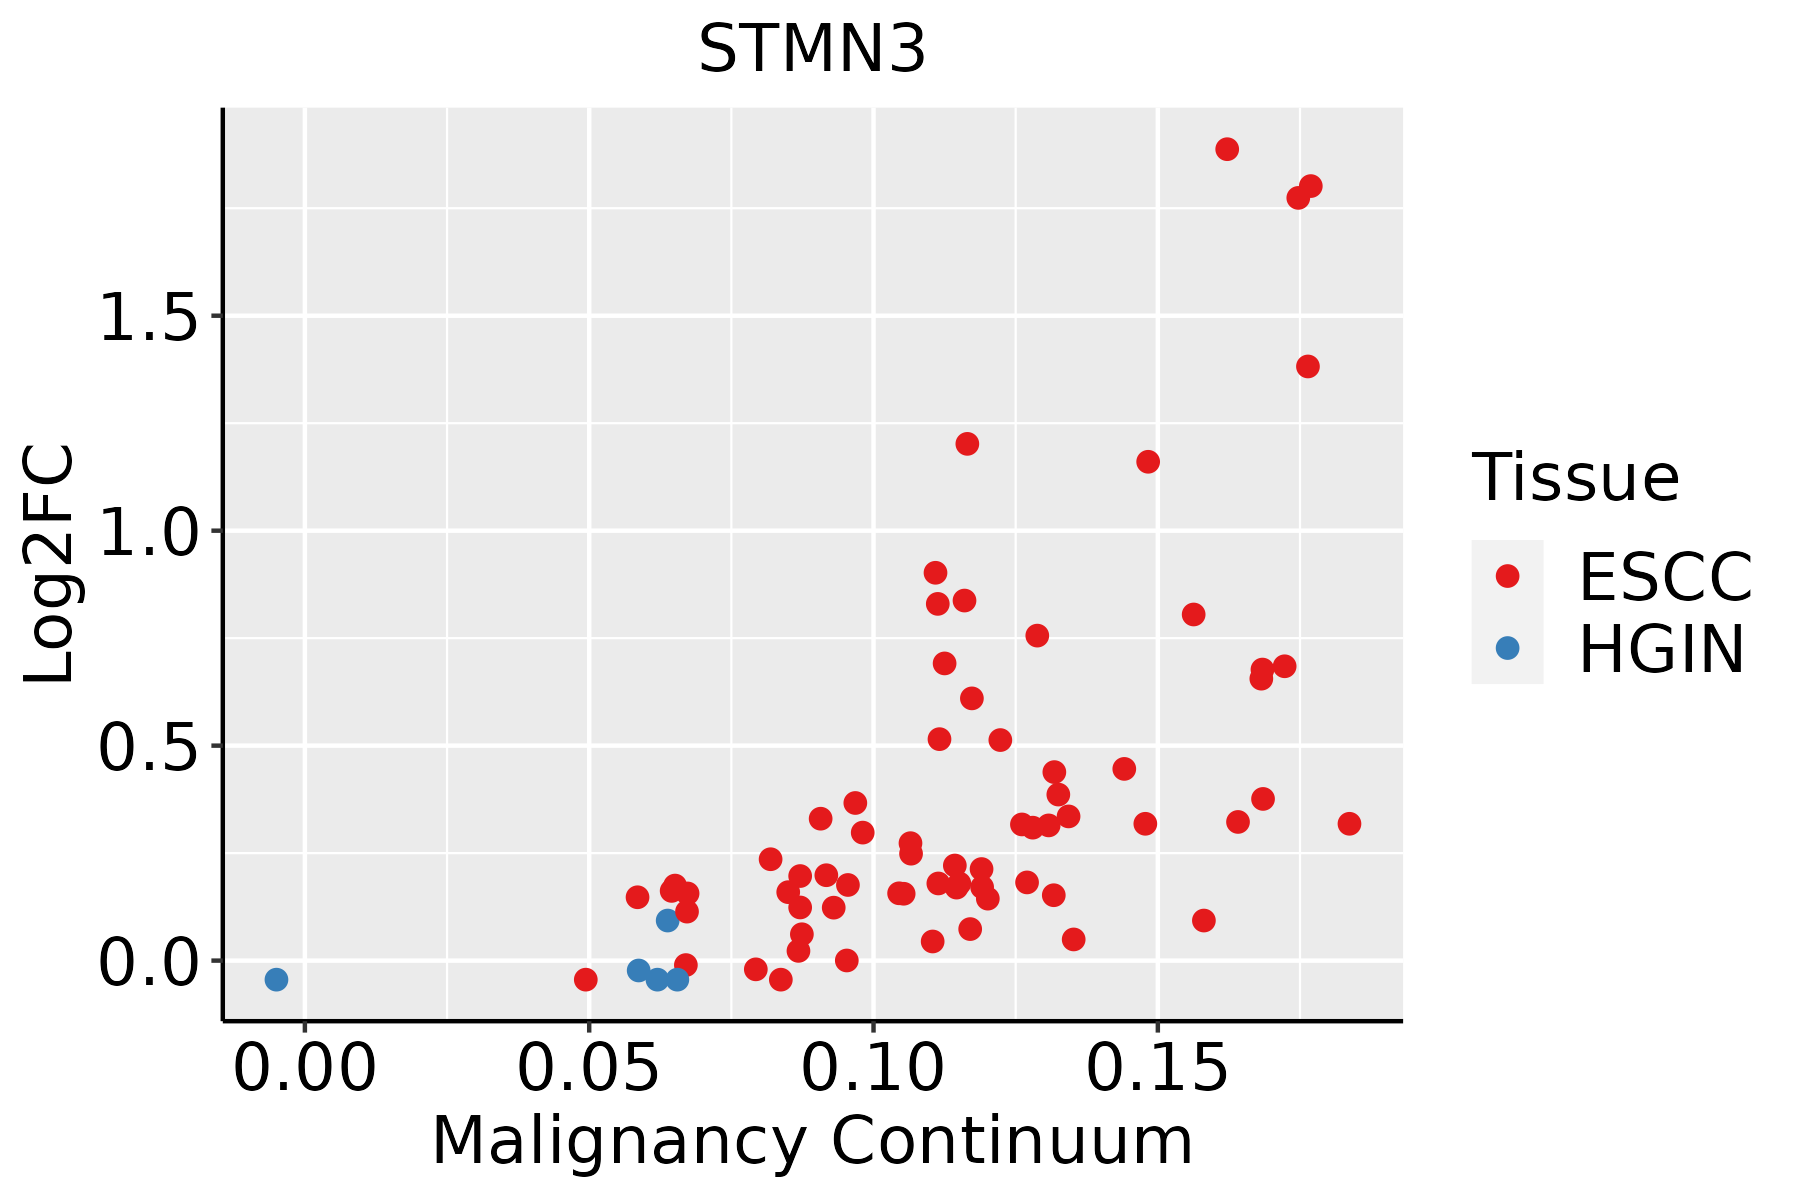
ESCC: Esophageal squamous cell carcinoma
HGIN: High-grade intraepithelial neoplasias
LGIN: Low-grade intraepithelial neoplasias
LiverThe image shows the transcriptomic changes along malignancy continuum.log2FC in expression of this searched gene in stem-like cells from each diseased tissue sample relative to stem-like cells in normal samples in each tissue plotted against the malignancy continuum. Samples are colored based on if they are from different disease stage.
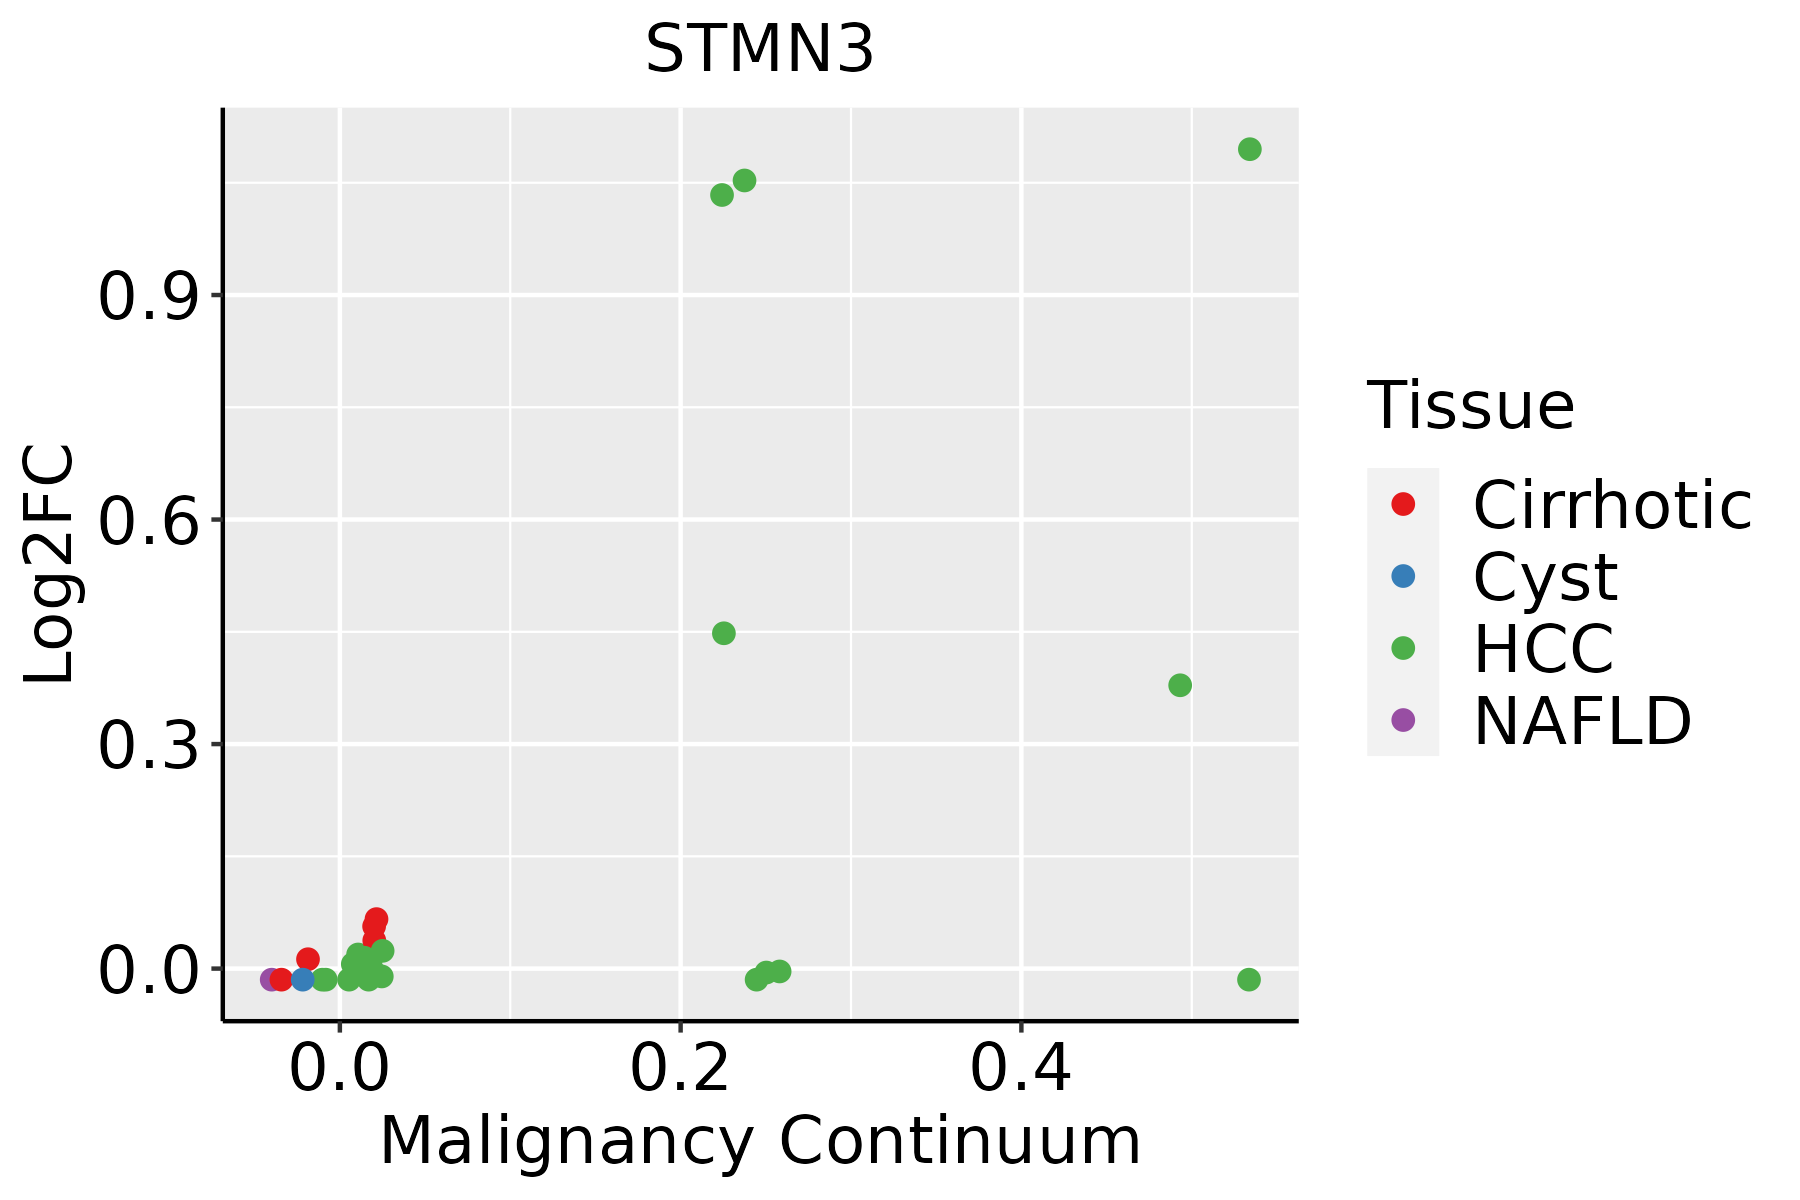
HCC: Hepatocellular carcinoma
NAFLD: Non-alcoholic fatty liver disease
Oral CavityThe image shows the transcriptomic changes along malignancy continuum.log2FC in expression of this searched gene in stem-like cells from each diseased tissue sample relative to stem-like cells in normal samples in each tissue plotted against the malignancy continuum. Samples are colored based on if they are from different disease stage.
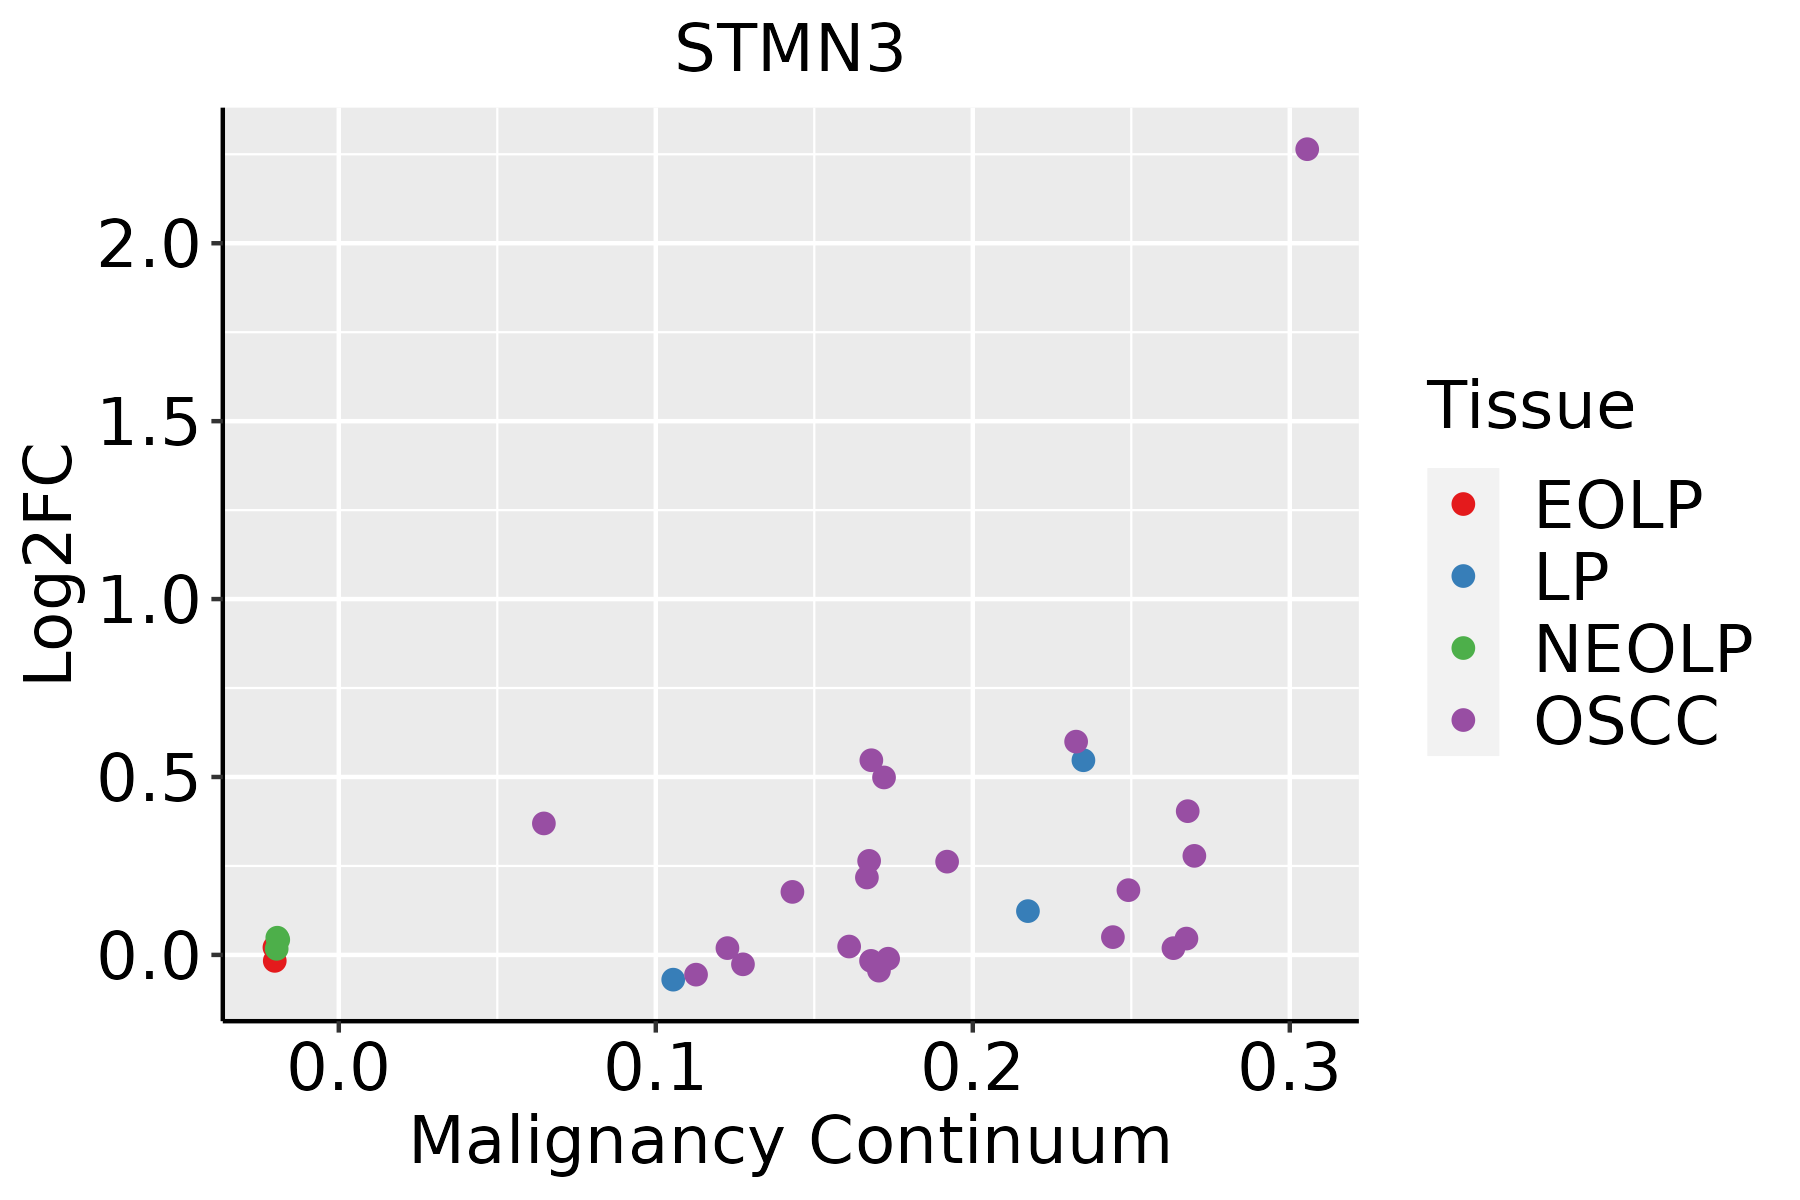
EOLP: Erosive Oral lichen planus
LP: leukoplakia
NEOLP: Non-erosive oral lichen planus
OSCC: Oral squamous cell carcinoma
ThyroidThe image shows the transcriptomic changes along malignancy continuum.log2FC in expression of this searched gene in stem-like cells from each diseased tissue sample relative to stem-like cells in normal samples in each tissue plotted against the malignancy continuum. Samples are colored based on if they are from different disease stage.
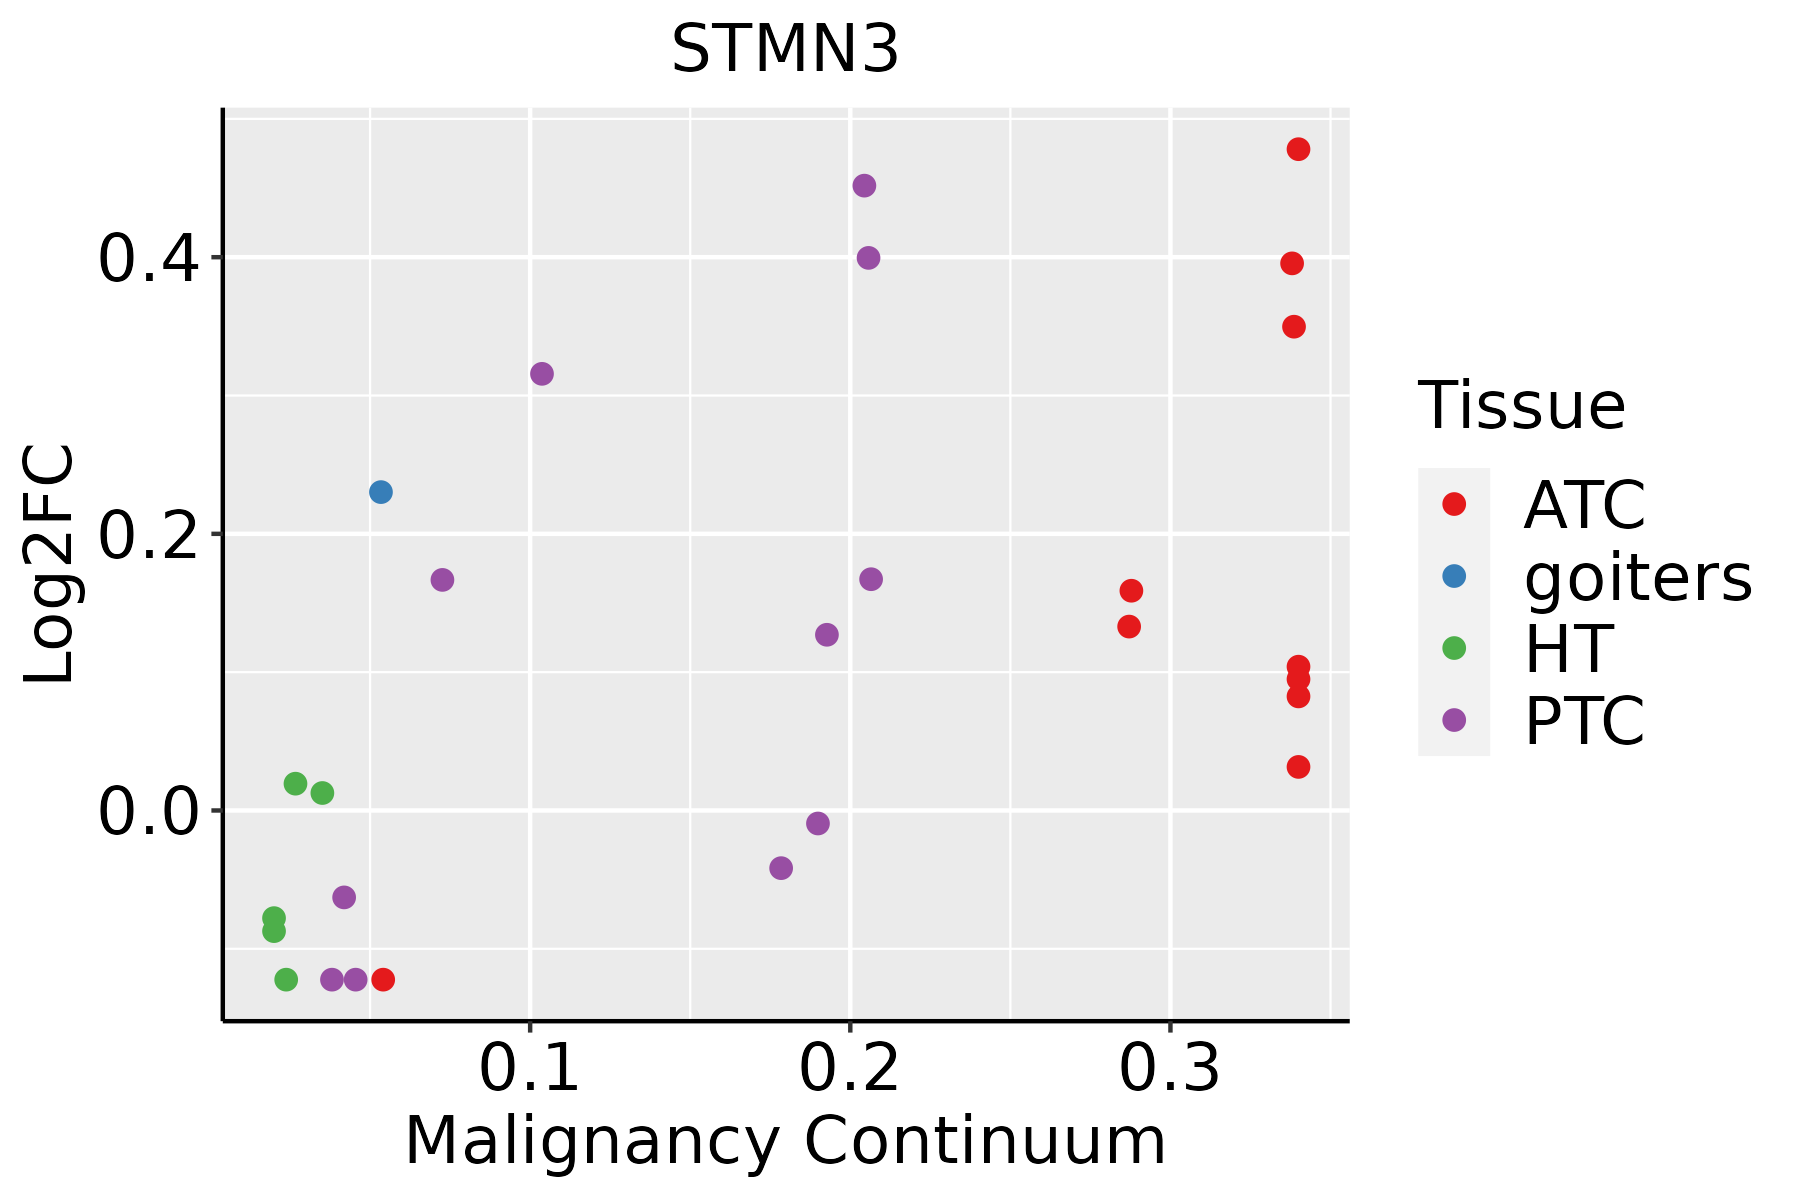
ATC: Anaplastic thyroid cancer
HT: Hashimoto's thyroiditis
PTC: Papillary thyroid cancer
∗log2FC in expression of this searched gene in stem-like cells from each diseased tissue sample relative to stem-like cells in normal samples in each tissue plotted against the malignancy continuum. Samples are colored based on if they are from different disease stage.

Top

Malignant transformation related pathway analysis

check buttonFind out the enriched GO biological processes and KEGG pathways involved in transition from healthy to precancer to cancer
check button Figure of enriched GO biological processes.
TissueDisease StageEnriched GO biological Processes
ColorectumADGO analysis - Figure of enriched GO biological processes: Top 15 enriched GO BP terms are showed in the bar plot of each disease state in each tissue. Each row represents a significant GO biological process which is colored according to the -log10(p.adjust).
ColorectumSERGO analysis - Figure of enriched GO biological processes: Top 15 enriched GO BP terms are showed in the bar plot of each disease state in each tissue. Each row represents a significant GO biological process which is colored according to the -log10(p.adjust).
ColorectumMSSGO analysis - Figure of enriched GO biological processes: Top 15 enriched GO BP terms are showed in the bar plot of each disease state in each tissue. Each row represents a significant GO biological process which is colored according to the -log10(p.adjust).
ColorectumMSI-HGO analysis - Figure of enriched GO biological processes: Top 15 enriched GO BP terms are showed in the bar plot of each disease state in each tissue. Each row represents a significant GO biological process which is colored according to the -log10(p.adjust).
ColorectumFAPGO analysis - Figure of enriched GO biological processes: Top 15 enriched GO BP terms are showed in the bar plot of each disease state in each tissue. Each row represents a significant GO biological process which is colored according to the -log10(p.adjust).
∗Top 15 enriched GO BP terms are showed in the bar plot of each disease state in each tissue. Each row represents a significant GO biological process which is colored according to the -log10(p.adjust).
Page: 1 2 3 4 5 6 7 8 9 

check button Enriched GO biological processes.
GO IDTissueDisease StageDescriptionGene RatioBg Ratiopvaluep.adjustCount
GO:0022411111EsophagusESCCcellular component disassembly305/8552443/187231.94e-234.57e-21305
GO:000170119EsophagusESCCin utero embryonic development243/8552367/187231.00e-156.86e-14243
GO:003298416EsophagusESCCprotein-containing complex disassembly151/8552224/187233.45e-111.15e-09151
GO:00705078EsophagusESCCregulation of microtubule cytoskeleton organization99/8552148/187231.43e-072.29e-0699
GO:000726510EsophagusESCCRas protein signal transduction201/8552337/187231.44e-072.30e-06201
GO:000182412EsophagusESCCblastocyst development73/8552106/187231.13e-061.40e-0573
GO:00166019EsophagusESCCRac protein signal transduction33/855242/187231.35e-051.23e-0433
GO:00311094EsophagusESCCmicrotubule polymerization or depolymerization77/8552122/187237.60e-055.68e-0477
GO:00311104EsophagusESCCregulation of microtubule polymerization or depolymerization57/855288/187232.32e-041.44e-0357
GO:00311227EsophagusESCCcytoplasmic microtubule organization38/855256/187236.60e-043.50e-0338
GO:00328864EsophagusESCCregulation of microtubule-based process134/8552240/187239.44e-044.80e-03134
GO:0035020EsophagusESCCregulation of Rac protein signal transduction17/855221/187231.03e-035.19e-0317
GO:00465789EsophagusESCCregulation of Ras protein signal transduction106/8552189/187232.49e-031.08e-02106
GO:00436245EsophagusESCCcellular protein complex disassembly78/8552136/187234.00e-031.62e-0278
GO:004308715EsophagusESCCregulation of GTPase activity183/8552348/187235.34e-032.00e-02183
GO:005105610EsophagusESCCregulation of small GTPase mediated signal transduction157/8552302/187231.55e-024.98e-02157
GO:002241112LiverHCCcellular component disassembly282/7958443/187231.02e-191.38e-17282
GO:003298411LiverHCCprotein-containing complex disassembly138/7958224/187235.59e-091.46e-07138
GO:000170111LiverHCCin utero embryonic development204/7958367/187232.44e-074.30e-06204
GO:000726521LiverHCCRas protein signal transduction187/7958337/187238.89e-071.35e-05187
Page: 1 2 3 4 

check button Enriched KEGG pathways.
Pathway IDTissueDisease StageDescriptionGene RatioBg Ratiopvaluep.adjustqvalueCount
Page: 1 

Top

Cell-cell communication analysis

check buttonIdentification of potential cell-cell interactions between two cell types and their ligand-receptor pairs for different disease states
LigandReceptorLRpairPathwayTissueDisease Stage
Page: 1 

Top

Single-cell gene regulatory network inference analysis

check buttonFind out the significant the regulons (TFs) and the target genes of each regulon across cell types for different disease states
TFCell TypeTissueDisease StageTarget GeneRSSRegulon Activity
∗The dot plots of a searched regulon are shown for all cell subpopulations in each disease state of each tissue based on the regulon specific score inferred using pySCENIC and by calculating the average expression.
Page: 1 

Top

Somatic mutation of malignant transformation related genes

check buttonAnnotation of somatic variants for genes involved in malignant transformation
Hugo SymbolVariant ClassVariant ClassificationdbSNP RSHGVScHGVSpHGVSp ShortSWISSPROTBIOTYPESIFTPolyPhenTumor Sample BarcodeTissueHistologySexAgeStageTherapy TypesDrugsOutcome
STMN3insertionFrame_Shift_Insnovelc.217_218insGGAGGCAGCCGAGGAGCGGAGGAAGGCAAGGAGTCCTCp.Ser73TrpfsTer45p.S73Wfs*45Q9NZ72protein_codingTCGA-AN-A0AS-01Breastbreast invasive carcinomaFemale>=65III/IVUnknownUnknownSD
STMN3insertionNonsense_Mutationnovelc.77_78insATGTAAGAAAGTGTTGCCTAGATCCTCCATGGACTCp.Tyr26delinsTerp.Y26delins*Q9NZ72protein_codingTCGA-AO-A0J7-01Breastbreast invasive carcinomaFemale>=65I/IIChemotherapydoxorubicinSD
STMN3SNVMissense_Mutationrs556068883c.100N>Ap.Val34Ilep.V34IQ9NZ72protein_codingtolerated(1)benign(0)TCGA-EA-A410-01Cervixcervical & endocervical cancerFemale<65I/IIUnknownUnknownSD
STMN3SNVMissense_Mutationc.484G>Cp.Glu162Glnp.E162QQ9NZ72protein_codingdeleterious(0.01)probably_damaging(0.996)TCGA-EK-A3GJ-01Cervixcervical & endocervical cancerFemale<65I/IIUnknownUnknownSD
STMN3SNVMissense_Mutationc.268G>Cp.Glu90Glnp.E90QQ9NZ72protein_codingdeleterious(0.03)probably_damaging(0.994)TCGA-EK-A3GJ-01Cervixcervical & endocervical cancerFemale<65I/IIUnknownUnknownSD
STMN3SNVMissense_Mutationnovelc.361N>Tp.Ala121Serp.A121SQ9NZ72protein_codingdeleterious(0)possibly_damaging(0.711)TCGA-5M-AAT4-01Colorectumcolon adenocarcinomaMale>=65III/IVUnknownUnknownPD
STMN3SNVMissense_Mutationrs772960740c.478G>Cp.Glu160Glnp.E160QQ9NZ72protein_codingdeleterious(0.02)probably_damaging(0.997)TCGA-EI-6507-01Colorectumrectum adenocarcinomaMale<65I/IIUnknownUnknownSD
STMN3SNVMissense_Mutationnovelc.194N>Tp.Ser65Phep.S65FQ9NZ72protein_codingdeleterious(0.01)possibly_damaging(0.892)TCGA-A5-A0G1-01Endometriumuterine corpus endometrioid carcinomaFemale>=65I/IIUnknownUnknownSD
STMN3SNVMissense_Mutationc.149N>Tp.Ser50Leup.S50LQ9NZ72protein_codingdeleterious(0)probably_damaging(0.994)TCGA-AP-A1DO-01Endometriumuterine corpus endometrioid carcinomaFemale<65I/IIUnknownUnknownSD
STMN3SNVMissense_Mutationnovelc.27G>Tp.Lys9Asnp.K9NQ9NZ72protein_codingdeleterious(0)benign(0.36)TCGA-AP-A1DV-01Endometriumuterine corpus endometrioid carcinomaFemale<65I/IIUnknownUnknownSD
Page: 1 2 3 

Top

Related drugs of malignant transformation related genes

check buttonIdentification of chemicals and drugs interact with genes involved in malignant transfromation
(DGIdb 4.0)
Entrez IDSymbolCategoryInteraction TypesDrug Claim NameDrug NamePMIDs
Page: 1