| Tissue | Expression Dynamics | Abbreviation |
| Breast | 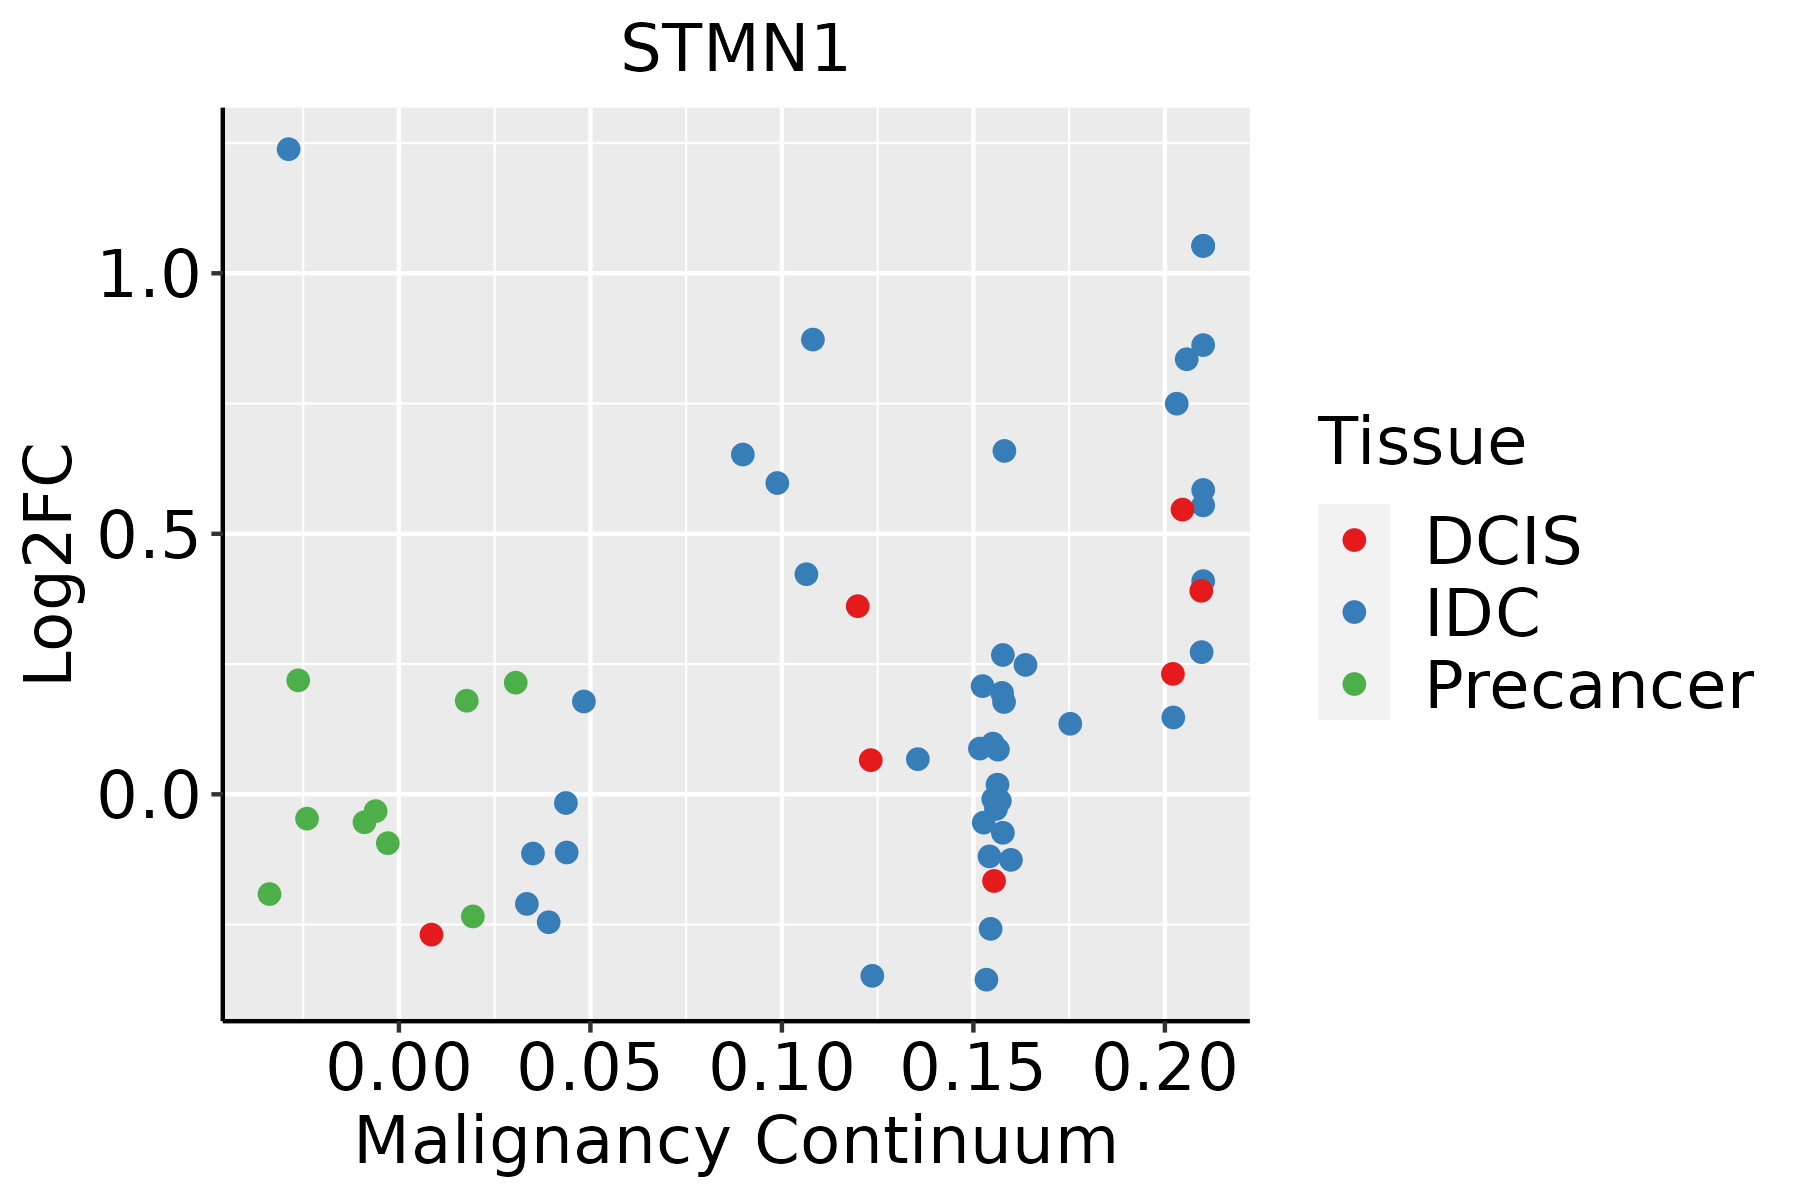 | IDC: Invasive ductal carcinoma |
| DCIS: Ductal carcinoma in situ |
| Precancer(BRCA1-mut): Precancerous lesion from BRCA1 mutation carriers |
| Cervix | 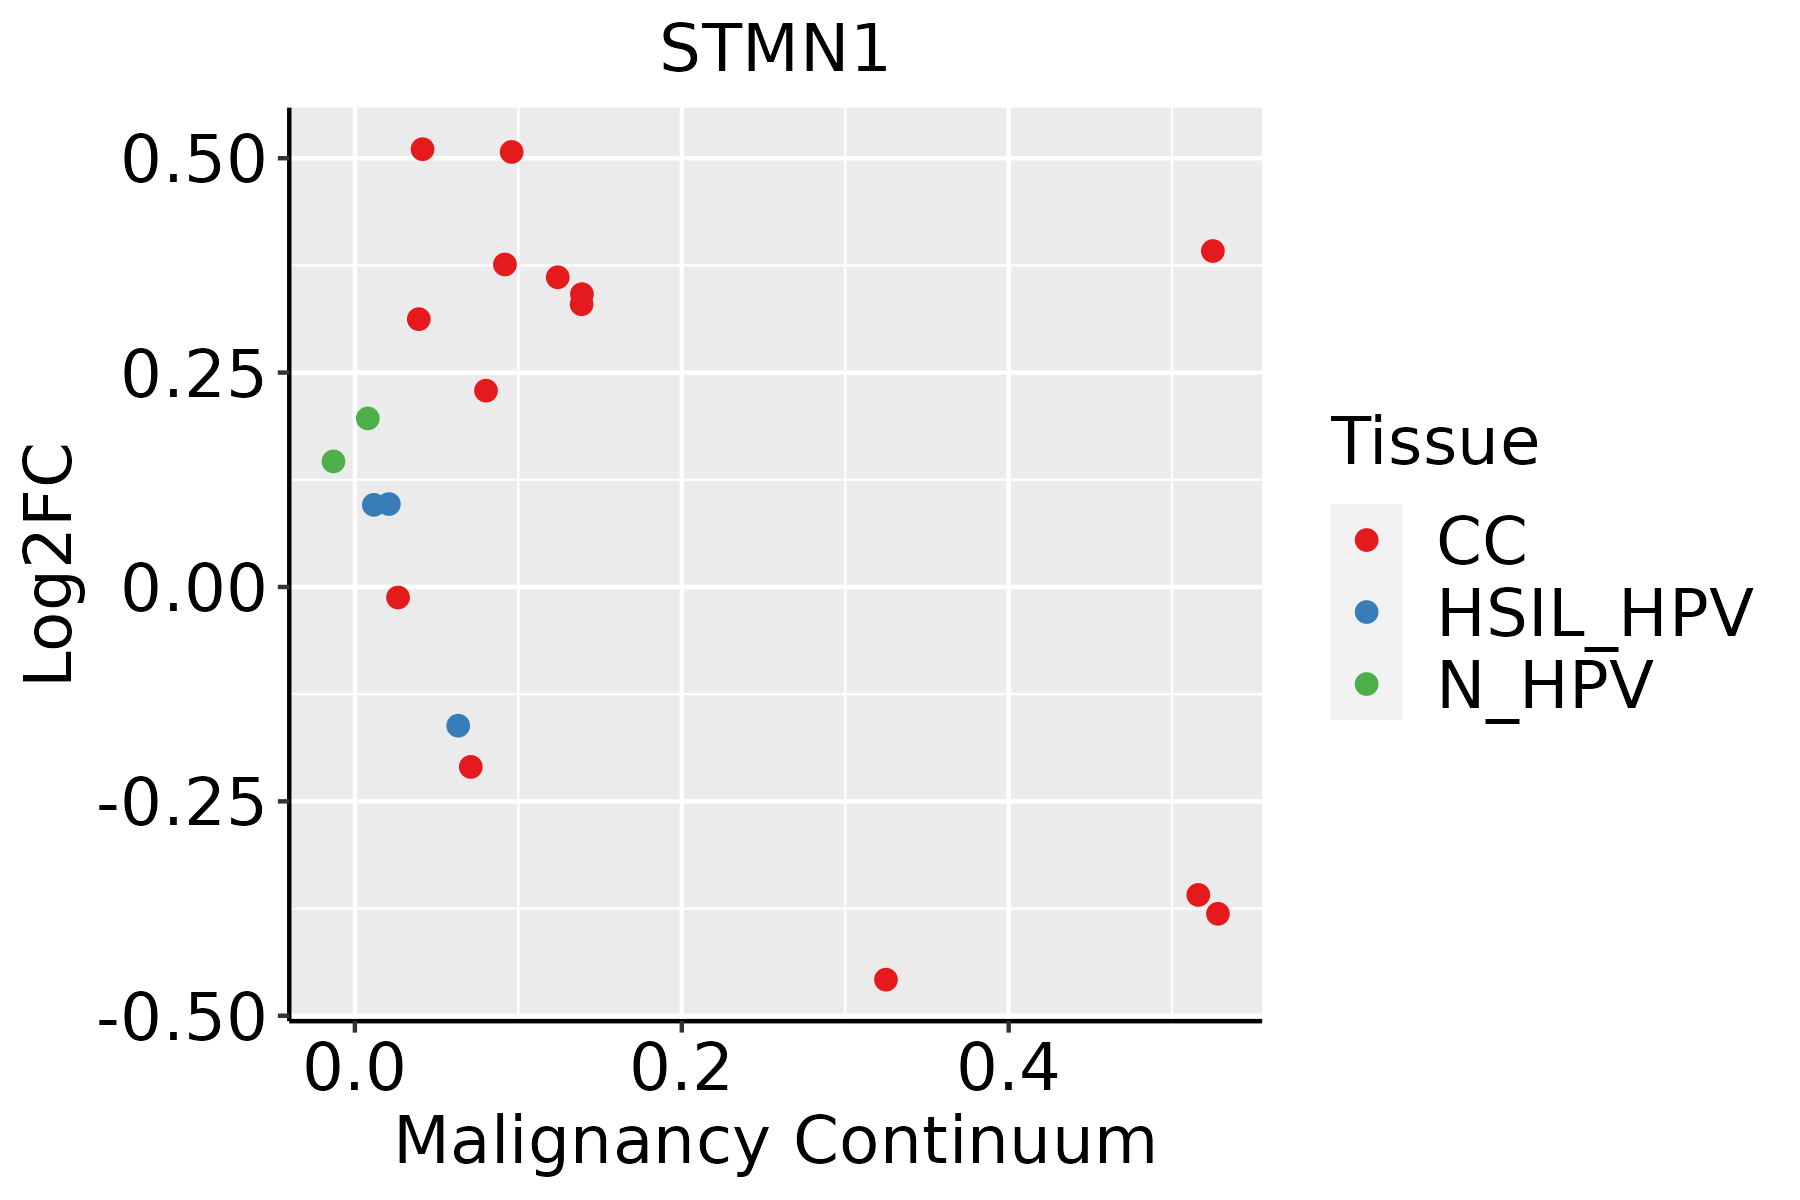 | CC: Cervix cancer |
| HSIL_HPV: HPV-infected high-grade squamous intraepithelial lesions |
| N_HPV: HPV-infected normal cervix |
| Colorectum (GSE201348) |  | FAP: Familial adenomatous polyposis |
| CRC: Colorectal cancer |
| Colorectum (HTA11) |  | AD: Adenomas |
| SER: Sessile serrated lesions |
| MSI-H: Microsatellite-high colorectal cancer |
| MSS: Microsatellite stable colorectal cancer |
| Endometrium | 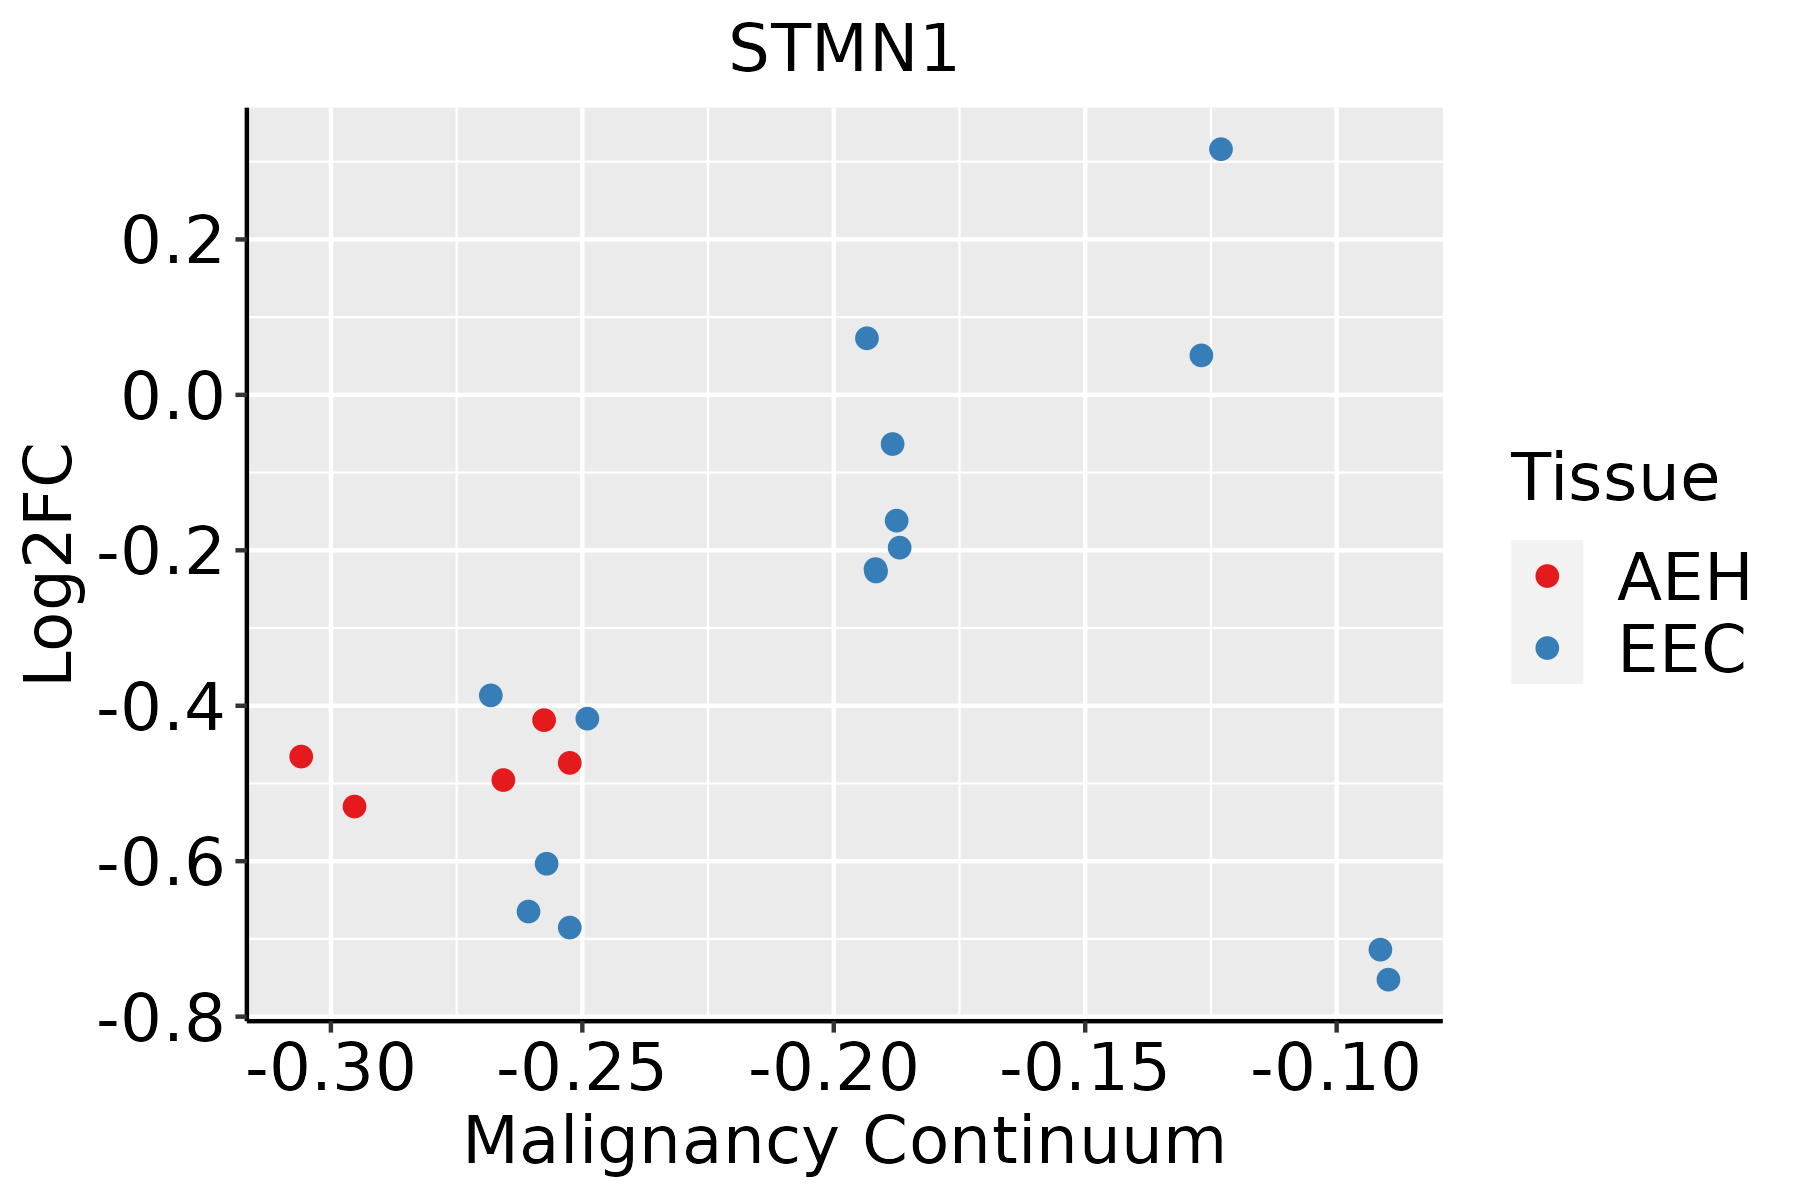 | AEH: Atypical endometrial hyperplasia |
| EEC: Endometrioid Cancer |
| Esophagus | 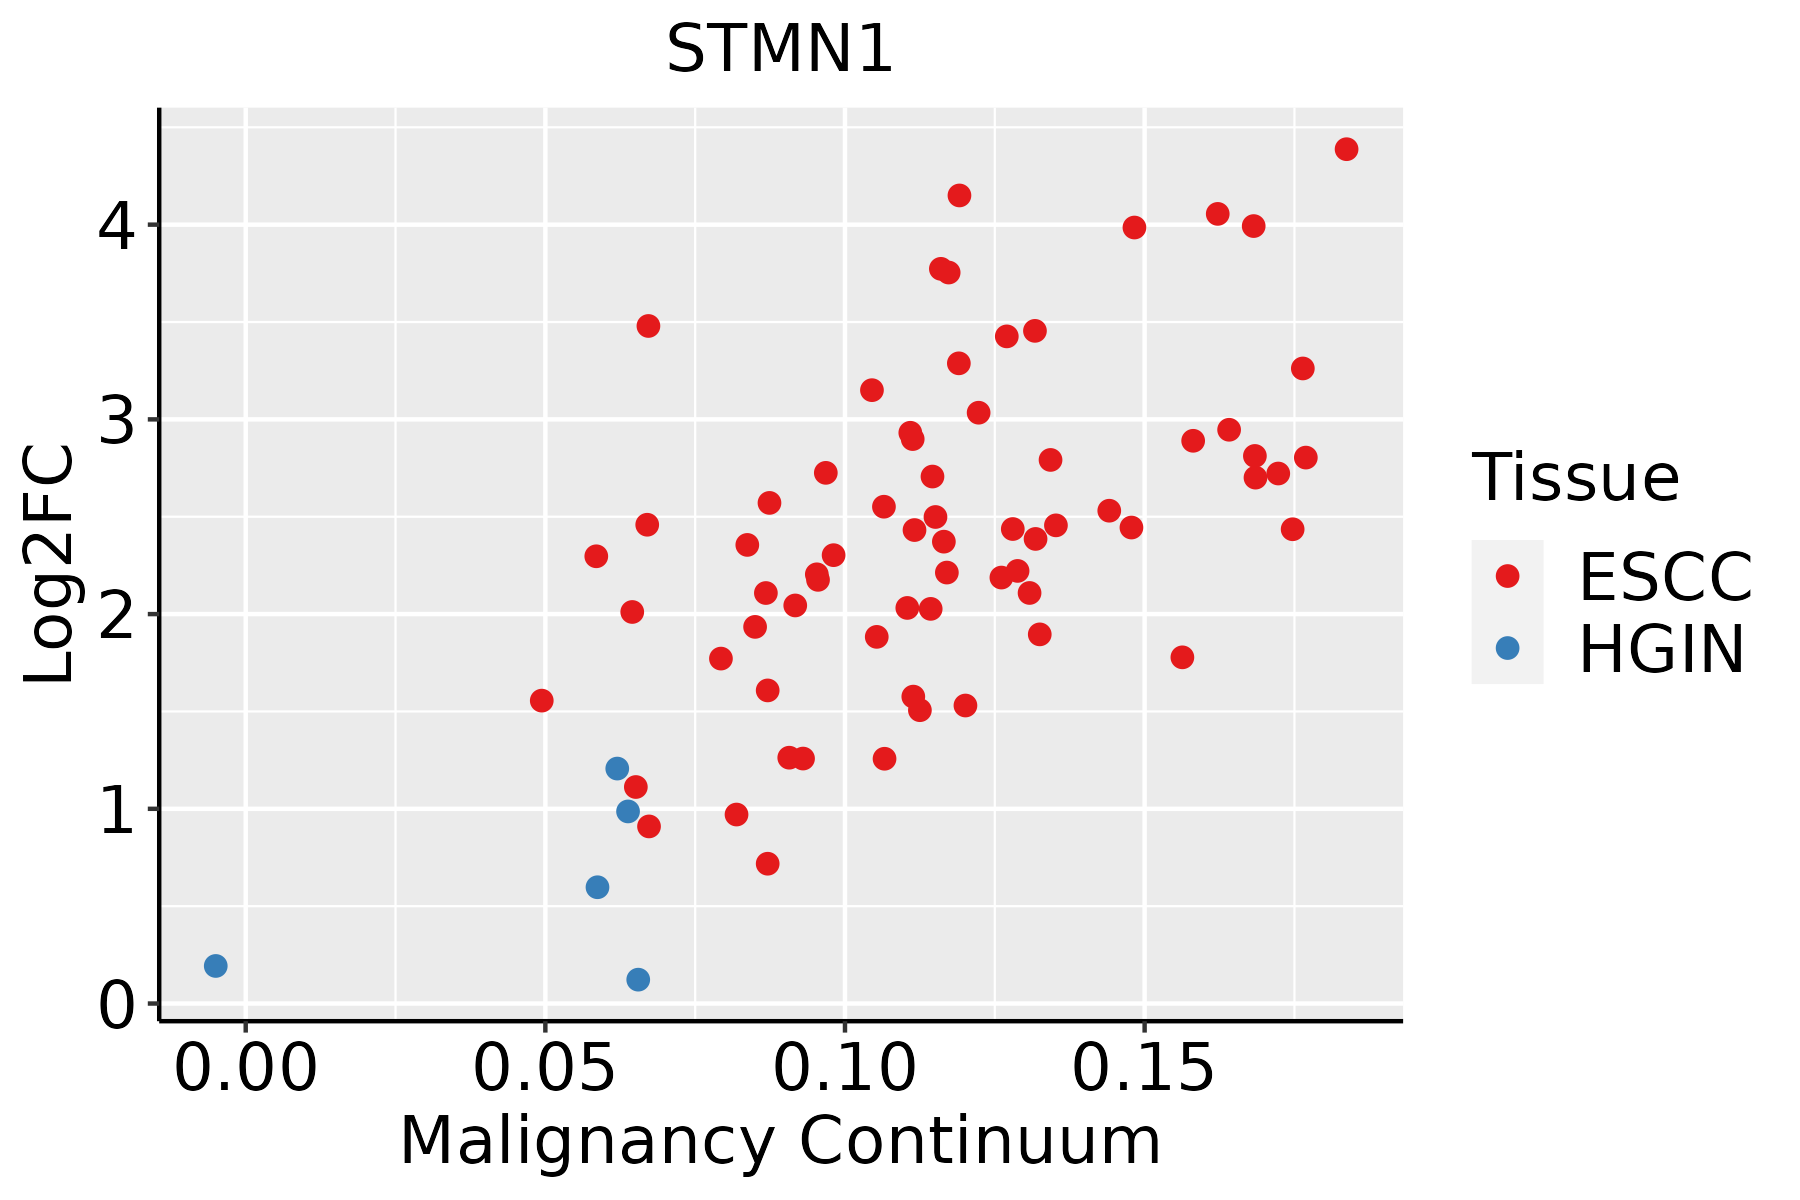 | ESCC: Esophageal squamous cell carcinoma |
| HGIN: High-grade intraepithelial neoplasias |
| LGIN: Low-grade intraepithelial neoplasias |
| GC | 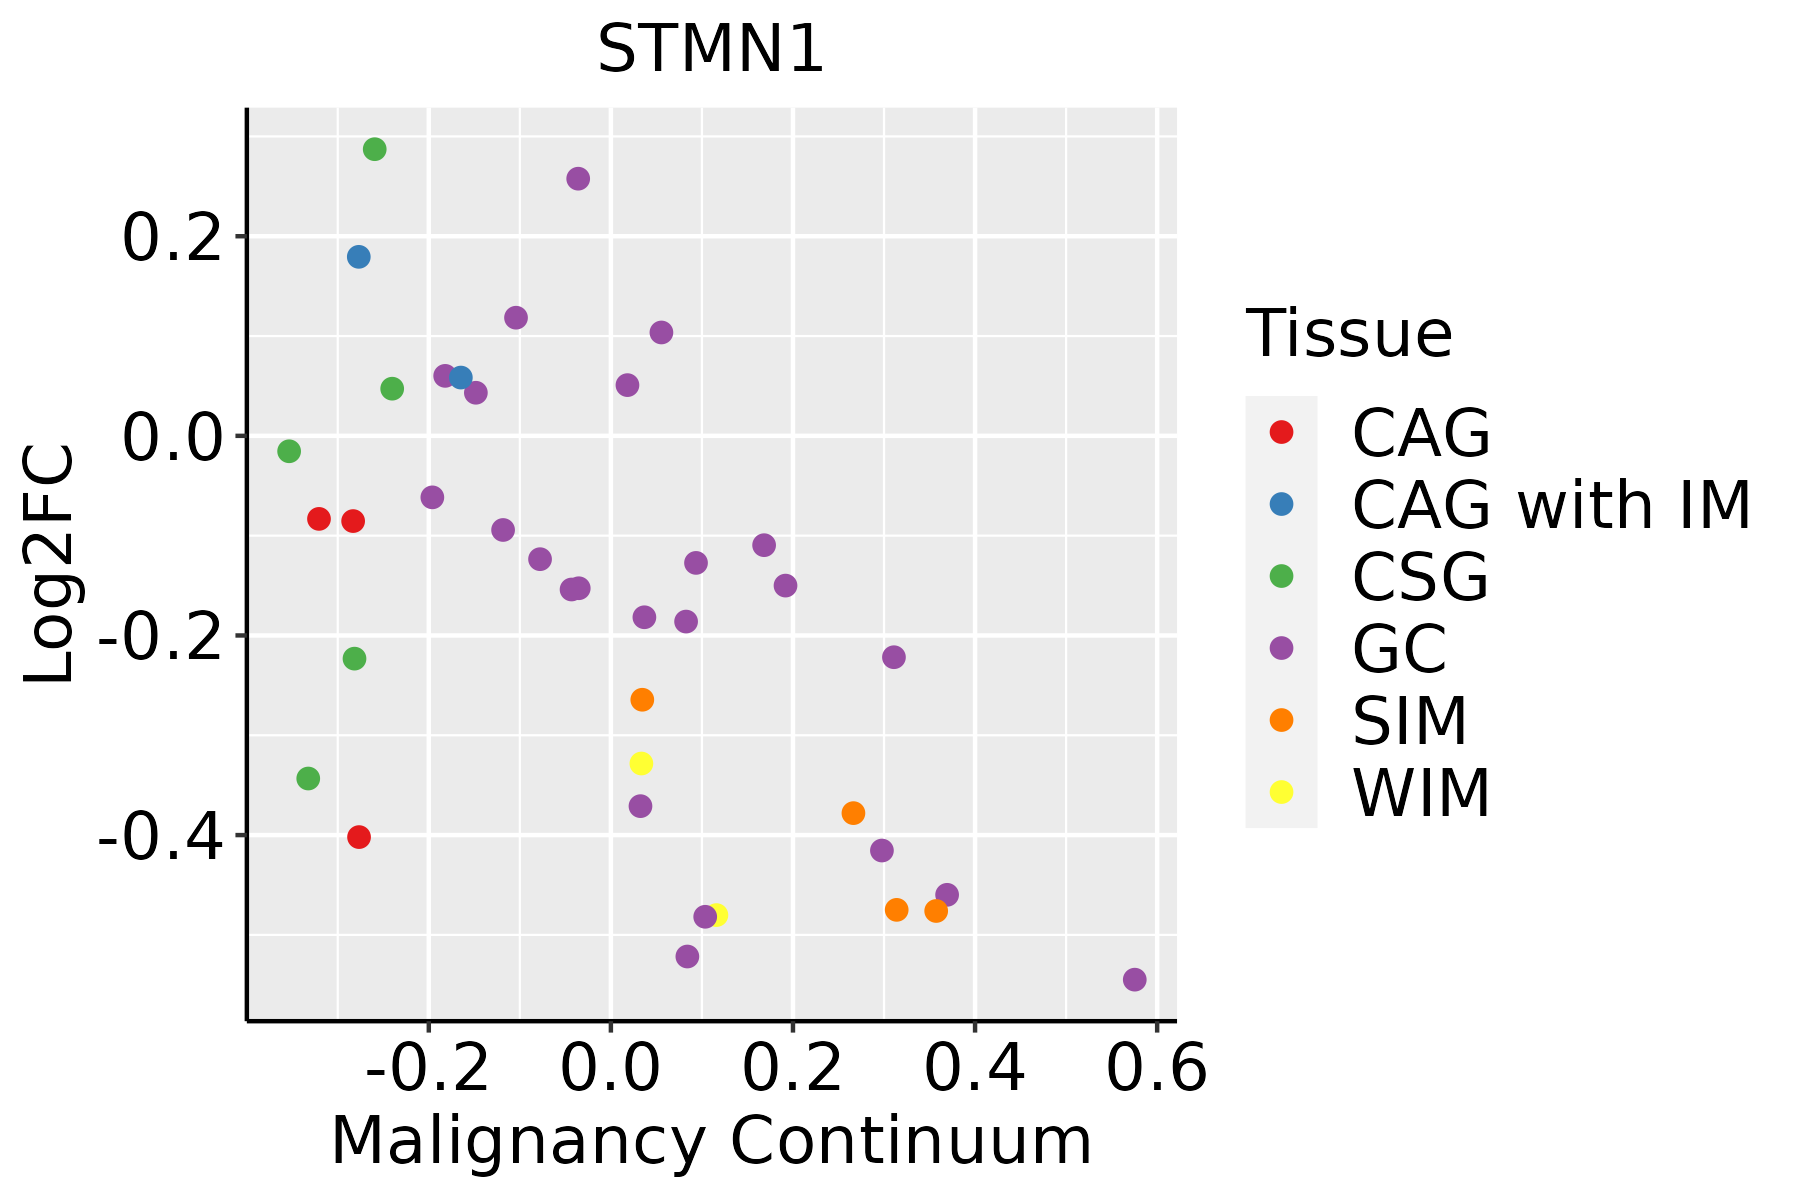 | CAG: Chronic atrophic gastritis |
| CAG with IM: Chronic atrophic gastritis with intestinal metaplasia |
| CSG: Chronic superficial gastritis |
| GC: Gastric cancer |
| SIM: Severe intestinal metaplasia |
| WIM: Wild intestinal metaplasia |
| Liver | 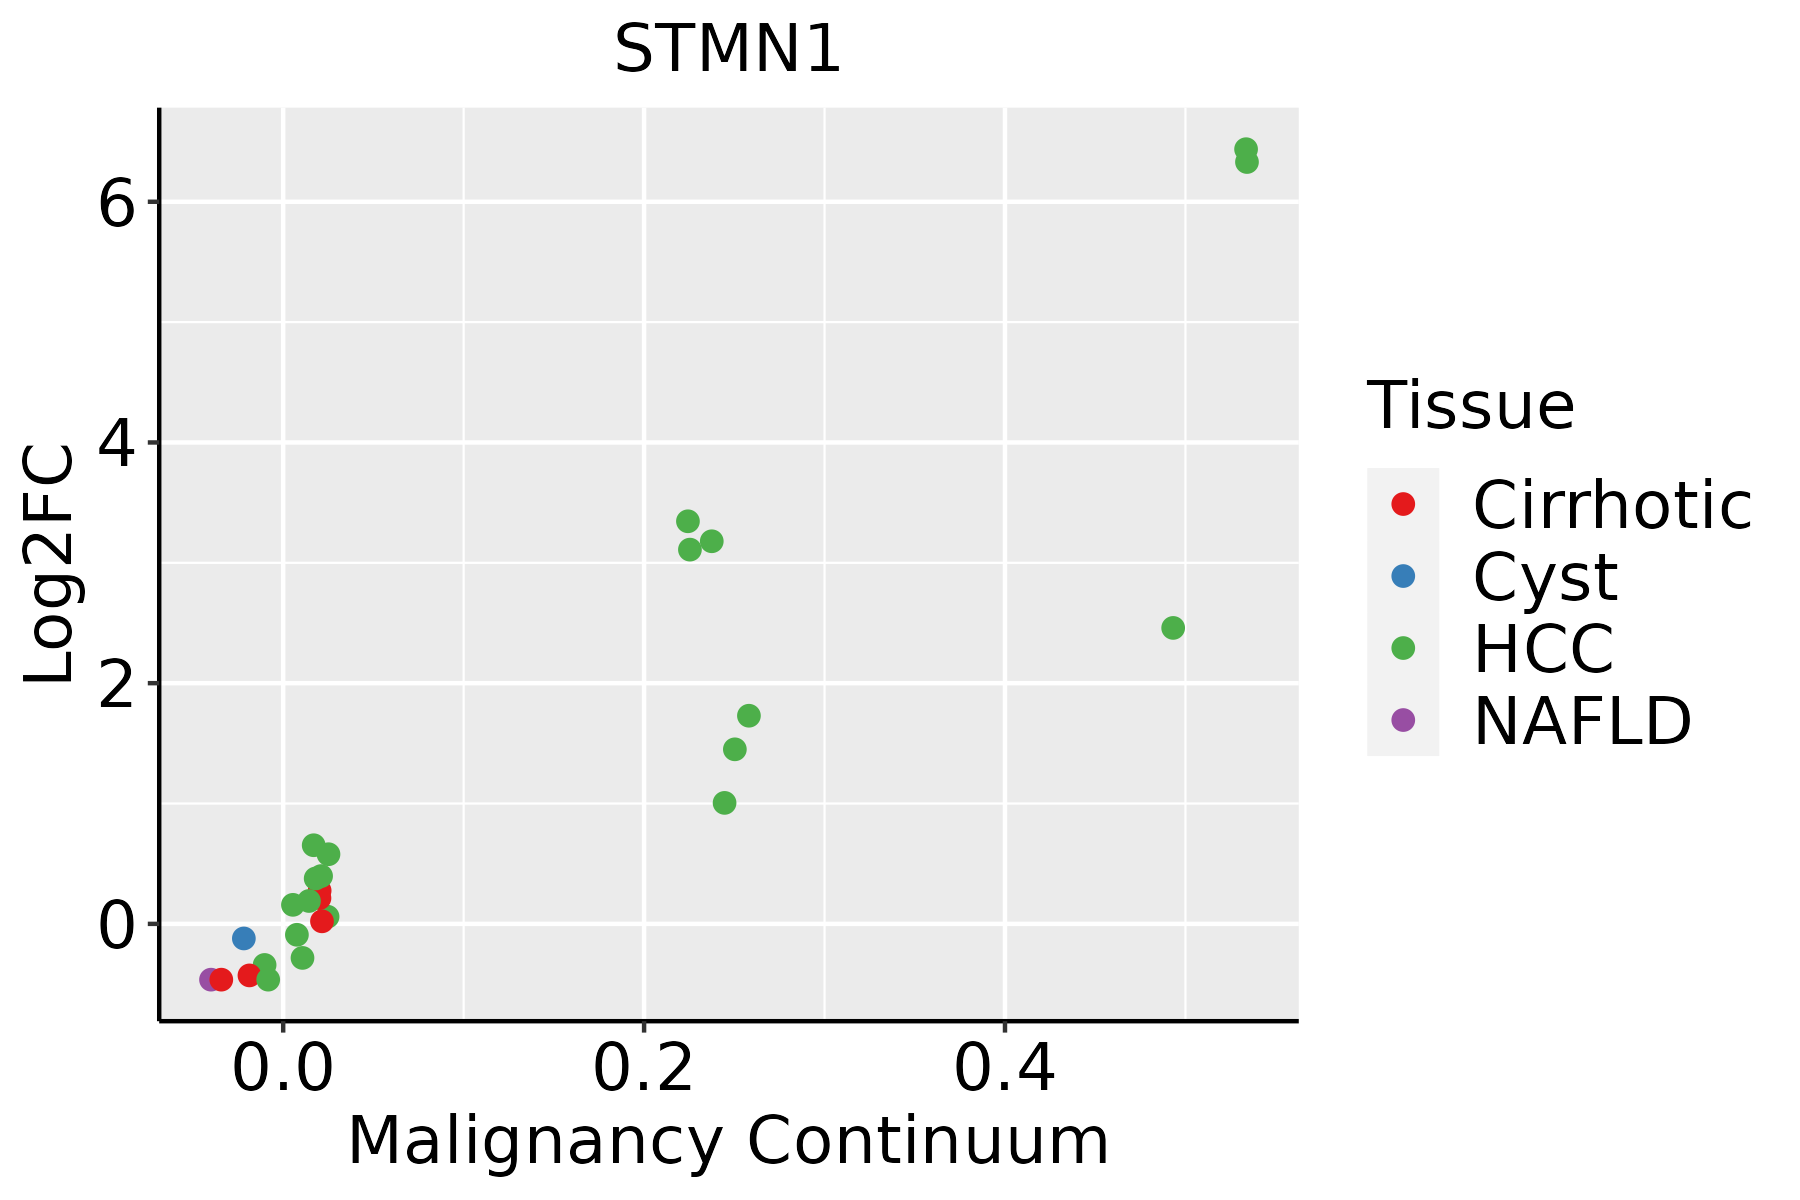 | HCC: Hepatocellular carcinoma |
| NAFLD: Non-alcoholic fatty liver disease |
| Oral Cavity | 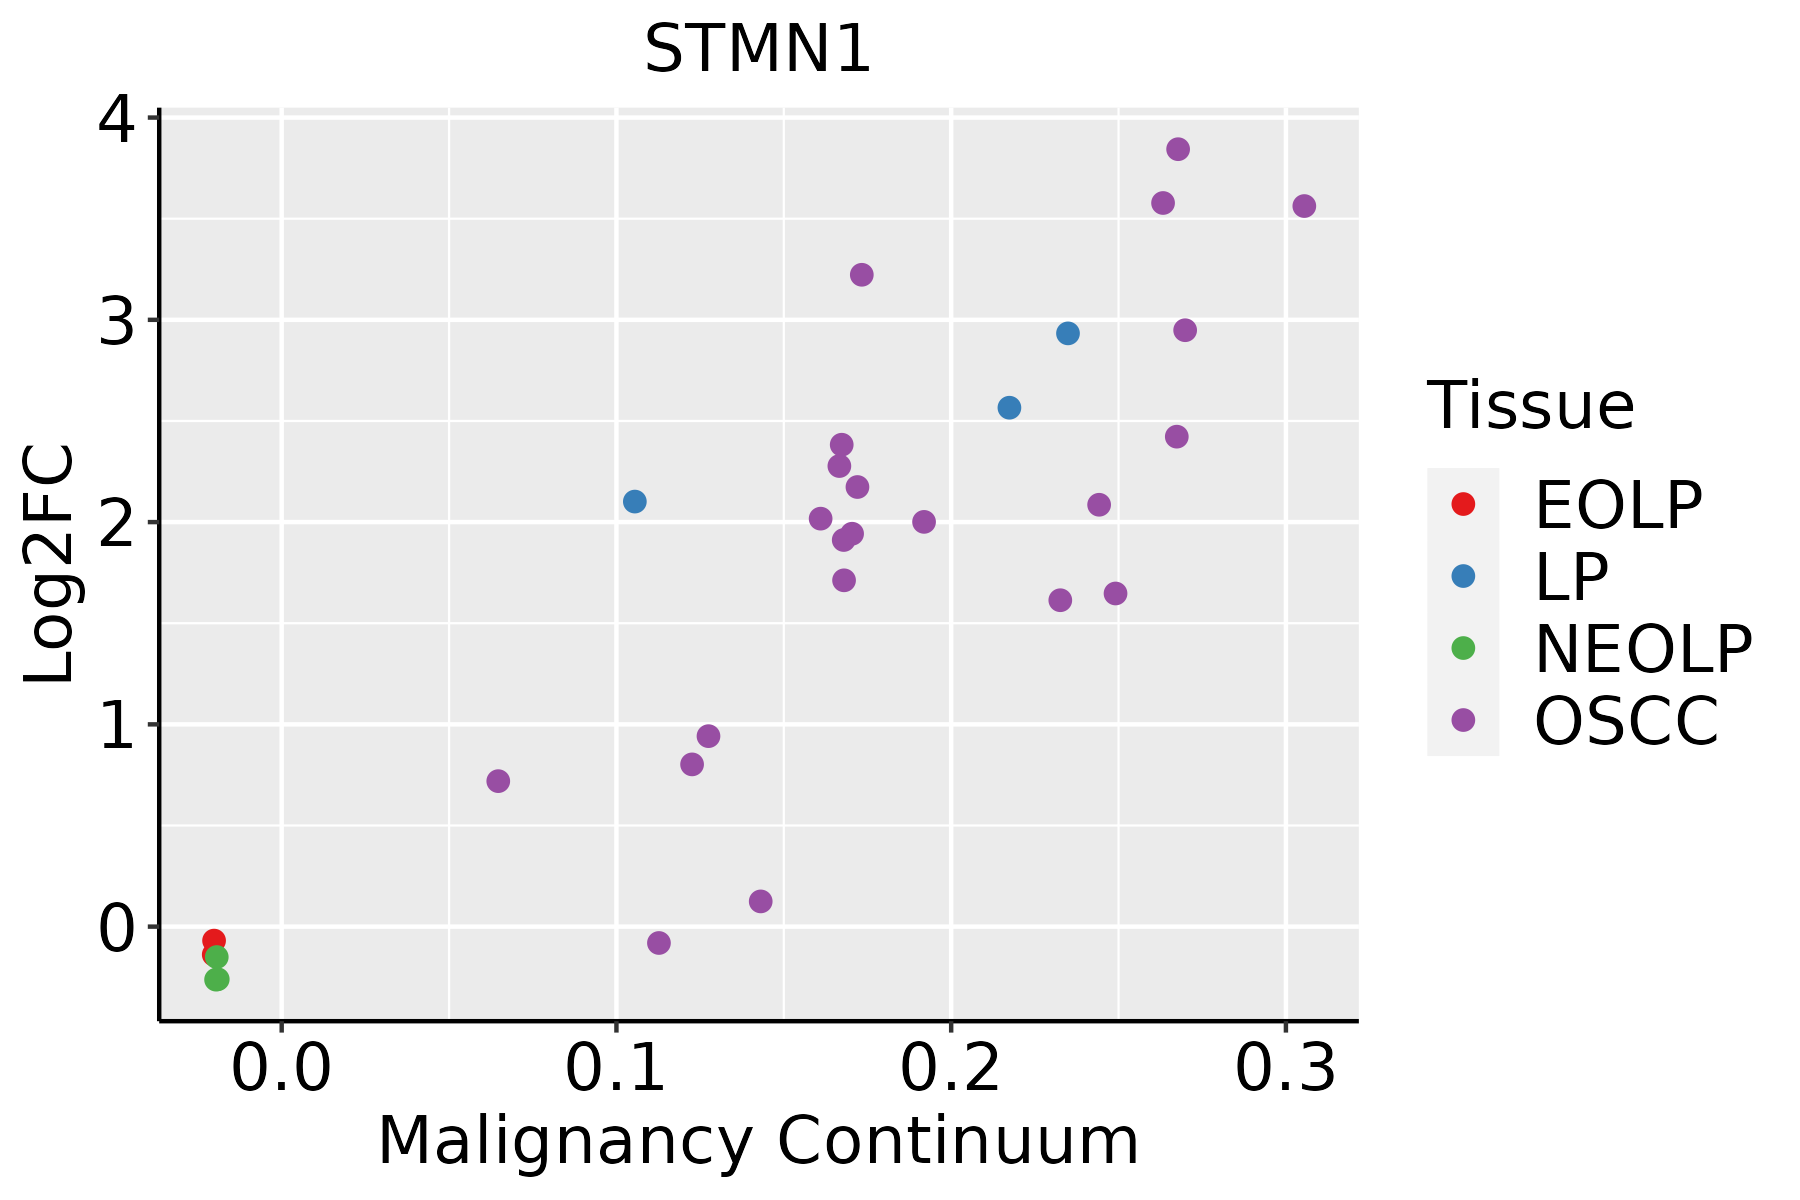 | EOLP: Erosive Oral lichen planus |
| LP: leukoplakia |
| NEOLP: Non-erosive oral lichen planus |
| OSCC: Oral squamous cell carcinoma |
| Prostate |  | BPH: Benign Prostatic Hyperplasia |
| Skin |  | AK: Actinic keratosis |
| cSCC: Cutaneous squamous cell carcinoma |
| SCCIS:squamous cell carcinoma in situ |
| Thyroid | 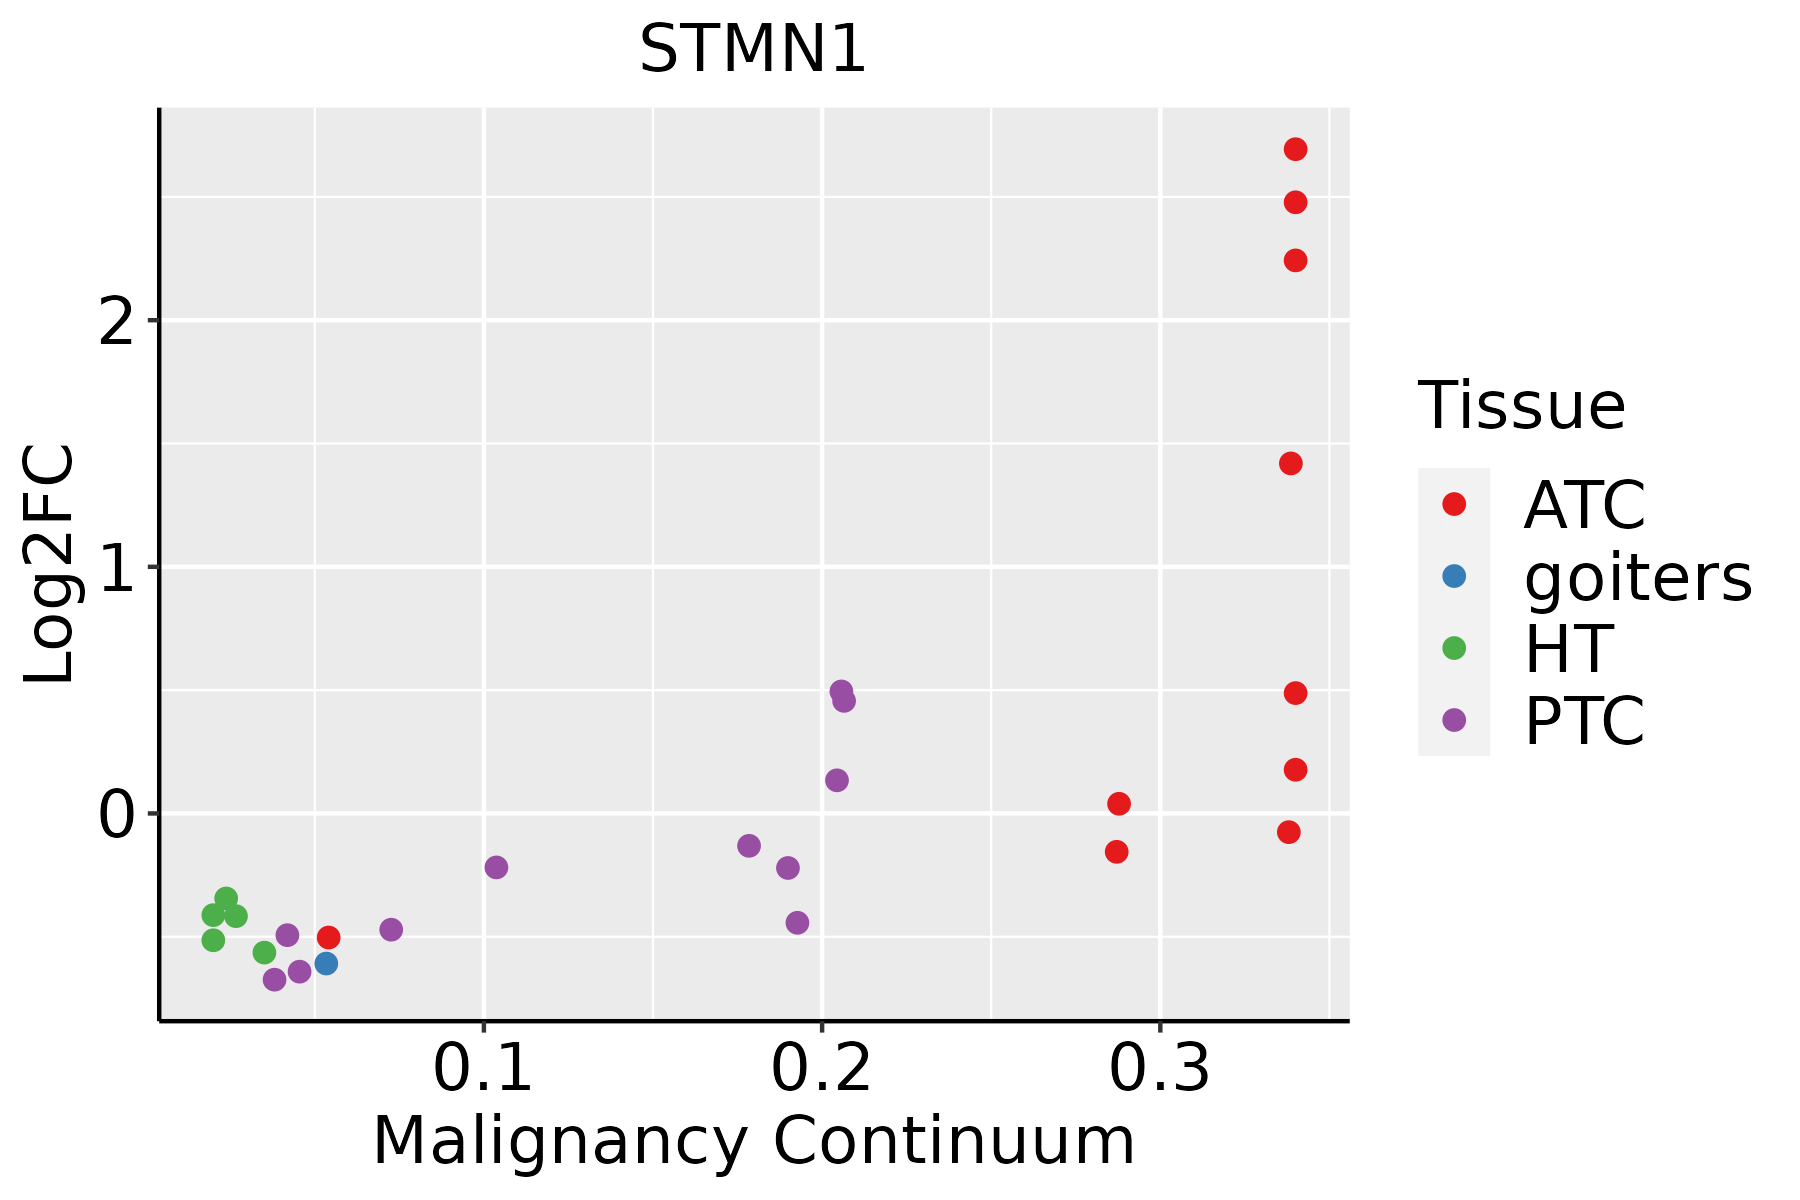 | ATC: Anaplastic thyroid cancer |
| HT: Hashimoto's thyroiditis |
| PTC: Papillary thyroid cancer |
| GO ID | Tissue | Disease Stage | Description | Gene Ratio | Bg Ratio | pvalue | p.adjust | Count |
| GO:005109814 | Breast | IDC | regulation of binding | 57/1434 | 363/18723 | 1.59e-07 | 8.76e-06 | 57 |
| GO:004325414 | Breast | IDC | regulation of protein-containing complex assembly | 61/1434 | 428/18723 | 1.77e-06 | 7.31e-05 | 61 |
| GO:003297014 | Breast | IDC | regulation of actin filament-based process | 56/1434 | 397/18723 | 6.37e-06 | 1.99e-04 | 56 |
| GO:190290314 | Breast | IDC | regulation of supramolecular fiber organization | 54/1434 | 383/18723 | 9.40e-06 | 2.66e-04 | 54 |
| GO:005109914 | Breast | IDC | positive regulation of binding | 30/1434 | 173/18723 | 1.96e-05 | 4.86e-04 | 30 |
| GO:003295614 | Breast | IDC | regulation of actin cytoskeleton organization | 48/1434 | 358/18723 | 1.03e-04 | 1.96e-03 | 48 |
| GO:005087813 | Breast | IDC | regulation of body fluid levels | 50/1434 | 379/18723 | 1.12e-04 | 2.10e-03 | 50 |
| GO:005149214 | Breast | IDC | regulation of stress fiber assembly | 18/1434 | 91/18723 | 1.60e-04 | 2.76e-03 | 18 |
| GO:000701514 | Breast | IDC | actin filament organization | 55/1434 | 442/18723 | 2.45e-04 | 3.84e-03 | 55 |
| GO:00096157 | Breast | IDC | response to virus | 47/1434 | 367/18723 | 3.53e-04 | 5.16e-03 | 47 |
| GO:003003814 | Breast | IDC | contractile actin filament bundle assembly | 19/1434 | 106/18723 | 4.05e-04 | 5.60e-03 | 19 |
| GO:004314914 | Breast | IDC | stress fiber assembly | 19/1434 | 106/18723 | 4.05e-04 | 5.60e-03 | 19 |
| GO:011002014 | Breast | IDC | regulation of actomyosin structure organization | 18/1434 | 100/18723 | 5.40e-04 | 6.96e-03 | 18 |
| GO:011005314 | Breast | IDC | regulation of actin filament organization | 37/1434 | 278/18723 | 7.01e-04 | 8.58e-03 | 37 |
| GO:005101714 | Breast | IDC | actin filament bundle assembly | 24/1434 | 157/18723 | 8.73e-04 | 1.01e-02 | 24 |
| GO:00322719 | Breast | IDC | regulation of protein polymerization | 32/1434 | 233/18723 | 9.19e-04 | 1.05e-02 | 32 |
| GO:003223114 | Breast | IDC | regulation of actin filament bundle assembly | 18/1434 | 105/18723 | 9.81e-04 | 1.11e-02 | 18 |
| GO:003133313 | Breast | IDC | negative regulation of protein-containing complex assembly | 22/1434 | 141/18723 | 1.07e-03 | 1.17e-02 | 22 |
| GO:006157214 | Breast | IDC | actin filament bundle organization | 24/1434 | 161/18723 | 1.25e-03 | 1.33e-02 | 24 |
| GO:00512589 | Breast | IDC | protein polymerization | 38/1434 | 297/18723 | 1.26e-03 | 1.34e-02 | 38 |
| Hugo Symbol | Variant Class | Variant Classification | dbSNP RS | HGVSc | HGVSp | HGVSp Short | SWISSPROT | BIOTYPE | SIFT | PolyPhen | Tumor Sample Barcode | Tissue | Histology | Sex | Age | Stage | Therapy Types | Drugs | Outcome |
| STMN1 | SNV | Missense_Mutation | | c.92N>A | p.Ser31Tyr | p.S31Y | P16949 | protein_coding | tolerated(0.06) | possibly_damaging(0.689) | TCGA-AA-A010-01 | Colorectum | colon adenocarcinoma | Female | <65 | I/II | Chemotherapy | folinic | CR |
| STMN1 | SNV | Missense_Mutation | novel | c.335N>A | p.Arg112Gln | p.R112Q | P16949 | protein_coding | deleterious(0.03) | possibly_damaging(0.641) | TCGA-A5-A0G2-01 | Endometrium | uterine corpus endometrioid carcinoma | Female | <65 | III/IV | Unknown | Unknown | SD |
| STMN1 | SNV | Missense_Mutation | novel | c.442C>T | p.Leu148Phe | p.L148F | P16949 | protein_coding | tolerated_low_confidence(0.18) | benign(0) | TCGA-AX-A2HD-01 | Endometrium | uterine corpus endometrioid carcinoma | Female | >=65 | III/IV | Unknown | Unknown | SD |
| STMN1 | SNV | Missense_Mutation | | c.248N>C | p.Leu83Pro | p.L83P | P16949 | protein_coding | deleterious(0.01) | possibly_damaging(0.884) | TCGA-BS-A0UV-01 | Endometrium | uterine corpus endometrioid carcinoma | Female | <65 | III/IV | Unknown | Unknown | SD |
| STMN1 | SNV | Missense_Mutation | novel | c.196N>A | p.Ala66Thr | p.A66T | P16949 | protein_coding | deleterious(0.02) | probably_damaging(0.995) | TCGA-D1-A179-01 | Endometrium | uterine corpus endometrioid carcinoma | Female | >=65 | III/IV | Chemotherapy | paclitaxel | PD |
| STMN1 | SNV | Missense_Mutation | novel | c.382N>C | p.Tyr128His | p.Y128H | P16949 | protein_coding | tolerated_low_confidence(0.4) | benign(0.102) | TCGA-DI-A1BU-01 | Endometrium | uterine corpus endometrioid carcinoma | Female | <65 | I/II | Chemotherapy | paclitaxel | SD |
| STMN1 | SNV | Missense_Mutation | novel | c.442N>A | p.Leu148Ile | p.L148I | P16949 | protein_coding | tolerated_low_confidence(0.32) | benign(0.015) | TCGA-EO-A22R-01 | Endometrium | uterine corpus endometrioid carcinoma | Female | <65 | I/II | Unknown | Unknown | SD |
| STMN1 | SNV | Missense_Mutation | novel | c.508C>A | p.Leu170Ile | p.L170I | P16949 | protein_coding | tolerated_low_confidence(0.16) | benign(0.408) | TCGA-EO-A22X-01 | Endometrium | uterine corpus endometrioid carcinoma | Female | <65 | III/IV | Unspecific | Carboplatin | Complete Response |
| STMN1 | SNV | Missense_Mutation | novel | c.86A>T | p.Lys29Ile | p.K29I | P16949 | protein_coding | tolerated(0.26) | benign(0.195) | TCGA-DD-AADS-01 | Liver | liver hepatocellular carcinoma | Male | <65 | I/II | Unknown | Unknown | SD |
| STMN1 | SNV | Missense_Mutation | rs763117641 | c.182G>A | p.Arg61His | p.R61H | P16949 | protein_coding | deleterious(0.03) | probably_damaging(0.935) | TCGA-BR-4256-01 | Stomach | stomach adenocarcinoma | Male | >=65 | I/II | Unknown | Unknown | SD |


