
|
|||||
|
 | |
| |
| |
| |
| |
| |
|
Gene: STK4 |
Gene summary for STK4 |
| Gene information | Species | Human | Gene symbol | STK4 | Gene ID | 6789 |
| Gene name | serine/threonine kinase 4 | |
| Gene Alias | KRS2 | |
| Cytomap | 20q13.12 | |
| Gene Type | protein-coding | GO ID | GO:0000003 | UniProtAcc | Q13043 |
Top |
Malignant transformation analysis |
| Identification of the aberrant gene expression in precancerous and cancerous lesions by comparing the gene expression of stem-like cells in diseased tissues with normal stem cells |
| Entrez ID | Symbol | Replicates | Species | Organ | Tissue | Adj P-value | Log2FC | Malignancy |
| 6789 | STK4 | LZE4T | Human | Esophagus | ESCC | 5.25e-16 | 5.59e-01 | 0.0811 |
| 6789 | STK4 | LZE7T | Human | Esophagus | ESCC | 2.22e-09 | 6.08e-01 | 0.0667 |
| 6789 | STK4 | LZE8T | Human | Esophagus | ESCC | 5.63e-03 | 2.89e-01 | 0.067 |
| 6789 | STK4 | LZE20T | Human | Esophagus | ESCC | 4.89e-12 | 3.59e-01 | 0.0662 |
| 6789 | STK4 | LZE22T | Human | Esophagus | ESCC | 2.23e-06 | 3.37e-01 | 0.068 |
| 6789 | STK4 | LZE24T | Human | Esophagus | ESCC | 6.84e-24 | 4.72e-01 | 0.0596 |
| 6789 | STK4 | LZE21T | Human | Esophagus | ESCC | 2.25e-03 | 2.22e-01 | 0.0655 |
| 6789 | STK4 | LZE6T | Human | Esophagus | ESCC | 5.05e-12 | 5.72e-01 | 0.0845 |
| 6789 | STK4 | P1T-E | Human | Esophagus | ESCC | 2.48e-10 | 5.64e-01 | 0.0875 |
| 6789 | STK4 | P2T-E | Human | Esophagus | ESCC | 9.80e-21 | 4.67e-01 | 0.1177 |
| 6789 | STK4 | P4T-E | Human | Esophagus | ESCC | 6.54e-24 | 4.24e-01 | 0.1323 |
| 6789 | STK4 | P5T-E | Human | Esophagus | ESCC | 1.19e-13 | 2.81e-01 | 0.1327 |
| 6789 | STK4 | P8T-E | Human | Esophagus | ESCC | 3.52e-19 | 4.45e-01 | 0.0889 |
| 6789 | STK4 | P9T-E | Human | Esophagus | ESCC | 4.90e-05 | 1.11e-01 | 0.1131 |
| 6789 | STK4 | P10T-E | Human | Esophagus | ESCC | 3.73e-46 | 7.30e-01 | 0.116 |
| 6789 | STK4 | P11T-E | Human | Esophagus | ESCC | 1.53e-07 | 4.12e-01 | 0.1426 |
| 6789 | STK4 | P12T-E | Human | Esophagus | ESCC | 1.02e-22 | 4.37e-01 | 0.1122 |
| 6789 | STK4 | P15T-E | Human | Esophagus | ESCC | 2.37e-30 | 5.18e-01 | 0.1149 |
| 6789 | STK4 | P16T-E | Human | Esophagus | ESCC | 2.90e-32 | 5.90e-01 | 0.1153 |
| 6789 | STK4 | P17T-E | Human | Esophagus | ESCC | 6.92e-11 | 3.23e-01 | 0.1278 |
| Page: 1 2 3 4 5 6 |
| Tissue | Expression Dynamics | Abbreviation |
| Esophagus | 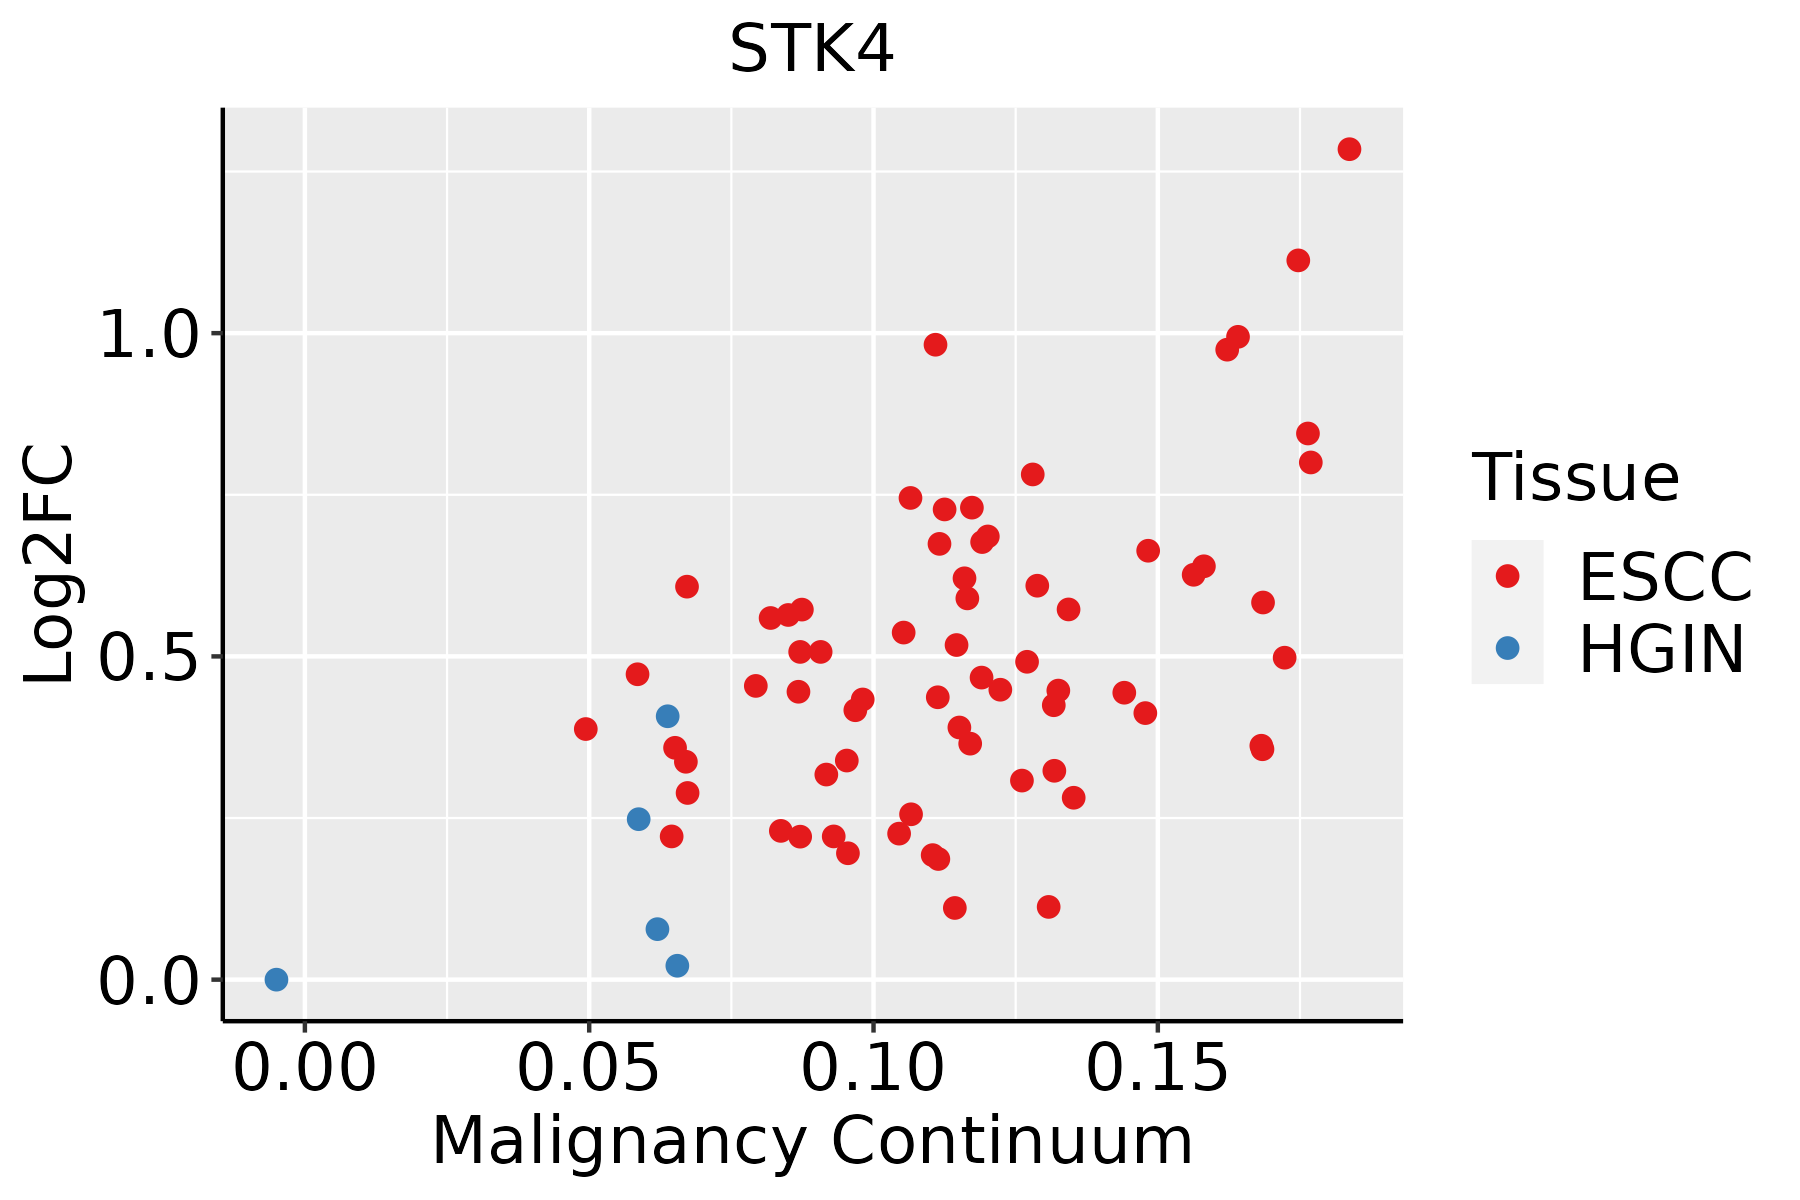 | ESCC: Esophageal squamous cell carcinoma |
| HGIN: High-grade intraepithelial neoplasias | ||
| LGIN: Low-grade intraepithelial neoplasias | ||
| Liver | 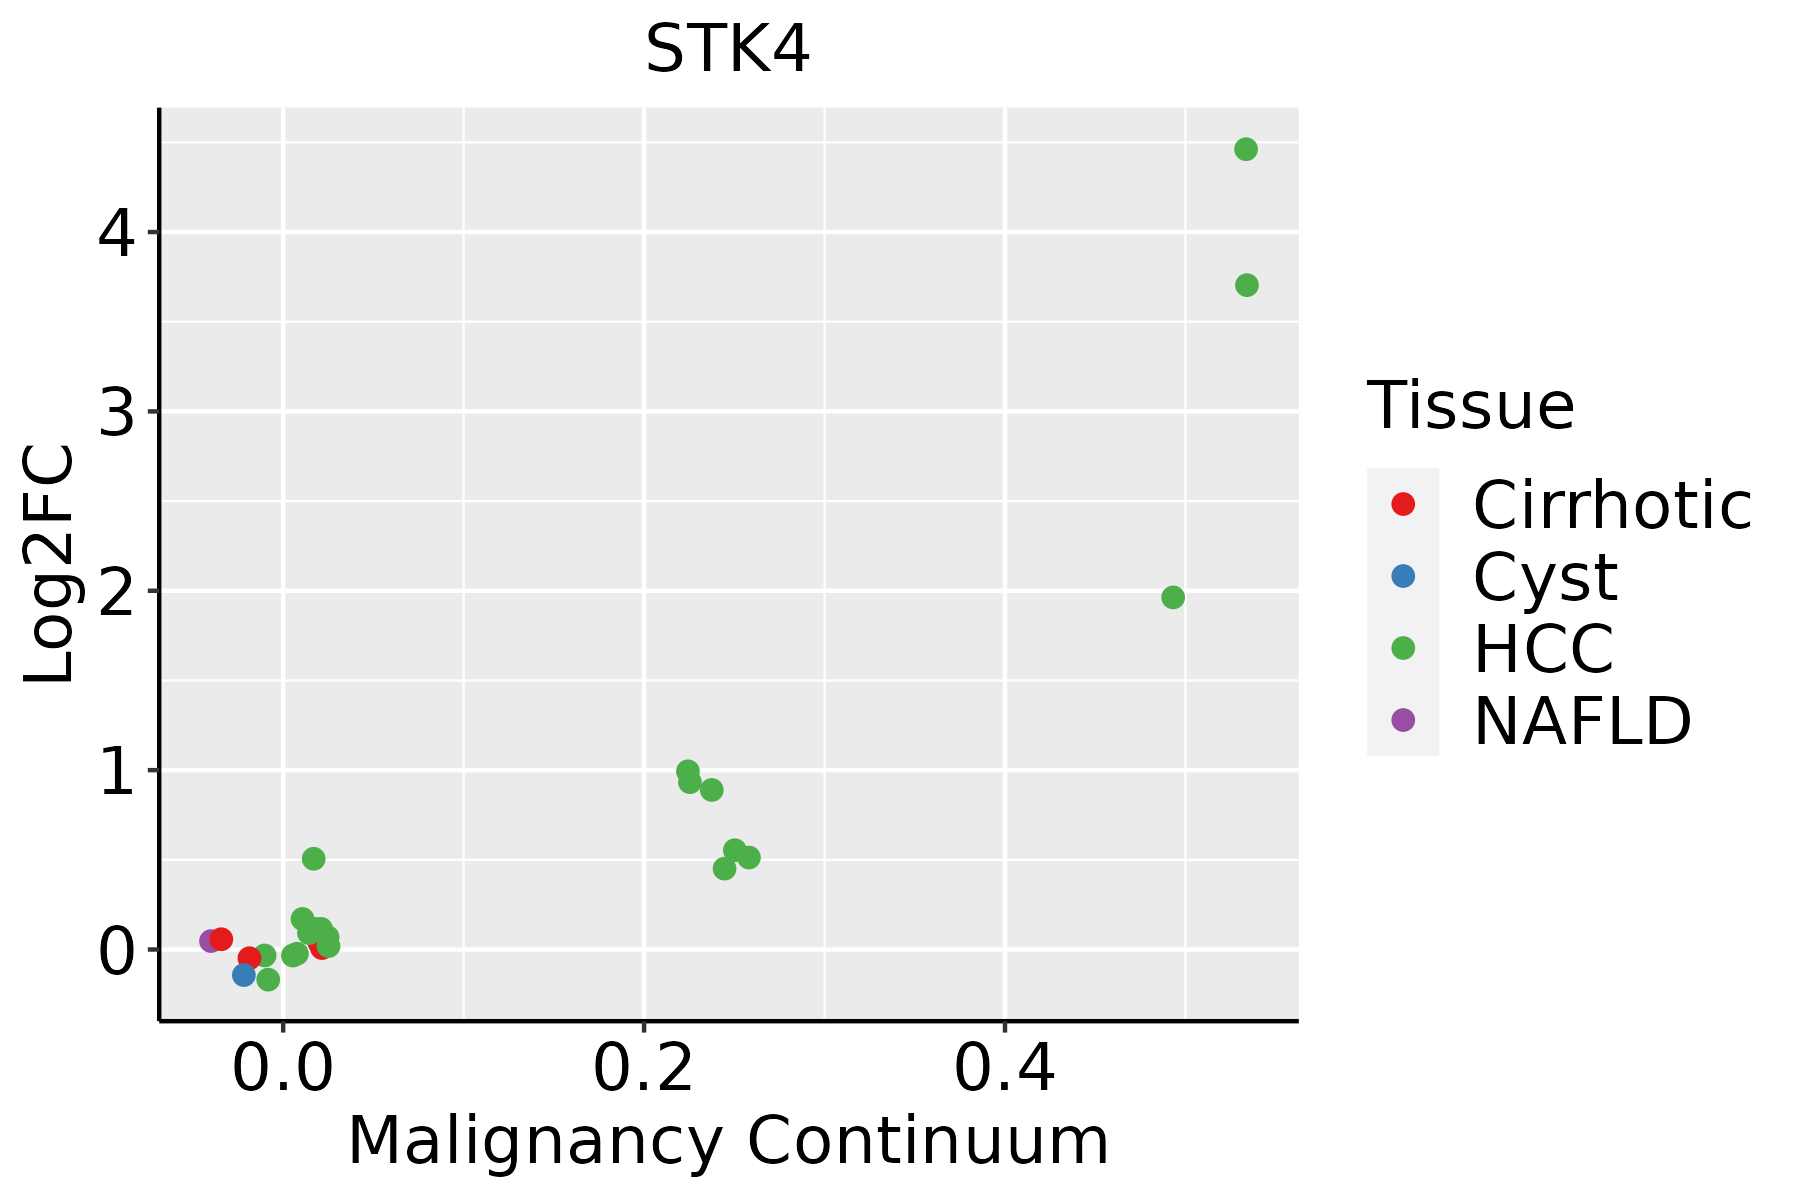 | HCC: Hepatocellular carcinoma |
| NAFLD: Non-alcoholic fatty liver disease | ||
| Oral Cavity |  | EOLP: Erosive Oral lichen planus |
| LP: leukoplakia | ||
| NEOLP: Non-erosive oral lichen planus | ||
| OSCC: Oral squamous cell carcinoma | ||
| Prostate |  | BPH: Benign Prostatic Hyperplasia |
| Thyroid |  | ATC: Anaplastic thyroid cancer |
| HT: Hashimoto's thyroiditis | ||
| PTC: Papillary thyroid cancer |
| ∗log2FC in expression of this searched gene in stem-like cells from each diseased tissue sample relative to stem-like cells in normal samples in each tissue plotted against the malignancy continuum. Samples are colored based on if they are from different disease stage. |
Top |
Malignant transformation related pathway analysis |
| Find out the enriched GO biological processes and KEGG pathways involved in transition from healthy to precancer to cancer |
| Tissue | Disease Stage | Enriched GO biological Processes |
| Colorectum | AD |  |
| Colorectum | SER |  |
| Colorectum | MSS |  |
| Colorectum | MSI-H |  |
| Colorectum | FAP |  |
| ∗Top 15 enriched GO BP terms are showed in the bar plot of each disease state in each tissue. Each row represents a significant GO biological process which is colored according to the -log10(p.adjust). |
| Page: 1 2 3 4 5 6 7 8 9 |
| GO ID | Tissue | Disease Stage | Description | Gene Ratio | Bg Ratio | pvalue | p.adjust | Count |
| GO:0006091 | Colorectum | AD | generation of precursor metabolites and energy | 209/3918 | 490/18723 | 3.17e-28 | 6.61e-25 | 209 |
| GO:0015980 | Colorectum | AD | energy derivation by oxidation of organic compounds | 143/3918 | 318/18723 | 2.78e-22 | 2.49e-19 | 143 |
| GO:0044262 | Colorectum | AD | cellular carbohydrate metabolic process | 87/3918 | 283/18723 | 6.00e-05 | 1.01e-03 | 87 |
| GO:0060425 | Colorectum | AD | lung morphogenesis | 20/3918 | 50/18723 | 1.65e-03 | 1.38e-02 | 20 |
| GO:00060911 | Colorectum | SER | generation of precursor metabolites and energy | 168/2897 | 490/18723 | 1.39e-25 | 1.70e-22 | 168 |
| GO:00159801 | Colorectum | SER | energy derivation by oxidation of organic compounds | 119/2897 | 318/18723 | 5.28e-22 | 4.62e-19 | 119 |
| GO:00060912 | Colorectum | MSS | generation of precursor metabolites and energy | 186/3467 | 490/18723 | 1.14e-24 | 2.15e-21 | 186 |
| GO:00159802 | Colorectum | MSS | energy derivation by oxidation of organic compounds | 131/3467 | 318/18723 | 2.60e-21 | 2.70e-18 | 131 |
| GO:00604251 | Colorectum | MSS | lung morphogenesis | 20/3467 | 50/18723 | 3.25e-04 | 4.21e-03 | 20 |
| GO:0035264 | Colorectum | MSS | multicellular organism growth | 37/3467 | 132/18723 | 4.77e-03 | 3.34e-02 | 37 |
| GO:00060914 | Colorectum | FAP | generation of precursor metabolites and energy | 128/2622 | 490/18723 | 5.58e-13 | 4.28e-10 | 128 |
| GO:00159804 | Colorectum | FAP | energy derivation by oxidation of organic compounds | 85/2622 | 318/18723 | 1.36e-09 | 2.77e-07 | 85 |
| GO:00442621 | Colorectum | FAP | cellular carbohydrate metabolic process | 66/2622 | 283/18723 | 1.53e-05 | 4.01e-04 | 66 |
| GO:00604252 | Colorectum | FAP | lung morphogenesis | 16/2622 | 50/18723 | 9.14e-04 | 9.20e-03 | 16 |
| GO:00352641 | Colorectum | FAP | multicellular organism growth | 31/2622 | 132/18723 | 2.28e-03 | 1.84e-02 | 31 |
| GO:0030323 | Colorectum | FAP | respiratory tube development | 39/2622 | 181/18723 | 3.60e-03 | 2.58e-02 | 39 |
| GO:0030324 | Colorectum | FAP | lung development | 38/2622 | 177/18723 | 4.28e-03 | 2.93e-02 | 38 |
| GO:0031647111 | Esophagus | ESCC | regulation of protein stability | 223/8552 | 298/18723 | 5.76e-25 | 1.52e-22 | 223 |
| GO:2001233111 | Esophagus | ESCC | regulation of apoptotic signaling pathway | 256/8552 | 356/18723 | 4.11e-24 | 1.04e-21 | 256 |
| GO:0006091110 | Esophagus | ESCC | generation of precursor metabolites and energy | 331/8552 | 490/18723 | 3.86e-23 | 8.45e-21 | 331 |
| Page: 1 2 3 4 5 6 7 8 9 10 11 12 13 14 15 16 17 18 19 20 21 22 23 24 25 26 |
| Pathway ID | Tissue | Disease Stage | Description | Gene Ratio | Bg Ratio | pvalue | p.adjust | qvalue | Count |
| hsa040689 | Esophagus | ESCC | FoxO signaling pathway | 89/4205 | 131/8465 | 1.56e-05 | 7.98e-05 | 4.09e-05 | 89 |
| hsa052237 | Esophagus | ESCC | Non-small cell lung cancer | 48/4205 | 72/8465 | 2.57e-03 | 7.05e-03 | 3.61e-03 | 48 |
| hsa0406814 | Esophagus | ESCC | FoxO signaling pathway | 89/4205 | 131/8465 | 1.56e-05 | 7.98e-05 | 4.09e-05 | 89 |
| hsa0522316 | Esophagus | ESCC | Non-small cell lung cancer | 48/4205 | 72/8465 | 2.57e-03 | 7.05e-03 | 3.61e-03 | 48 |
| hsa040684 | Liver | HCC | FoxO signaling pathway | 85/4020 | 131/8465 | 3.99e-05 | 2.16e-04 | 1.20e-04 | 85 |
| hsa052232 | Liver | HCC | Non-small cell lung cancer | 46/4020 | 72/8465 | 3.61e-03 | 1.12e-02 | 6.22e-03 | 46 |
| hsa040685 | Liver | HCC | FoxO signaling pathway | 85/4020 | 131/8465 | 3.99e-05 | 2.16e-04 | 1.20e-04 | 85 |
| hsa0522311 | Liver | HCC | Non-small cell lung cancer | 46/4020 | 72/8465 | 3.61e-03 | 1.12e-02 | 6.22e-03 | 46 |
| hsa040688 | Oral cavity | OSCC | FoxO signaling pathway | 85/3704 | 131/8465 | 7.50e-07 | 4.33e-06 | 2.21e-06 | 85 |
| hsa0401014 | Oral cavity | OSCC | MAPK signaling pathway | 165/3704 | 302/8465 | 7.11e-05 | 2.74e-04 | 1.40e-04 | 165 |
| hsa052236 | Oral cavity | OSCC | Non-small cell lung cancer | 46/3704 | 72/8465 | 4.37e-04 | 1.32e-03 | 6.72e-04 | 46 |
| hsa0406813 | Oral cavity | OSCC | FoxO signaling pathway | 85/3704 | 131/8465 | 7.50e-07 | 4.33e-06 | 2.21e-06 | 85 |
| hsa0401015 | Oral cavity | OSCC | MAPK signaling pathway | 165/3704 | 302/8465 | 7.11e-05 | 2.74e-04 | 1.40e-04 | 165 |
| hsa0522315 | Oral cavity | OSCC | Non-small cell lung cancer | 46/3704 | 72/8465 | 4.37e-04 | 1.32e-03 | 6.72e-04 | 46 |
| hsa0401023 | Oral cavity | EOLP | MAPK signaling pathway | 68/1218 | 302/8465 | 7.48e-05 | 3.40e-04 | 2.01e-04 | 68 |
| hsa0406823 | Oral cavity | EOLP | FoxO signaling pathway | 29/1218 | 131/8465 | 1.05e-02 | 2.85e-02 | 1.68e-02 | 29 |
| hsa0401033 | Oral cavity | EOLP | MAPK signaling pathway | 68/1218 | 302/8465 | 7.48e-05 | 3.40e-04 | 2.01e-04 | 68 |
| hsa0406833 | Oral cavity | EOLP | FoxO signaling pathway | 29/1218 | 131/8465 | 1.05e-02 | 2.85e-02 | 1.68e-02 | 29 |
| hsa040687 | Prostate | BPH | FoxO signaling pathway | 54/1718 | 131/8465 | 3.05e-08 | 3.59e-07 | 2.22e-07 | 54 |
| hsa0401010 | Prostate | BPH | MAPK signaling pathway | 87/1718 | 302/8465 | 2.05e-04 | 1.13e-03 | 6.98e-04 | 87 |
| Page: 1 2 |
Top |
Cell-cell communication analysis |
| Identification of potential cell-cell interactions between two cell types and their ligand-receptor pairs for different disease states |
| Ligand | Receptor | LRpair | Pathway | Tissue | Disease Stage |
| Page: 1 |
Top |
Single-cell gene regulatory network inference analysis |
| Find out the significant the regulons (TFs) and the target genes of each regulon across cell types for different disease states |
| TF | Cell Type | Tissue | Disease Stage | Target Gene | RSS | Regulon Activity |
| ∗The dot plots of a searched regulon are shown for all cell subpopulations in each disease state of each tissue based on the regulon specific score inferred using pySCENIC and by calculating the average expression. |
| Page: 1 |
Top |
Somatic mutation of malignant transformation related genes |
| Annotation of somatic variants for genes involved in malignant transformation |
| Hugo Symbol | Variant Class | Variant Classification | dbSNP RS | HGVSc | HGVSp | HGVSp Short | SWISSPROT | BIOTYPE | SIFT | PolyPhen | Tumor Sample Barcode | Tissue | Histology | Sex | Age | Stage | Therapy Types | Drugs | Outcome |
| STK4 | SNV | Missense_Mutation | c.499N>C | p.Asp167His | p.D167H | Q13043 | protein_coding | deleterious(0) | probably_damaging(1) | TCGA-5L-AAT1-01 | Breast | breast invasive carcinoma | Female | <65 | III/IV | Hormone Therapy | letrozol | SD | |
| STK4 | SNV | Missense_Mutation | c.1340N>C | p.Arg447Thr | p.R447T | Q13043 | protein_coding | deleterious(0) | possibly_damaging(0.71) | TCGA-A8-A094-01 | Breast | breast invasive carcinoma | Female | >=65 | I/II | Unknown | Unknown | SD | |
| STK4 | SNV | Missense_Mutation | rs768691855 | c.1408N>T | p.Arg470Trp | p.R470W | Q13043 | protein_coding | deleterious(0) | probably_damaging(0.999) | TCGA-AN-A0FL-01 | Breast | breast invasive carcinoma | Female | <65 | I/II | Unknown | Unknown | SD |
| STK4 | SNV | Missense_Mutation | c.499G>A | p.Asp167Asn | p.D167N | Q13043 | protein_coding | deleterious(0) | probably_damaging(1) | TCGA-E2-A1IN-01 | Breast | breast invasive carcinoma | Female | <65 | I/II | Hormone Therapy | arimidex | SD | |
| STK4 | insertion | Frame_Shift_Ins | novel | c.945_946insCAAACATT | p.Asp316GlnfsTer31 | p.D316Qfs*31 | Q13043 | protein_coding | TCGA-A8-A07O-01 | Breast | breast invasive carcinoma | Female | <65 | I/II | Chemotherapy | CR | |||
| STK4 | insertion | In_Frame_Ins | novel | c.946_947insTGGCAGCTATAACATGTTCCCAAC | p.Asp316delinsValAlaAlaIleThrCysSerGlnHis | p.D316delinsVAAITCSQH | Q13043 | protein_coding | TCGA-A8-A07O-01 | Breast | breast invasive carcinoma | Female | <65 | I/II | Chemotherapy | CR | |||
| STK4 | SNV | Missense_Mutation | novel | c.970G>A | p.Glu324Lys | p.E324K | Q13043 | protein_coding | tolerated(0.11) | benign(0.15) | TCGA-C5-A2LZ-01 | Cervix | cervical & endocervical cancer | Female | >=65 | III/IV | Unknown | Unknown | PD |
| STK4 | SNV | Missense_Mutation | c.535G>A | p.Ala179Thr | p.A179T | Q13043 | protein_coding | deleterious(0) | possibly_damaging(0.905) | TCGA-EA-A3HU-01 | Cervix | cervical & endocervical cancer | Female | <65 | I/II | Unknown | Unknown | SD | |
| STK4 | SNV | Missense_Mutation | novel | c.1364N>C | p.Met455Thr | p.M455T | Q13043 | protein_coding | deleterious(0.01) | probably_damaging(0.965) | TCGA-5M-AAT6-01 | Colorectum | colon adenocarcinoma | Female | <65 | III/IV | Unknown | Unknown | PD |
| STK4 | SNV | Missense_Mutation | c.415N>C | p.Tyr139His | p.Y139H | Q13043 | protein_coding | deleterious(0) | probably_damaging(0.989) | TCGA-A6-6648-01 | Colorectum | colon adenocarcinoma | Male | <65 | I/II | Chemotherapy | oxaliplatin | PD |
| Page: 1 2 3 4 5 |
Top |
Related drugs of malignant transformation related genes |
| Identification of chemicals and drugs interact with genes involved in malignant transfromation |
| (DGIdb 4.0) |
| Entrez ID | Symbol | Category | Interaction Types | Drug Claim Name | Drug Name | PMIDs |
| 6789 | STK4 | KINASE, DRUGGABLE GENOME, ENZYME, SERINE THREONINE KINASE | inhibitor | 252827426 | ||
| 6789 | STK4 | KINASE, DRUGGABLE GENOME, ENZYME, SERINE THREONINE KINASE | inhibitor | 178102336 | BOSUTINIB | |
| 6789 | STK4 | KINASE, DRUGGABLE GENOME, ENZYME, SERINE THREONINE KINASE | inhibitor | 310264738 | CERDULATINIB | |
| 6789 | STK4 | KINASE, DRUGGABLE GENOME, ENZYME, SERINE THREONINE KINASE | inhibitor | HESPERADIN | HESPERADIN | 19035792 |
| Page: 1 |

Copyright 2023-Present -The University of Texas Health Science Center at Houston |