
|
|||||
|
 | |
| |
| |
| |
| |
| |
|
Gene: STK39 |
Gene summary for STK39 |
| Gene information | Species | Human | Gene symbol | STK39 | Gene ID | 27347 |
| Gene name | serine/threonine kinase 39 | |
| Gene Alias | DCHT | |
| Cytomap | 2q24.3 | |
| Gene Type | protein-coding | GO ID | GO:0000165 | UniProtAcc | Q9UEW8 |
Top |
Malignant transformation analysis |
| Identification of the aberrant gene expression in precancerous and cancerous lesions by comparing the gene expression of stem-like cells in diseased tissues with normal stem cells |
| Entrez ID | Symbol | Replicates | Species | Organ | Tissue | Adj P-value | Log2FC | Malignancy |
| 27347 | STK39 | CCI_1 | Human | Cervix | CC | 1.80e-18 | 1.12e+00 | 0.528 |
| 27347 | STK39 | CCI_2 | Human | Cervix | CC | 6.28e-12 | 1.01e+00 | 0.5249 |
| 27347 | STK39 | CCI_3 | Human | Cervix | CC | 6.22e-07 | 5.63e-01 | 0.516 |
| 27347 | STK39 | HTA11_3410_2000001011 | Human | Colorectum | AD | 3.32e-16 | -5.59e-01 | 0.0155 |
| 27347 | STK39 | HTA11_2951_2000001011 | Human | Colorectum | AD | 5.84e-06 | -9.30e-01 | 0.0216 |
| 27347 | STK39 | HTA11_2112_2000001011 | Human | Colorectum | SER | 6.83e-05 | -7.35e-01 | -0.2196 |
| 27347 | STK39 | HTA11_3361_2000001011 | Human | Colorectum | AD | 6.18e-16 | -8.90e-01 | -0.1207 |
| 27347 | STK39 | HTA11_696_2000001011 | Human | Colorectum | AD | 1.63e-03 | -3.21e-01 | -0.1464 |
| 27347 | STK39 | HTA11_866_2000001011 | Human | Colorectum | AD | 2.58e-11 | -4.97e-01 | -0.1001 |
| 27347 | STK39 | HTA11_2992_2000001011 | Human | Colorectum | SER | 7.47e-05 | -5.80e-01 | -0.1706 |
| 27347 | STK39 | HTA11_5212_2000001011 | Human | Colorectum | AD | 5.03e-08 | -7.95e-01 | -0.2061 |
| 27347 | STK39 | HTA11_5216_2000001011 | Human | Colorectum | SER | 4.74e-04 | -7.15e-01 | -0.1462 |
| 27347 | STK39 | HTA11_9341_2000001011 | Human | Colorectum | SER | 1.88e-02 | -5.99e-01 | -0.00410000000000005 |
| 27347 | STK39 | HTA11_866_3004761011 | Human | Colorectum | AD | 2.63e-13 | -6.97e-01 | 0.096 |
| 27347 | STK39 | HTA11_4255_2000001011 | Human | Colorectum | SER | 1.26e-08 | -6.93e-01 | 0.0446 |
| 27347 | STK39 | HTA11_9408_2000001011 | Human | Colorectum | AD | 6.45e-07 | -7.89e-01 | 0.0451 |
| 27347 | STK39 | HTA11_10711_2000001011 | Human | Colorectum | AD | 3.87e-04 | -5.06e-01 | 0.0338 |
| 27347 | STK39 | HTA11_7696_3000711011 | Human | Colorectum | AD | 1.04e-11 | -5.03e-01 | 0.0674 |
| 27347 | STK39 | HTA11_6818_2000001011 | Human | Colorectum | AD | 3.69e-08 | -5.79e-01 | 0.0112 |
| 27347 | STK39 | HTA11_11156_2000001011 | Human | Colorectum | AD | 3.54e-02 | -9.18e-01 | 0.0397 |
| Page: 1 2 3 4 5 6 |
| Tissue | Expression Dynamics | Abbreviation |
| Cervix | 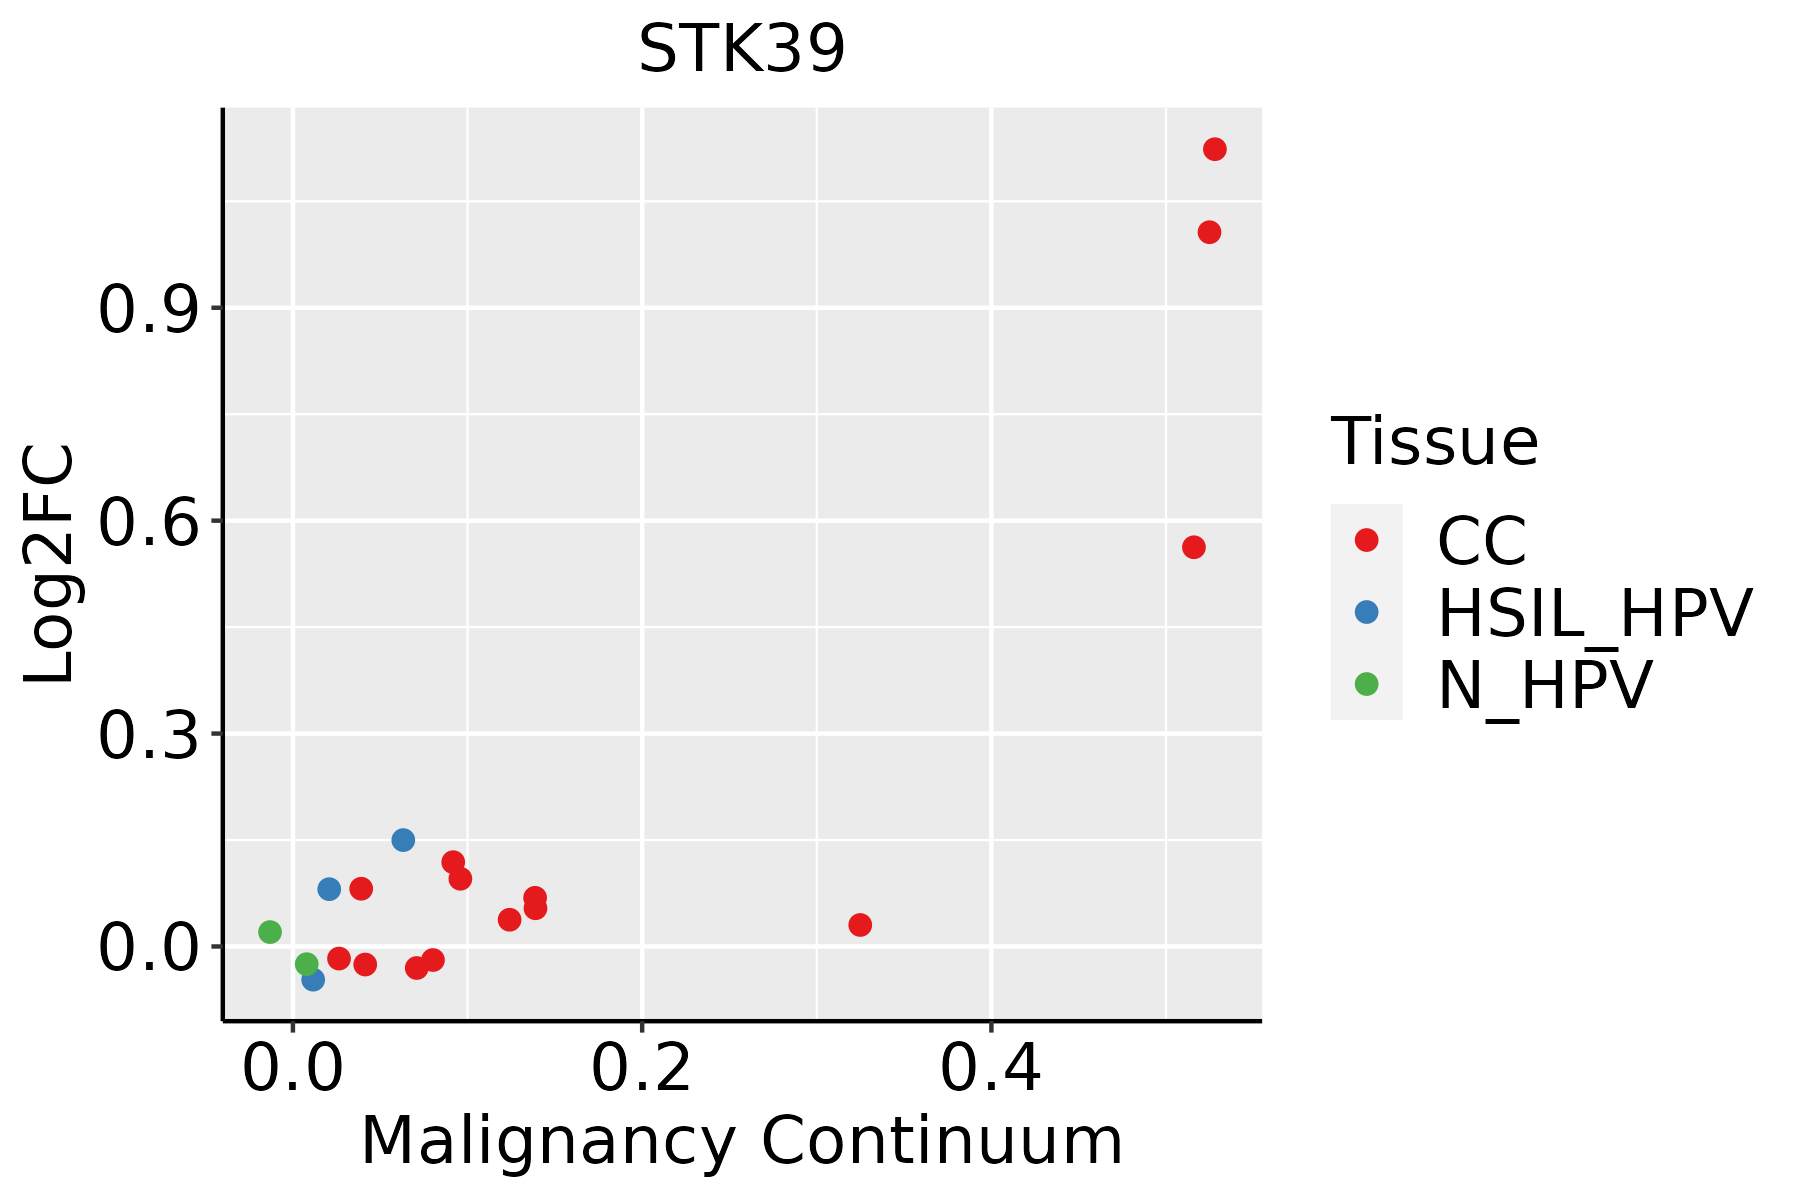 | CC: Cervix cancer |
| HSIL_HPV: HPV-infected high-grade squamous intraepithelial lesions | ||
| N_HPV: HPV-infected normal cervix | ||
| Colorectum (GSE201348) |  | FAP: Familial adenomatous polyposis |
| CRC: Colorectal cancer | ||
| Colorectum (HTA11) | 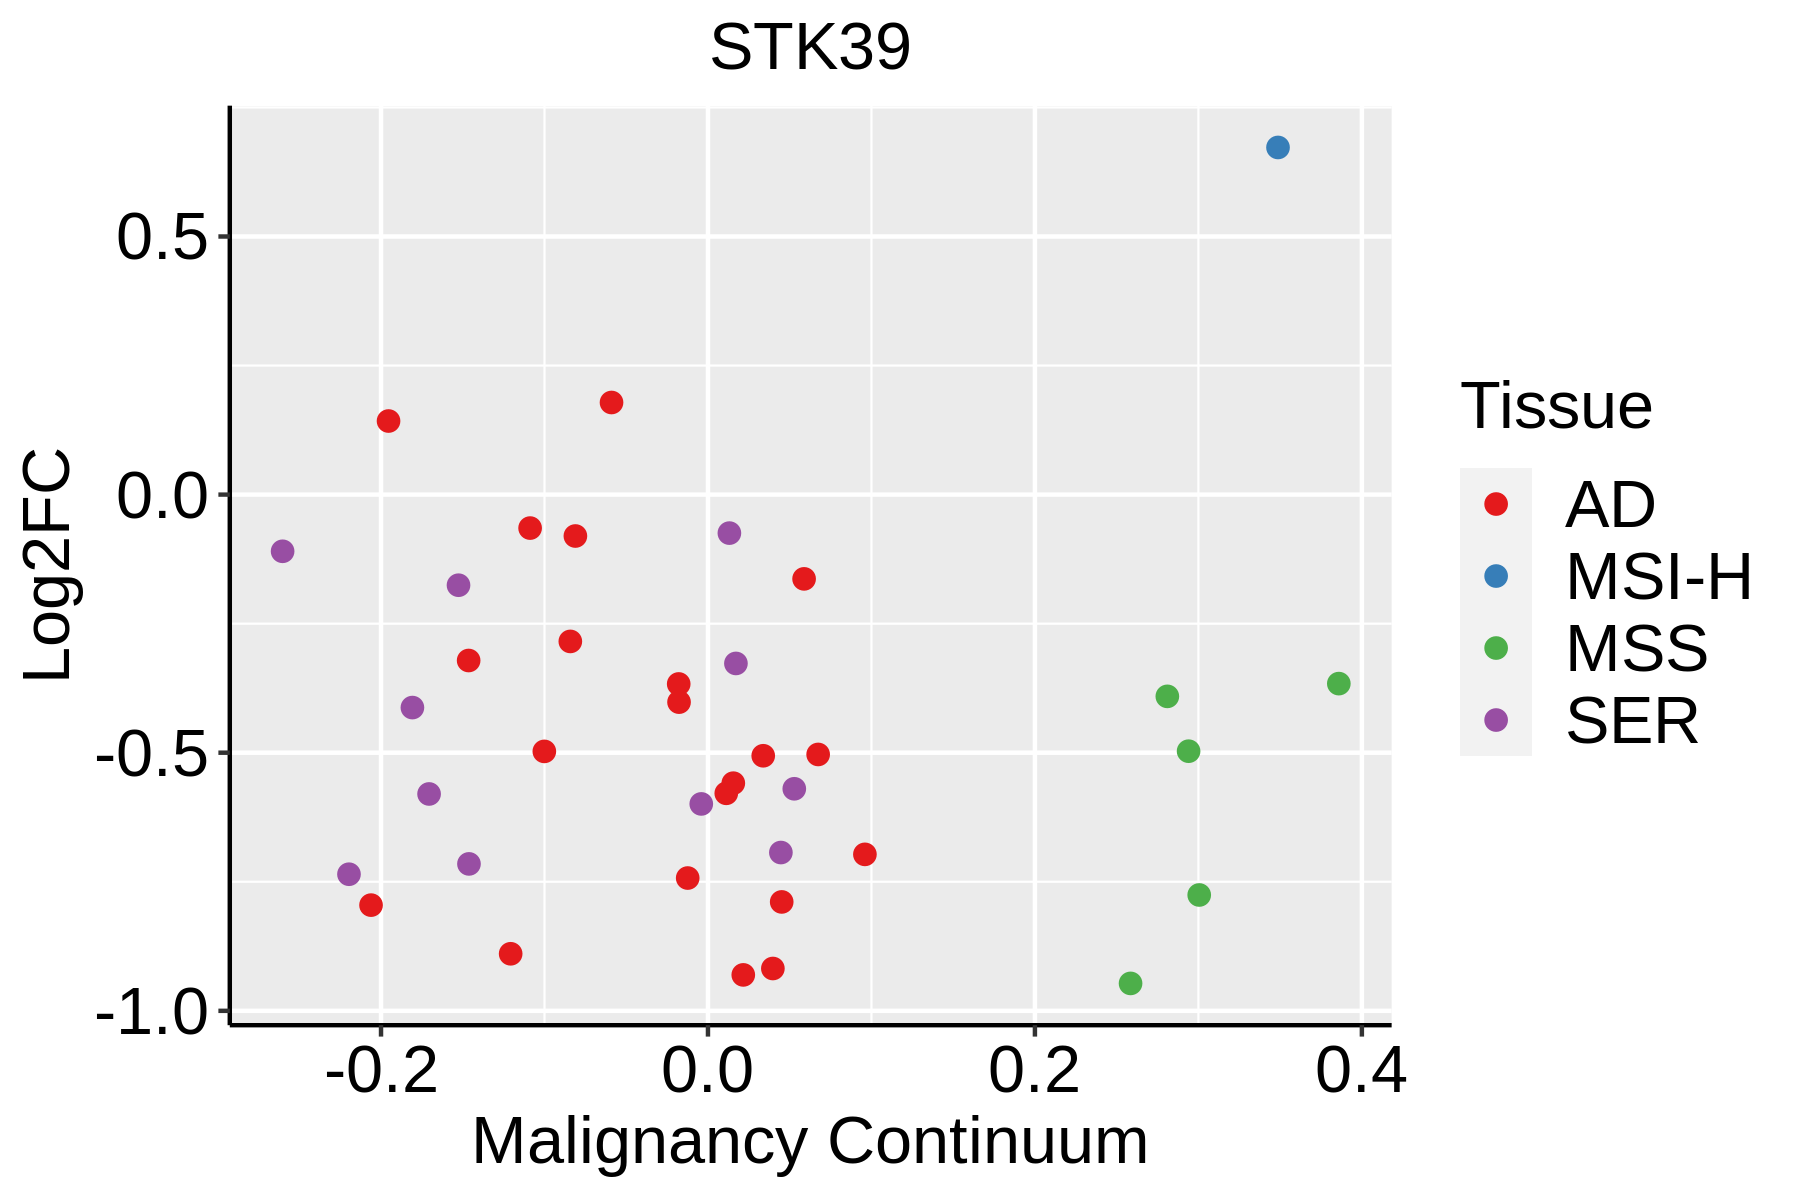 | AD: Adenomas |
| SER: Sessile serrated lesions | ||
| MSI-H: Microsatellite-high colorectal cancer | ||
| MSS: Microsatellite stable colorectal cancer | ||
| Endometrium | 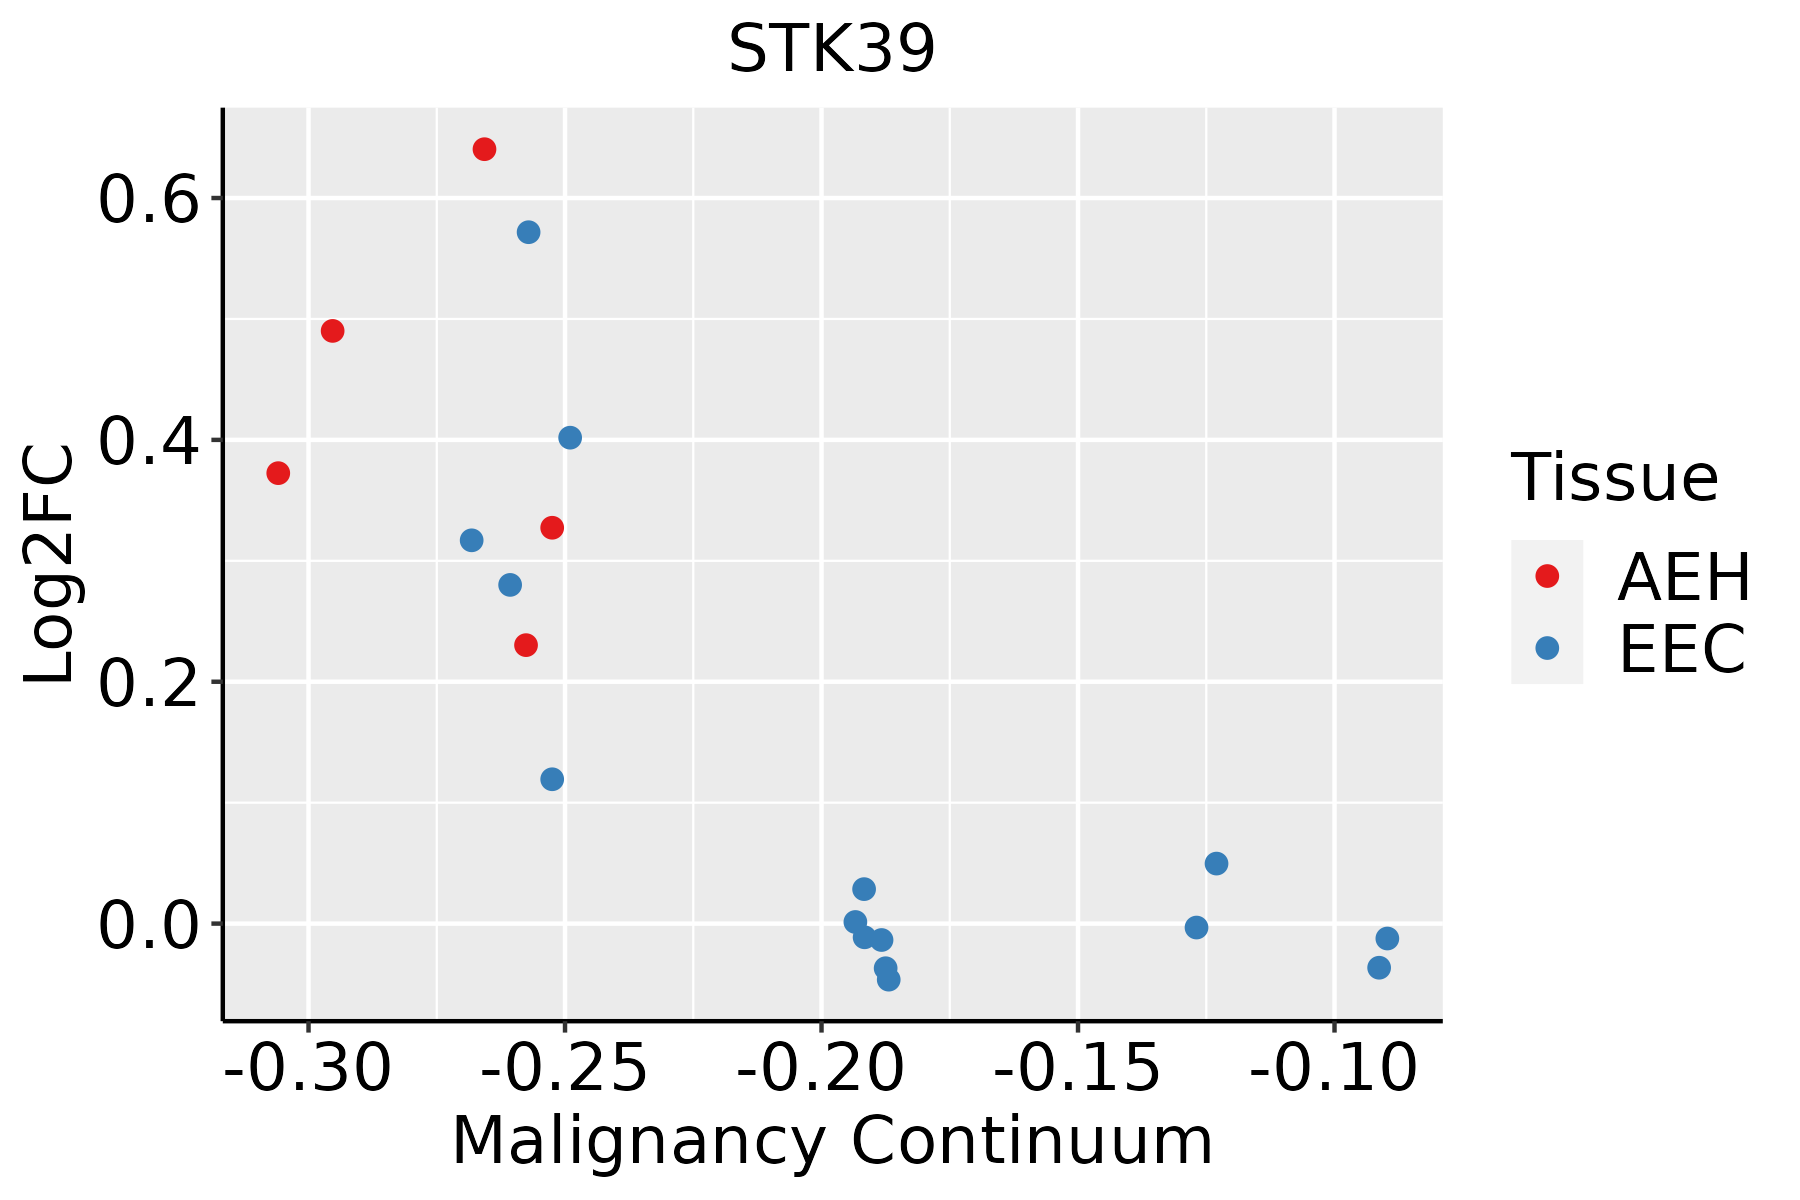 | AEH: Atypical endometrial hyperplasia |
| EEC: Endometrioid Cancer | ||
| Liver | 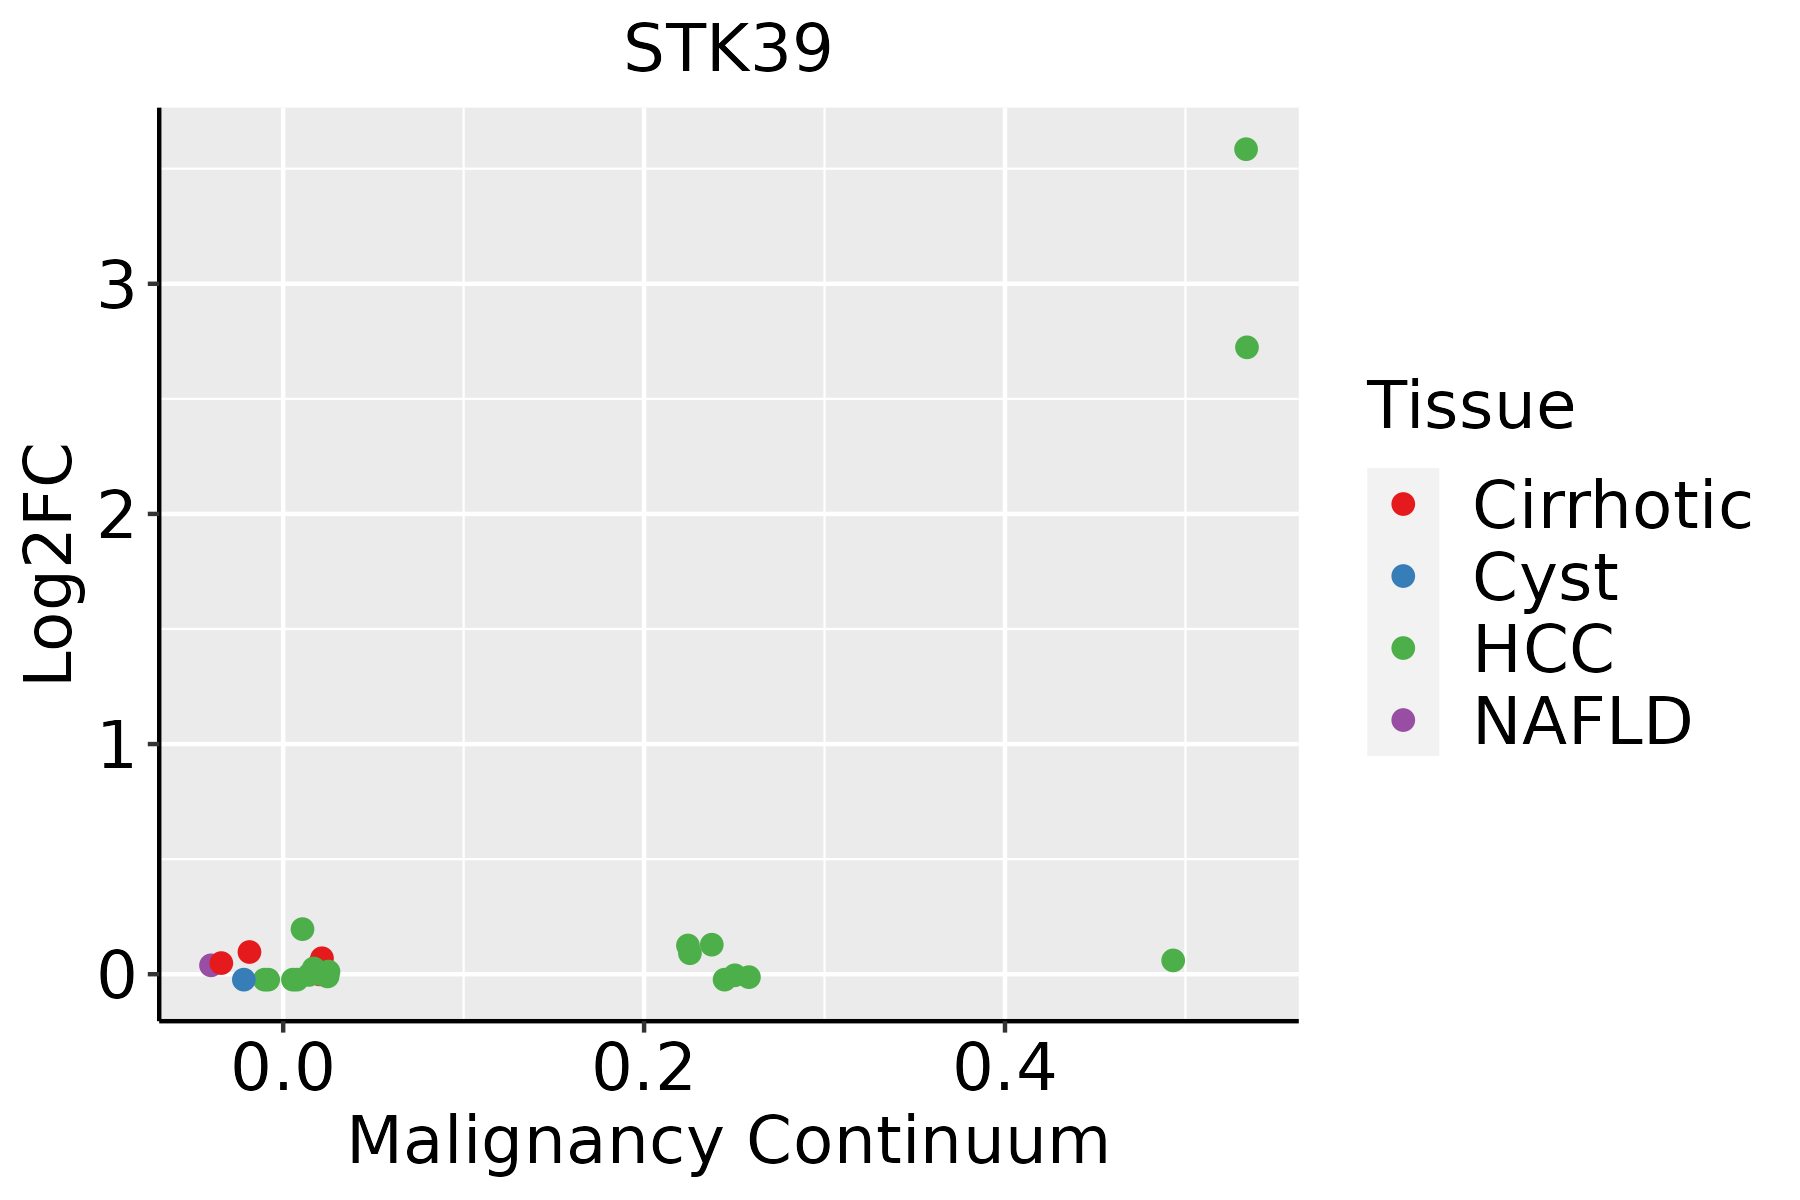 | HCC: Hepatocellular carcinoma |
| NAFLD: Non-alcoholic fatty liver disease | ||
| Lung | 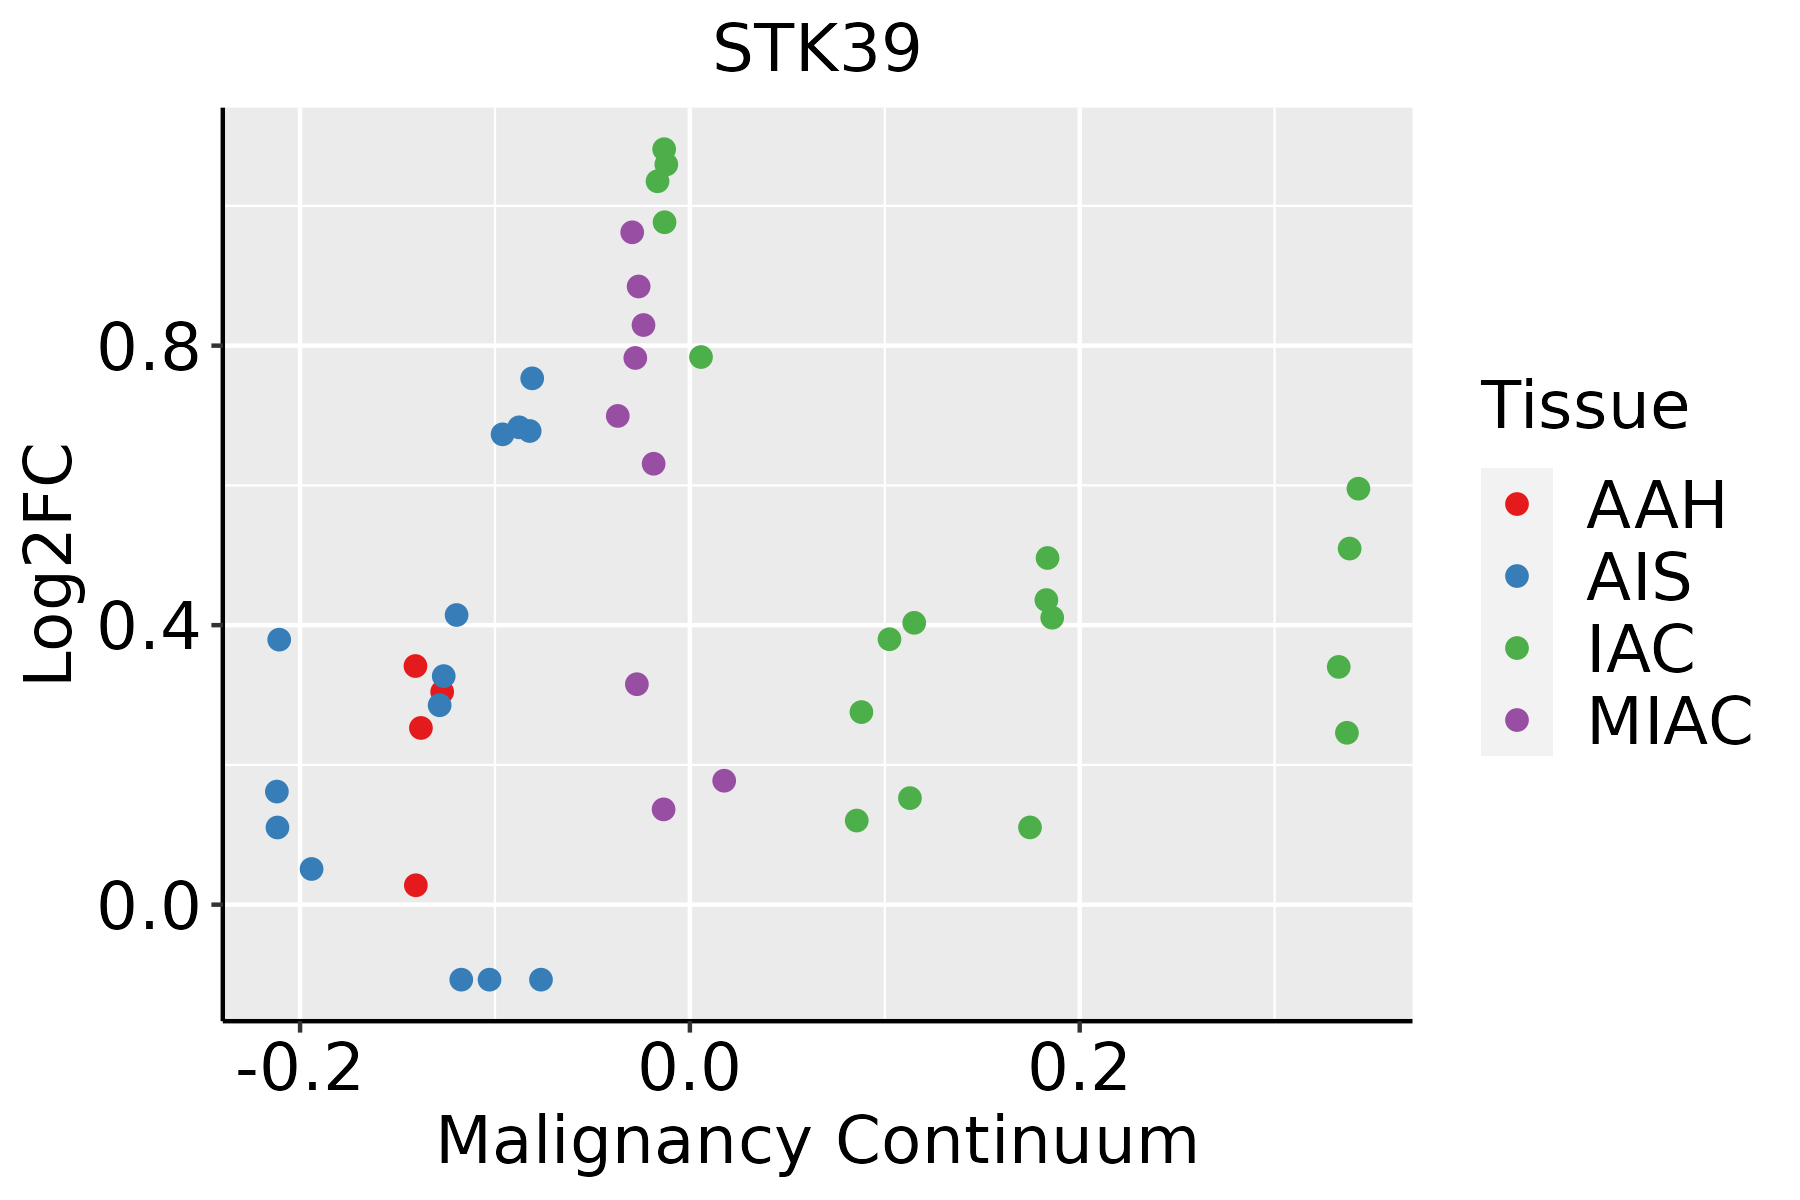 | AAH: Atypical adenomatous hyperplasia |
| AIS: Adenocarcinoma in situ | ||
| IAC: Invasive lung adenocarcinoma | ||
| MIA: Minimally invasive adenocarcinoma | ||
| Prostate |  | BPH: Benign Prostatic Hyperplasia |
| Skin |  | AK: Actinic keratosis |
| cSCC: Cutaneous squamous cell carcinoma | ||
| SCCIS:squamous cell carcinoma in situ |
| ∗log2FC in expression of this searched gene in stem-like cells from each diseased tissue sample relative to stem-like cells in normal samples in each tissue plotted against the malignancy continuum. Samples are colored based on if they are from different disease stage. |
Top |
Malignant transformation related pathway analysis |
| Find out the enriched GO biological processes and KEGG pathways involved in transition from healthy to precancer to cancer |
| Tissue | Disease Stage | Enriched GO biological Processes |
| Colorectum | AD |  |
| Colorectum | SER |  |
| Colorectum | MSS |  |
| Colorectum | MSI-H |  |
| Colorectum | FAP |  |
| ∗Top 15 enriched GO BP terms are showed in the bar plot of each disease state in each tissue. Each row represents a significant GO biological process which is colored according to the -log10(p.adjust). |
| Page: 1 2 3 4 5 6 7 8 9 |
| GO ID | Tissue | Disease Stage | Description | Gene Ratio | Bg Ratio | pvalue | p.adjust | Count |
| GO:00321035 | Cervix | CC | positive regulation of response to external stimulus | 95/2311 | 427/18723 | 5.44e-09 | 5.03e-07 | 95 |
| GO:00603267 | Cervix | CC | cell chemotaxis | 73/2311 | 310/18723 | 2.82e-08 | 1.96e-06 | 73 |
| GO:006219710 | Cervix | CC | cellular response to chemical stress | 76/2311 | 337/18723 | 1.01e-07 | 5.25e-06 | 76 |
| GO:00305957 | Cervix | CC | leukocyte chemotaxis | 57/2311 | 230/18723 | 1.48e-07 | 7.07e-06 | 57 |
| GO:00310988 | Cervix | CC | stress-activated protein kinase signaling cascade | 58/2311 | 247/18723 | 8.02e-07 | 2.89e-05 | 58 |
| GO:00509007 | Cervix | CC | leukocyte migration | 78/2311 | 369/18723 | 1.09e-06 | 3.80e-05 | 78 |
| GO:00026857 | Cervix | CC | regulation of leukocyte migration | 50/2311 | 210/18723 | 2.95e-06 | 8.31e-05 | 50 |
| GO:00514038 | Cervix | CC | stress-activated MAPK cascade | 55/2311 | 239/18723 | 2.96e-06 | 8.31e-05 | 55 |
| GO:00026888 | Cervix | CC | regulation of leukocyte chemotaxis | 34/2311 | 122/18723 | 3.00e-06 | 8.38e-05 | 34 |
| GO:005087810 | Cervix | CC | regulation of body fluid levels | 78/2311 | 379/18723 | 3.20e-06 | 8.77e-05 | 78 |
| GO:00712148 | Cervix | CC | cellular response to abiotic stimulus | 69/2311 | 331/18723 | 7.36e-06 | 1.73e-04 | 69 |
| GO:01040048 | Cervix | CC | cellular response to environmental stimulus | 69/2311 | 331/18723 | 7.36e-06 | 1.73e-04 | 69 |
| GO:00509203 | Cervix | CC | regulation of chemotaxis | 51/2311 | 223/18723 | 8.03e-06 | 1.86e-04 | 51 |
| GO:00703027 | Cervix | CC | regulation of stress-activated protein kinase signaling cascade | 46/2311 | 195/18723 | 9.35e-06 | 2.11e-04 | 46 |
| GO:00026878 | Cervix | CC | positive regulation of leukocyte migration | 35/2311 | 135/18723 | 1.25e-05 | 2.60e-04 | 35 |
| GO:00716755 | Cervix | CC | regulation of mononuclear cell migration | 31/2311 | 115/18723 | 1.67e-05 | 3.22e-04 | 31 |
| GO:00018949 | Cervix | CC | tissue homeostasis | 57/2311 | 268/18723 | 2.43e-05 | 4.21e-04 | 57 |
| GO:00434104 | Cervix | CC | positive regulation of MAPK cascade | 90/2311 | 480/18723 | 2.92e-05 | 4.83e-04 | 90 |
| GO:00328727 | Cervix | CC | regulation of stress-activated MAPK cascade | 44/2311 | 192/18723 | 3.09e-05 | 5.10e-04 | 44 |
| GO:00507273 | Cervix | CC | regulation of inflammatory response | 75/2311 | 386/18723 | 3.95e-05 | 6.18e-04 | 75 |
| Page: 1 2 3 4 5 6 7 8 9 10 11 12 13 14 15 16 17 18 19 20 21 22 23 24 |
| Pathway ID | Tissue | Disease Stage | Description | Gene Ratio | Bg Ratio | pvalue | p.adjust | qvalue | Count |
| Page: 1 |
Top |
Cell-cell communication analysis |
| Identification of potential cell-cell interactions between two cell types and their ligand-receptor pairs for different disease states |
| Ligand | Receptor | LRpair | Pathway | Tissue | Disease Stage |
| Page: 1 |
Top |
Single-cell gene regulatory network inference analysis |
| Find out the significant the regulons (TFs) and the target genes of each regulon across cell types for different disease states |
| TF | Cell Type | Tissue | Disease Stage | Target Gene | RSS | Regulon Activity |
| ∗The dot plots of a searched regulon are shown for all cell subpopulations in each disease state of each tissue based on the regulon specific score inferred using pySCENIC and by calculating the average expression. |
| Page: 1 |
Top |
Somatic mutation of malignant transformation related genes |
| Annotation of somatic variants for genes involved in malignant transformation |
| Hugo Symbol | Variant Class | Variant Classification | dbSNP RS | HGVSc | HGVSp | HGVSp Short | SWISSPROT | BIOTYPE | SIFT | PolyPhen | Tumor Sample Barcode | Tissue | Histology | Sex | Age | Stage | Therapy Types | Drugs | Outcome |
| STK39 | SNV | Missense_Mutation | c.1466N>A | p.Ala489Asp | p.A489D | Q9UEW8 | protein_coding | deleterious(0) | probably_damaging(0.978) | TCGA-AC-A2FF-01 | Breast | breast invasive carcinoma | Female | <65 | I/II | Chemotherapy | cytoxan | CR | |
| STK39 | insertion | Nonsense_Mutation | novel | c.210_211insTAGAGCTTGGCTCTCTGGTTTGTGATCAACCTCA | p.Ser71Ter | p.S71* | Q9UEW8 | protein_coding | TCGA-AN-A0FS-01 | Breast | breast invasive carcinoma | Female | <65 | I/II | Unknown | Unknown | SD | ||
| STK39 | insertion | Nonsense_Mutation | novel | c.1193_1194insCTGGTCATCTTTTGATTAAGAGATCGTATTTGATTT | p.Ala398_Ala399insTrpSerSerPheAspTerGluIleValPheAspLeu | p.A398_A399insWSSFD*EIVFDL | Q9UEW8 | protein_coding | TCGA-AN-A0FX-01 | Breast | breast invasive carcinoma | Female | <65 | I/II | Unknown | Unknown | SD | ||
| STK39 | deletion | Frame_Shift_Del | novel | c.1269delC | p.Glu424AsnfsTer29 | p.E424Nfs*29 | Q9UEW8 | protein_coding | TCGA-D8-A27V-01 | Breast | breast invasive carcinoma | Female | <65 | I/II | Hormone Therapy | tamoxiphen | SD | ||
| STK39 | insertion | Frame_Shift_Ins | novel | c.973_974insTCCTTCCAAAA | p.Arg325IlefsTer12 | p.R325Ifs*12 | Q9UEW8 | protein_coding | TCGA-E2-A15P-01 | Breast | breast invasive carcinoma | Female | <65 | I/II | Hormone Therapy | arimidex | SD | ||
| STK39 | SNV | Missense_Mutation | c.361N>T | p.Val121Leu | p.V121L | Q9UEW8 | protein_coding | tolerated(0.07) | possibly_damaging(0.546) | TCGA-DG-A2KK-01 | Cervix | cervical & endocervical cancer | Female | <65 | III/IV | Chemotherapy | cisplatin | SD | |
| STK39 | SNV | Missense_Mutation | novel | c.1582T>G | p.Ser528Ala | p.S528A | Q9UEW8 | protein_coding | tolerated(0.14) | benign(0.045) | TCGA-DS-A1OB-01 | Cervix | cervical & endocervical cancer | Female | <65 | I/II | Chemotherapy | carboplatin | PD |
| STK39 | SNV | Missense_Mutation | novel | c.564N>C | p.Gln188His | p.Q188H | Q9UEW8 | protein_coding | tolerated(0.28) | possibly_damaging(0.859) | TCGA-VS-A94X-01 | Cervix | cervical & endocervical cancer | Female | <65 | I/II | Chemotherapy | cisplatin | PD |
| STK39 | SNV | Missense_Mutation | novel | c.562N>G | p.Gln188Glu | p.Q188E | Q9UEW8 | protein_coding | deleterious(0) | probably_damaging(0.981) | TCGA-ZJ-AAXD-01 | Cervix | cervical & endocervical cancer | Female | <65 | III/IV | Unknown | Unknown | SD |
| STK39 | SNV | Missense_Mutation | c.442G>A | p.Asp148Asn | p.D148N | Q9UEW8 | protein_coding | deleterious(0.02) | probably_damaging(1) | TCGA-AA-3510-01 | Colorectum | colon adenocarcinoma | Male | >=65 | I/II | Unknown | Unknown | SD |
| Page: 1 2 3 4 5 6 7 |
Top |
Related drugs of malignant transformation related genes |
| Identification of chemicals and drugs interact with genes involved in malignant transfromation |
| (DGIdb 4.0) |
| Entrez ID | Symbol | Category | Interaction Types | Drug Claim Name | Drug Name | PMIDs |
| 27347 | STK39 | KINASE, DRUGGABLE GENOME, SERINE THREONINE KINASE, ENZYME | losartan | LOSARTAN | 21993215 |
| Page: 1 |

Copyright 2023-Present -The University of Texas Health Science Center at Houston |