
|
|||||
|
 | |
| |
| |
| |
| |
| |
|
Gene: STK38 |
Gene summary for STK38 |
| Gene information | Species | Human | Gene symbol | STK38 | Gene ID | 11329 |
| Gene name | serine/threonine kinase 38 | |
| Gene Alias | NDR | |
| Cytomap | 6p21.31 | |
| Gene Type | protein-coding | GO ID | GO:0000165 | UniProtAcc | A0A024RD18 |
Top |
Malignant transformation analysis |
| Identification of the aberrant gene expression in precancerous and cancerous lesions by comparing the gene expression of stem-like cells in diseased tissues with normal stem cells |
| Entrez ID | Symbol | Replicates | Species | Organ | Tissue | Adj P-value | Log2FC | Malignancy |
| 11329 | STK38 | CCI_1 | Human | Cervix | CC | 1.16e-09 | 1.11e+00 | 0.528 |
| 11329 | STK38 | CCI_2 | Human | Cervix | CC | 1.06e-08 | 1.15e+00 | 0.5249 |
| 11329 | STK38 | CCI_3 | Human | Cervix | CC | 2.50e-12 | 9.14e-01 | 0.516 |
| 11329 | STK38 | sample3 | Human | Cervix | CC | 8.28e-05 | 2.34e-01 | 0.1387 |
| 11329 | STK38 | T3 | Human | Cervix | CC | 1.95e-03 | 2.27e-01 | 0.1389 |
| 11329 | STK38 | HTA11_1938_2000001011 | Human | Colorectum | AD | 2.36e-07 | 6.29e-01 | -0.0811 |
| 11329 | STK38 | HTA11_78_2000001011 | Human | Colorectum | AD | 1.72e-02 | 5.00e-01 | -0.1088 |
| 11329 | STK38 | HTA11_347_2000001011 | Human | Colorectum | AD | 1.69e-22 | 8.64e-01 | -0.1954 |
| 11329 | STK38 | HTA11_83_2000001011 | Human | Colorectum | SER | 1.03e-03 | 5.62e-01 | -0.1526 |
| 11329 | STK38 | HTA11_866_2000001011 | Human | Colorectum | AD | 3.25e-07 | 5.47e-01 | -0.1001 |
| 11329 | STK38 | HTA11_1391_2000001011 | Human | Colorectum | AD | 3.78e-09 | 8.04e-01 | -0.059 |
| 11329 | STK38 | HTA11_546_2000001011 | Human | Colorectum | AD | 4.56e-04 | 5.79e-01 | -0.0842 |
| 11329 | STK38 | HTA11_10623_2000001011 | Human | Colorectum | AD | 3.66e-03 | 6.05e-01 | -0.0177 |
| 11329 | STK38 | HTA11_10711_2000001011 | Human | Colorectum | AD | 2.22e-03 | 4.92e-01 | 0.0338 |
| 11329 | STK38 | HTA11_99999965104_69814 | Human | Colorectum | MSS | 6.43e-10 | 8.07e-01 | 0.281 |
| 11329 | STK38 | F007 | Human | Colorectum | FAP | 1.38e-05 | 3.34e-01 | 0.1176 |
| 11329 | STK38 | A002-C-010 | Human | Colorectum | FAP | 1.40e-05 | 2.07e-01 | 0.242 |
| 11329 | STK38 | A001-C-207 | Human | Colorectum | FAP | 1.00e-04 | 9.61e-02 | 0.1278 |
| 11329 | STK38 | A015-C-203 | Human | Colorectum | FAP | 1.57e-47 | 4.42e-01 | -0.1294 |
| 11329 | STK38 | A015-C-204 | Human | Colorectum | FAP | 8.76e-08 | 9.41e-02 | -0.0228 |
| Page: 1 2 3 4 5 6 7 8 |
| Tissue | Expression Dynamics | Abbreviation |
| Cervix |  | CC: Cervix cancer |
| HSIL_HPV: HPV-infected high-grade squamous intraepithelial lesions | ||
| N_HPV: HPV-infected normal cervix | ||
| Colorectum (GSE201348) |  | FAP: Familial adenomatous polyposis |
| CRC: Colorectal cancer | ||
| Colorectum (HTA11) |  | AD: Adenomas |
| SER: Sessile serrated lesions | ||
| MSI-H: Microsatellite-high colorectal cancer | ||
| MSS: Microsatellite stable colorectal cancer | ||
| Esophagus | 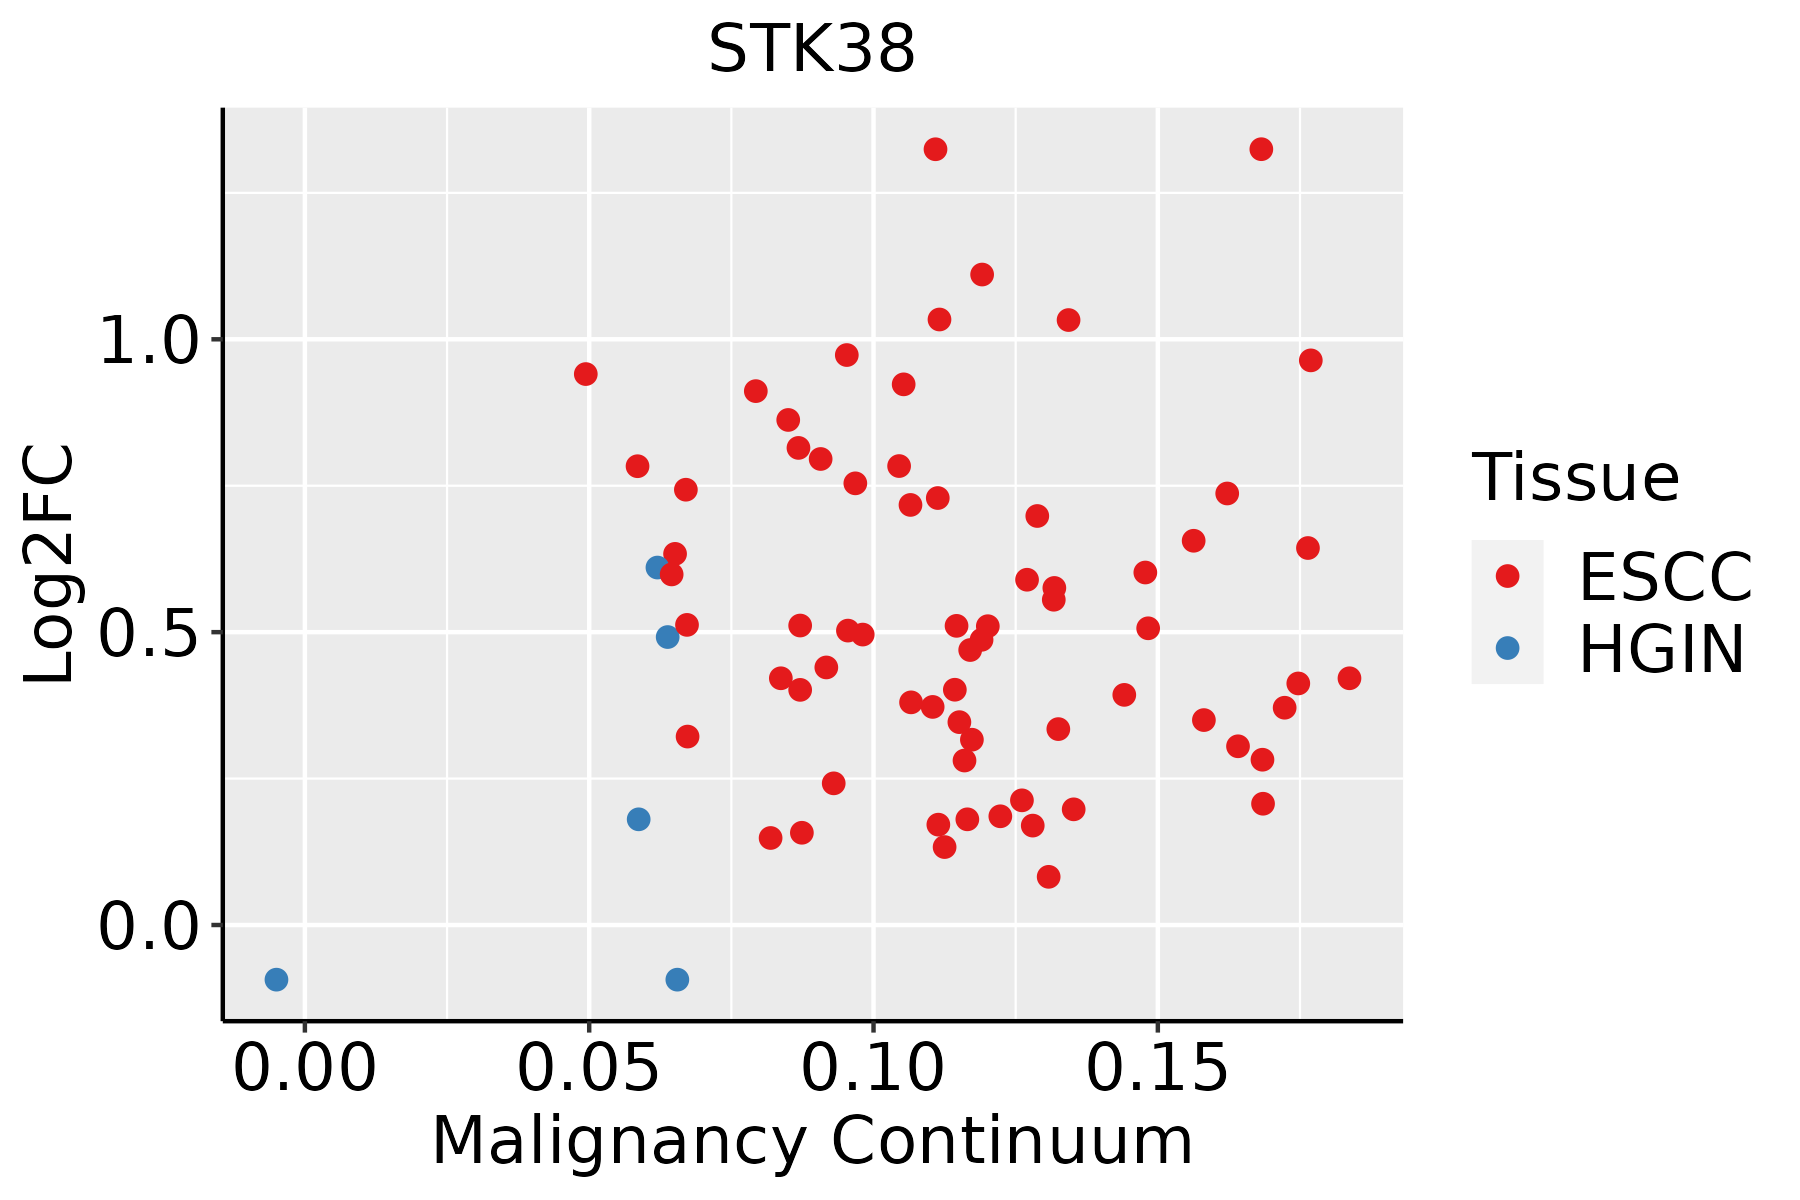 | ESCC: Esophageal squamous cell carcinoma |
| HGIN: High-grade intraepithelial neoplasias | ||
| LGIN: Low-grade intraepithelial neoplasias | ||
| Liver | 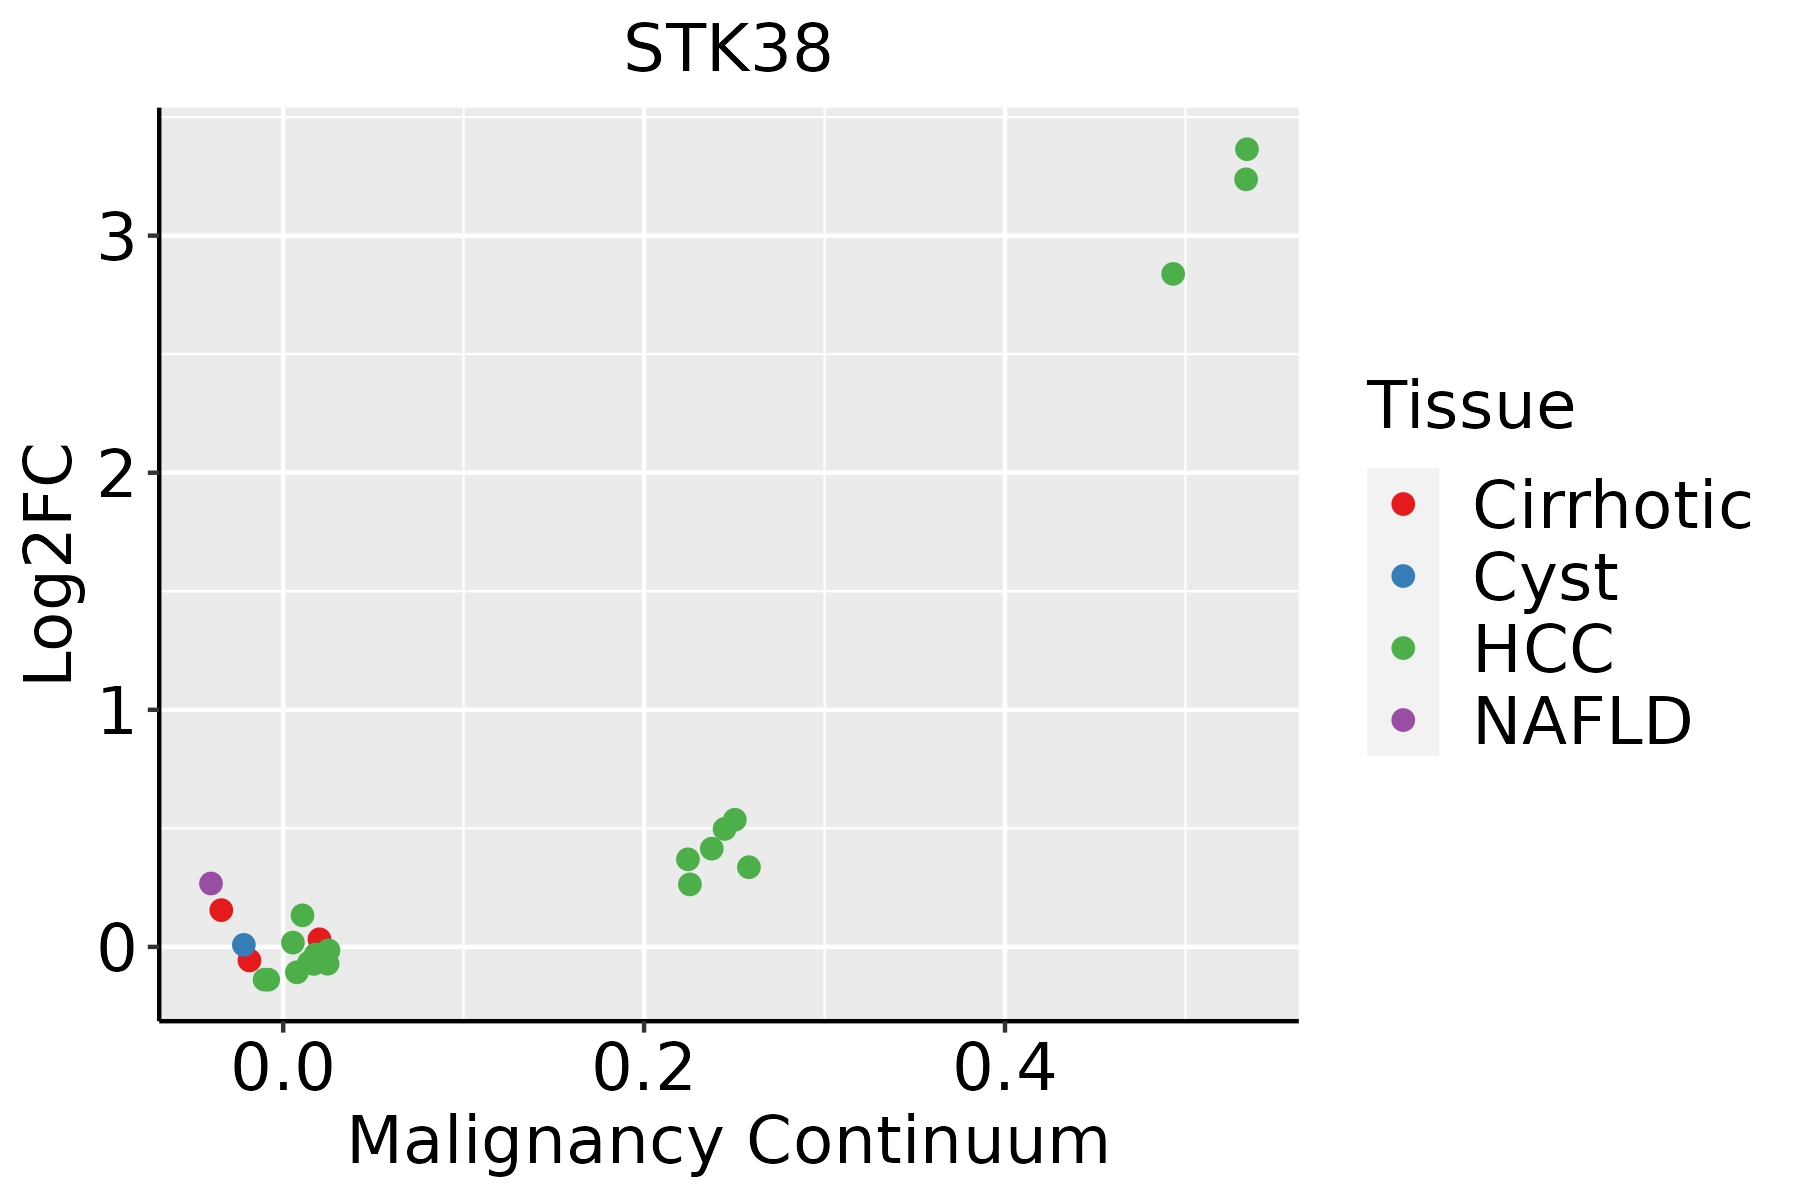 | HCC: Hepatocellular carcinoma |
| NAFLD: Non-alcoholic fatty liver disease | ||
| Oral Cavity |  | EOLP: Erosive Oral lichen planus |
| LP: leukoplakia | ||
| NEOLP: Non-erosive oral lichen planus | ||
| OSCC: Oral squamous cell carcinoma | ||
| Thyroid | 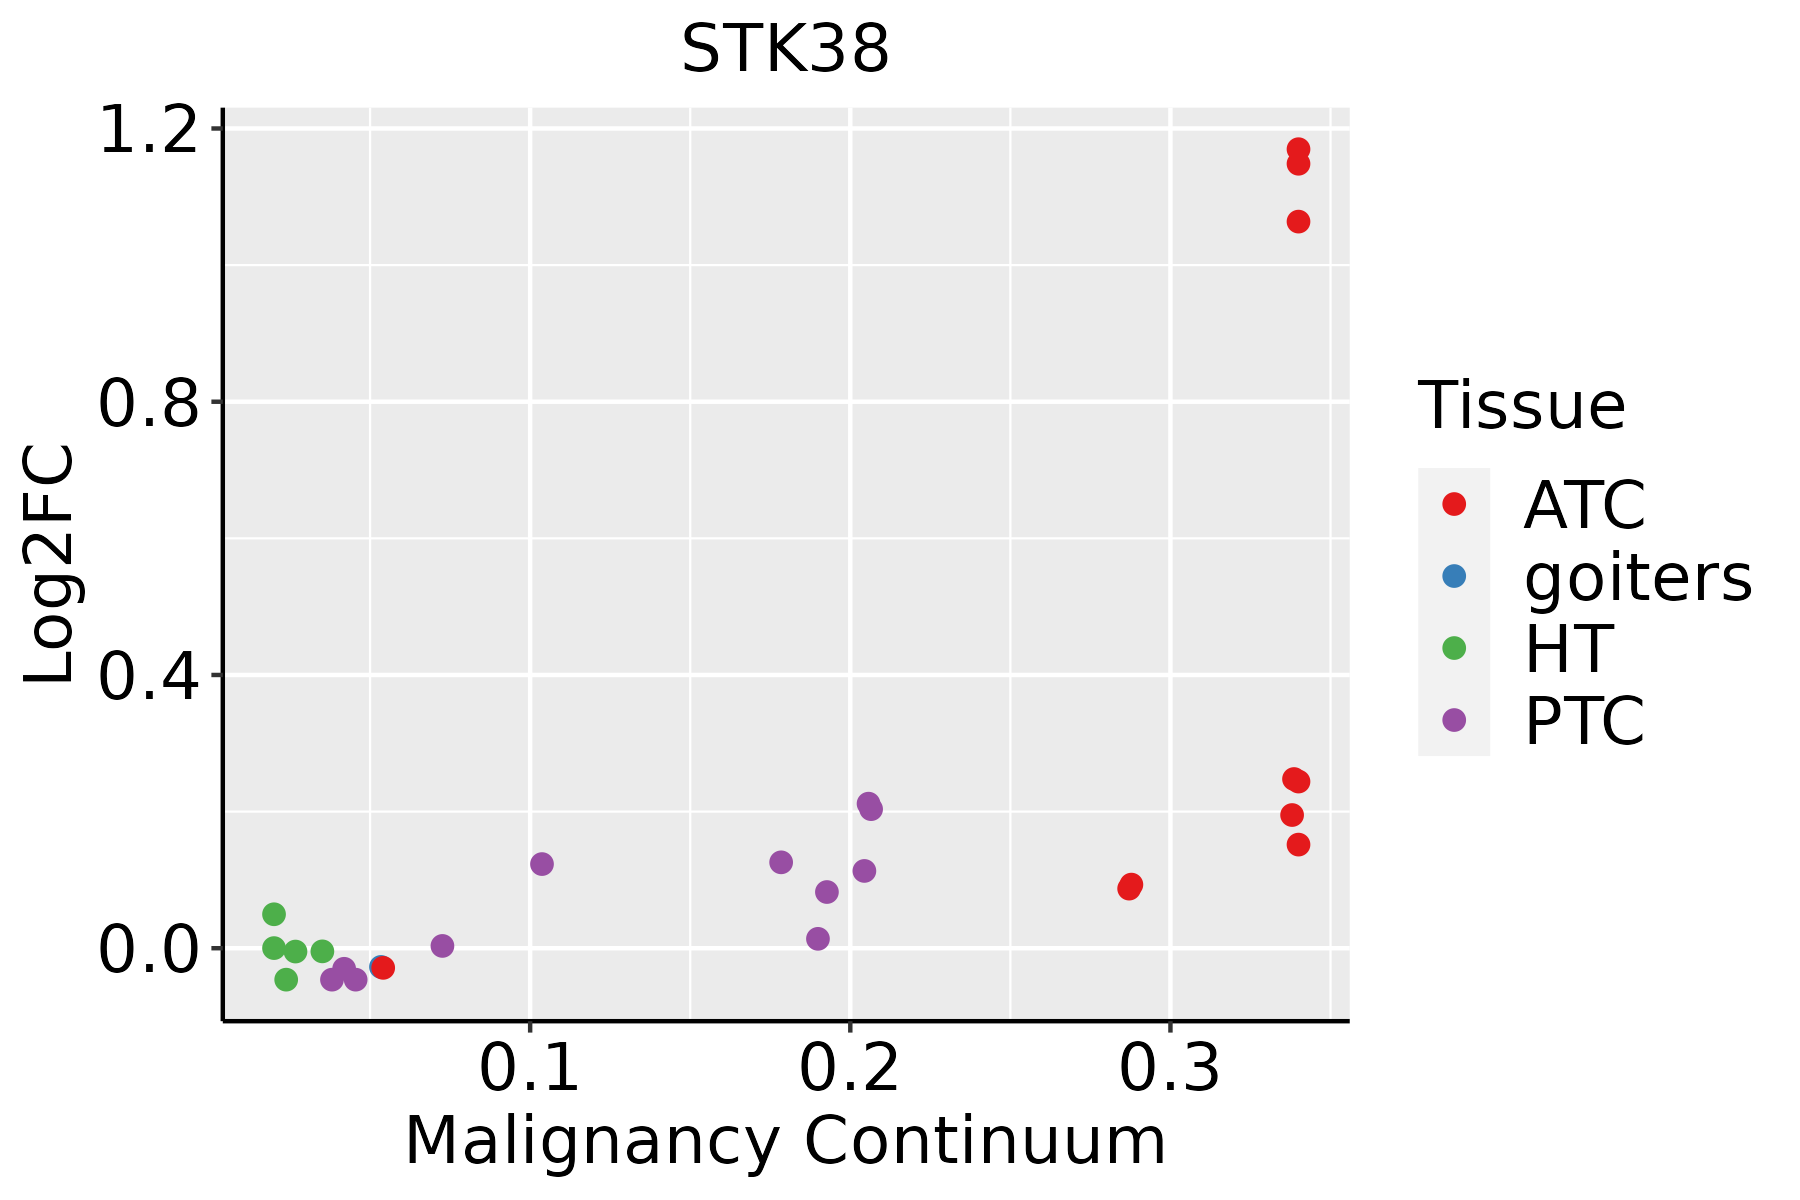 | ATC: Anaplastic thyroid cancer |
| HT: Hashimoto's thyroiditis | ||
| PTC: Papillary thyroid cancer |
| ∗log2FC in expression of this searched gene in stem-like cells from each diseased tissue sample relative to stem-like cells in normal samples in each tissue plotted against the malignancy continuum. Samples are colored based on if they are from different disease stage. |
Top |
Malignant transformation related pathway analysis |
| Find out the enriched GO biological processes and KEGG pathways involved in transition from healthy to precancer to cancer |
| Tissue | Disease Stage | Enriched GO biological Processes |
| Colorectum | AD |  |
| Colorectum | SER |  |
| Colorectum | MSS |  |
| Colorectum | MSI-H |  |
| Colorectum | FAP |  |
| ∗Top 15 enriched GO BP terms are showed in the bar plot of each disease state in each tissue. Each row represents a significant GO biological process which is colored according to the -log10(p.adjust). |
| Page: 1 2 3 4 5 6 7 8 9 |
| GO ID | Tissue | Disease Stage | Description | Gene Ratio | Bg Ratio | pvalue | p.adjust | Count |
| GO:00719007 | Cervix | CC | regulation of protein serine/threonine kinase activity | 75/2311 | 359/18723 | 2.76e-06 | 8.02e-05 | 75 |
| GO:005134810 | Cervix | CC | negative regulation of transferase activity | 60/2311 | 268/18723 | 2.77e-06 | 8.02e-05 | 60 |
| GO:004593610 | Cervix | CC | negative regulation of phosphate metabolic process | 88/2311 | 441/18723 | 2.92e-06 | 8.27e-05 | 88 |
| GO:001056310 | Cervix | CC | negative regulation of phosphorus metabolic process | 88/2311 | 442/18723 | 3.21e-06 | 8.77e-05 | 88 |
| GO:004232610 | Cervix | CC | negative regulation of phosphorylation | 77/2311 | 385/18723 | 1.09e-05 | 2.38e-04 | 77 |
| GO:000193310 | Cervix | CC | negative regulation of protein phosphorylation | 69/2311 | 342/18723 | 2.29e-05 | 4.01e-04 | 69 |
| GO:000646910 | Cervix | CC | negative regulation of protein kinase activity | 47/2311 | 212/18723 | 4.13e-05 | 6.36e-04 | 47 |
| GO:00181057 | Cervix | CC | peptidyl-serine phosphorylation | 63/2311 | 315/18723 | 6.65e-05 | 9.47e-04 | 63 |
| GO:00336739 | Cervix | CC | negative regulation of kinase activity | 50/2311 | 237/18723 | 9.22e-05 | 1.21e-03 | 50 |
| GO:00182096 | Cervix | CC | peptidyl-serine modification | 66/2311 | 338/18723 | 9.58e-05 | 1.25e-03 | 66 |
| GO:00434099 | Cervix | CC | negative regulation of MAPK cascade | 37/2311 | 180/18723 | 1.17e-03 | 9.50e-03 | 37 |
| GO:0010563 | Colorectum | AD | negative regulation of phosphorus metabolic process | 130/3918 | 442/18723 | 1.26e-05 | 2.76e-04 | 130 |
| GO:0045936 | Colorectum | AD | negative regulation of phosphate metabolic process | 129/3918 | 441/18723 | 1.81e-05 | 3.76e-04 | 129 |
| GO:0051348 | Colorectum | AD | negative regulation of transferase activity | 85/3918 | 268/18723 | 2.07e-05 | 4.19e-04 | 85 |
| GO:0042326 | Colorectum | AD | negative regulation of phosphorylation | 112/3918 | 385/18723 | 8.02e-05 | 1.27e-03 | 112 |
| GO:0001933 | Colorectum | AD | negative regulation of protein phosphorylation | 101/3918 | 342/18723 | 9.39e-05 | 1.42e-03 | 101 |
| GO:0043409 | Colorectum | AD | negative regulation of MAPK cascade | 57/3918 | 180/18723 | 4.61e-04 | 5.14e-03 | 57 |
| GO:0006469 | Colorectum | AD | negative regulation of protein kinase activity | 65/3918 | 212/18723 | 5.21e-04 | 5.62e-03 | 65 |
| GO:0033673 | Colorectum | AD | negative regulation of kinase activity | 71/3918 | 237/18723 | 6.18e-04 | 6.47e-03 | 71 |
| GO:0018105 | Colorectum | AD | peptidyl-serine phosphorylation | 88/3918 | 315/18723 | 1.73e-03 | 1.43e-02 | 88 |
| Page: 1 2 3 4 5 6 7 8 9 |
| Pathway ID | Tissue | Disease Stage | Description | Gene Ratio | Bg Ratio | pvalue | p.adjust | qvalue | Count |
| Page: 1 |
Top |
Cell-cell communication analysis |
| Identification of potential cell-cell interactions between two cell types and their ligand-receptor pairs for different disease states |
| Ligand | Receptor | LRpair | Pathway | Tissue | Disease Stage |
| Page: 1 |
Top |
Single-cell gene regulatory network inference analysis |
| Find out the significant the regulons (TFs) and the target genes of each regulon across cell types for different disease states |
| TF | Cell Type | Tissue | Disease Stage | Target Gene | RSS | Regulon Activity |
| ∗The dot plots of a searched regulon are shown for all cell subpopulations in each disease state of each tissue based on the regulon specific score inferred using pySCENIC and by calculating the average expression. |
| Page: 1 |
Top |
Somatic mutation of malignant transformation related genes |
| Annotation of somatic variants for genes involved in malignant transformation |
| Hugo Symbol | Variant Class | Variant Classification | dbSNP RS | HGVSc | HGVSp | HGVSp Short | SWISSPROT | BIOTYPE | SIFT | PolyPhen | Tumor Sample Barcode | Tissue | Histology | Sex | Age | Stage | Therapy Types | Drugs | Outcome |
| STK38 | SNV | Missense_Mutation | novel | c.160N>A | p.Glu54Lys | p.E54K | Q15208 | protein_coding | tolerated(0.16) | benign(0.005) | TCGA-AC-A5XS-01 | Breast | breast invasive carcinoma | Female | >=65 | I/II | Hormone Therapy | femara | SD |
| STK38 | SNV | Missense_Mutation | novel | c.1255N>G | p.Leu419Val | p.L419V | Q15208 | protein_coding | tolerated(0.3) | benign(0.158) | TCGA-BH-A0B6-01 | Breast | breast invasive carcinoma | Female | <65 | I/II | Unknown | Unknown | SD |
| STK38 | SNV | Missense_Mutation | novel | c.379N>C | p.Glu127Gln | p.E127Q | Q15208 | protein_coding | tolerated(0.16) | benign(0.362) | TCGA-BH-A2L8-01 | Breast | breast invasive carcinoma | Female | <65 | I/II | Chemotherapy | cytoxan | CR |
| STK38 | SNV | Missense_Mutation | c.601G>T | p.Asp201Tyr | p.D201Y | Q15208 | protein_coding | deleterious(0) | possibly_damaging(0.781) | TCGA-2W-A8YY-01 | Cervix | cervical & endocervical cancer | Female | <65 | I/II | Chemotherapy | cisplatin | CR | |
| STK38 | SNV | Missense_Mutation | c.639N>G | p.Ile213Met | p.I213M | Q15208 | protein_coding | deleterious(0) | probably_damaging(0.982) | TCGA-EK-A2RK-01 | Cervix | cervical & endocervical cancer | Female | >=65 | I/II | Unknown | Unknown | SD | |
| STK38 | SNV | Missense_Mutation | c.766N>A | p.Asp256Asn | p.D256N | Q15208 | protein_coding | tolerated(0.23) | probably_damaging(0.969) | TCGA-JW-A5VL-01 | Cervix | cervical & endocervical cancer | Female | <65 | I/II | Unknown | Unknown | SD | |
| STK38 | SNV | Missense_Mutation | c.1069A>G | p.Ile357Val | p.I357V | Q15208 | protein_coding | tolerated(0.09) | benign(0.192) | TCGA-AA-3856-01 | Colorectum | colon adenocarcinoma | Male | <65 | I/II | Unknown | Unknown | SD | |
| STK38 | SNV | Missense_Mutation | c.813N>C | p.Trp271Cys | p.W271C | Q15208 | protein_coding | deleterious(0) | probably_damaging(0.999) | TCGA-AZ-6599-01 | Colorectum | colon adenocarcinoma | Male | >=65 | I/II | Unknown | Unknown | SD | |
| STK38 | SNV | Missense_Mutation | c.562N>A | p.Glu188Lys | p.E188K | Q15208 | protein_coding | tolerated(0.86) | benign(0.01) | TCGA-CK-4950-01 | Colorectum | colon adenocarcinoma | Female | >=65 | III/IV | Chemotherapy | folfox | SD | |
| STK38 | SNV | Missense_Mutation | c.457T>C | p.Phe153Leu | p.F153L | Q15208 | protein_coding | deleterious(0.01) | possibly_damaging(0.803) | TCGA-G4-6628-01 | Colorectum | colon adenocarcinoma | Male | >=65 | I/II | Unknown | Unknown | SD |
| Page: 1 2 3 4 5 |
Top |
Related drugs of malignant transformation related genes |
| Identification of chemicals and drugs interact with genes involved in malignant transfromation |
| (DGIdb 4.0) |
| Entrez ID | Symbol | Category | Interaction Types | Drug Claim Name | Drug Name | PMIDs |
| 11329 | STK38 | SERINE THREONINE KINASE, KINASE, DRUGGABLE GENOME, ENZYME | inhibitor | 249565889 |
| Page: 1 |

Copyright 2023-Present -The University of Texas Health Science Center at Houston |