
|
|||||
|
 | |
| |
| |
| |
| |
| |
|
Gene: STK3 |
Gene summary for STK3 |
| Gene information | Species | Human | Gene symbol | STK3 | Gene ID | 6788 |
| Gene name | serine/threonine kinase 3 | |
| Gene Alias | KRS1 | |
| Cytomap | 8q22.2 | |
| Gene Type | protein-coding | GO ID | GO:0000003 | UniProtAcc | Q13188 |
Top |
Malignant transformation analysis |
| Identification of the aberrant gene expression in precancerous and cancerous lesions by comparing the gene expression of stem-like cells in diseased tissues with normal stem cells |
| Entrez ID | Symbol | Replicates | Species | Organ | Tissue | Adj P-value | Log2FC | Malignancy |
| 6788 | STK3 | CCI_1 | Human | Cervix | CC | 1.50e-30 | 1.68e+00 | 0.528 |
| 6788 | STK3 | CCI_2 | Human | Cervix | CC | 8.46e-24 | 2.36e+00 | 0.5249 |
| 6788 | STK3 | CCI_3 | Human | Cervix | CC | 1.44e-24 | 1.37e+00 | 0.516 |
| 6788 | STK3 | CCII_1 | Human | Cervix | CC | 6.56e-05 | 3.51e-01 | 0.3249 |
| 6788 | STK3 | sample3 | Human | Cervix | CC | 4.75e-02 | 1.66e-01 | 0.1387 |
| 6788 | STK3 | HTA11_3410_2000001011 | Human | Colorectum | AD | 1.42e-20 | -5.94e-01 | 0.0155 |
| 6788 | STK3 | HTA11_2487_2000001011 | Human | Colorectum | SER | 2.05e-08 | -5.21e-01 | -0.1808 |
| 6788 | STK3 | HTA11_1938_2000001011 | Human | Colorectum | AD | 3.06e-06 | -3.92e-01 | -0.0811 |
| 6788 | STK3 | HTA11_3361_2000001011 | Human | Colorectum | AD | 2.02e-10 | -5.71e-01 | -0.1207 |
| 6788 | STK3 | HTA11_83_2000001011 | Human | Colorectum | SER | 7.47e-07 | -6.17e-01 | -0.1526 |
| 6788 | STK3 | HTA11_696_2000001011 | Human | Colorectum | AD | 5.99e-13 | -4.40e-01 | -0.1464 |
| 6788 | STK3 | HTA11_866_2000001011 | Human | Colorectum | AD | 1.02e-07 | -3.95e-01 | -0.1001 |
| 6788 | STK3 | HTA11_2992_2000001011 | Human | Colorectum | SER | 1.44e-02 | -6.37e-01 | -0.1706 |
| 6788 | STK3 | HTA11_5212_2000001011 | Human | Colorectum | AD | 1.52e-05 | -6.85e-01 | -0.2061 |
| 6788 | STK3 | HTA11_7862_2000001011 | Human | Colorectum | AD | 3.68e-06 | -5.62e-01 | -0.0179 |
| 6788 | STK3 | HTA11_866_3004761011 | Human | Colorectum | AD | 1.62e-09 | -5.05e-01 | 0.096 |
| 6788 | STK3 | HTA11_4255_2000001011 | Human | Colorectum | SER | 1.97e-02 | -5.11e-01 | 0.0446 |
| 6788 | STK3 | HTA11_9408_2000001011 | Human | Colorectum | AD | 1.47e-02 | -7.78e-01 | 0.0451 |
| 6788 | STK3 | HTA11_8622_2000001021 | Human | Colorectum | SER | 6.41e-04 | -6.54e-01 | 0.0528 |
| 6788 | STK3 | HTA11_10711_2000001011 | Human | Colorectum | AD | 6.51e-04 | -4.64e-01 | 0.0338 |
| Page: 1 2 3 4 5 6 7 8 9 10 11 12 13 |
| Tissue | Expression Dynamics | Abbreviation |
| Cervix | 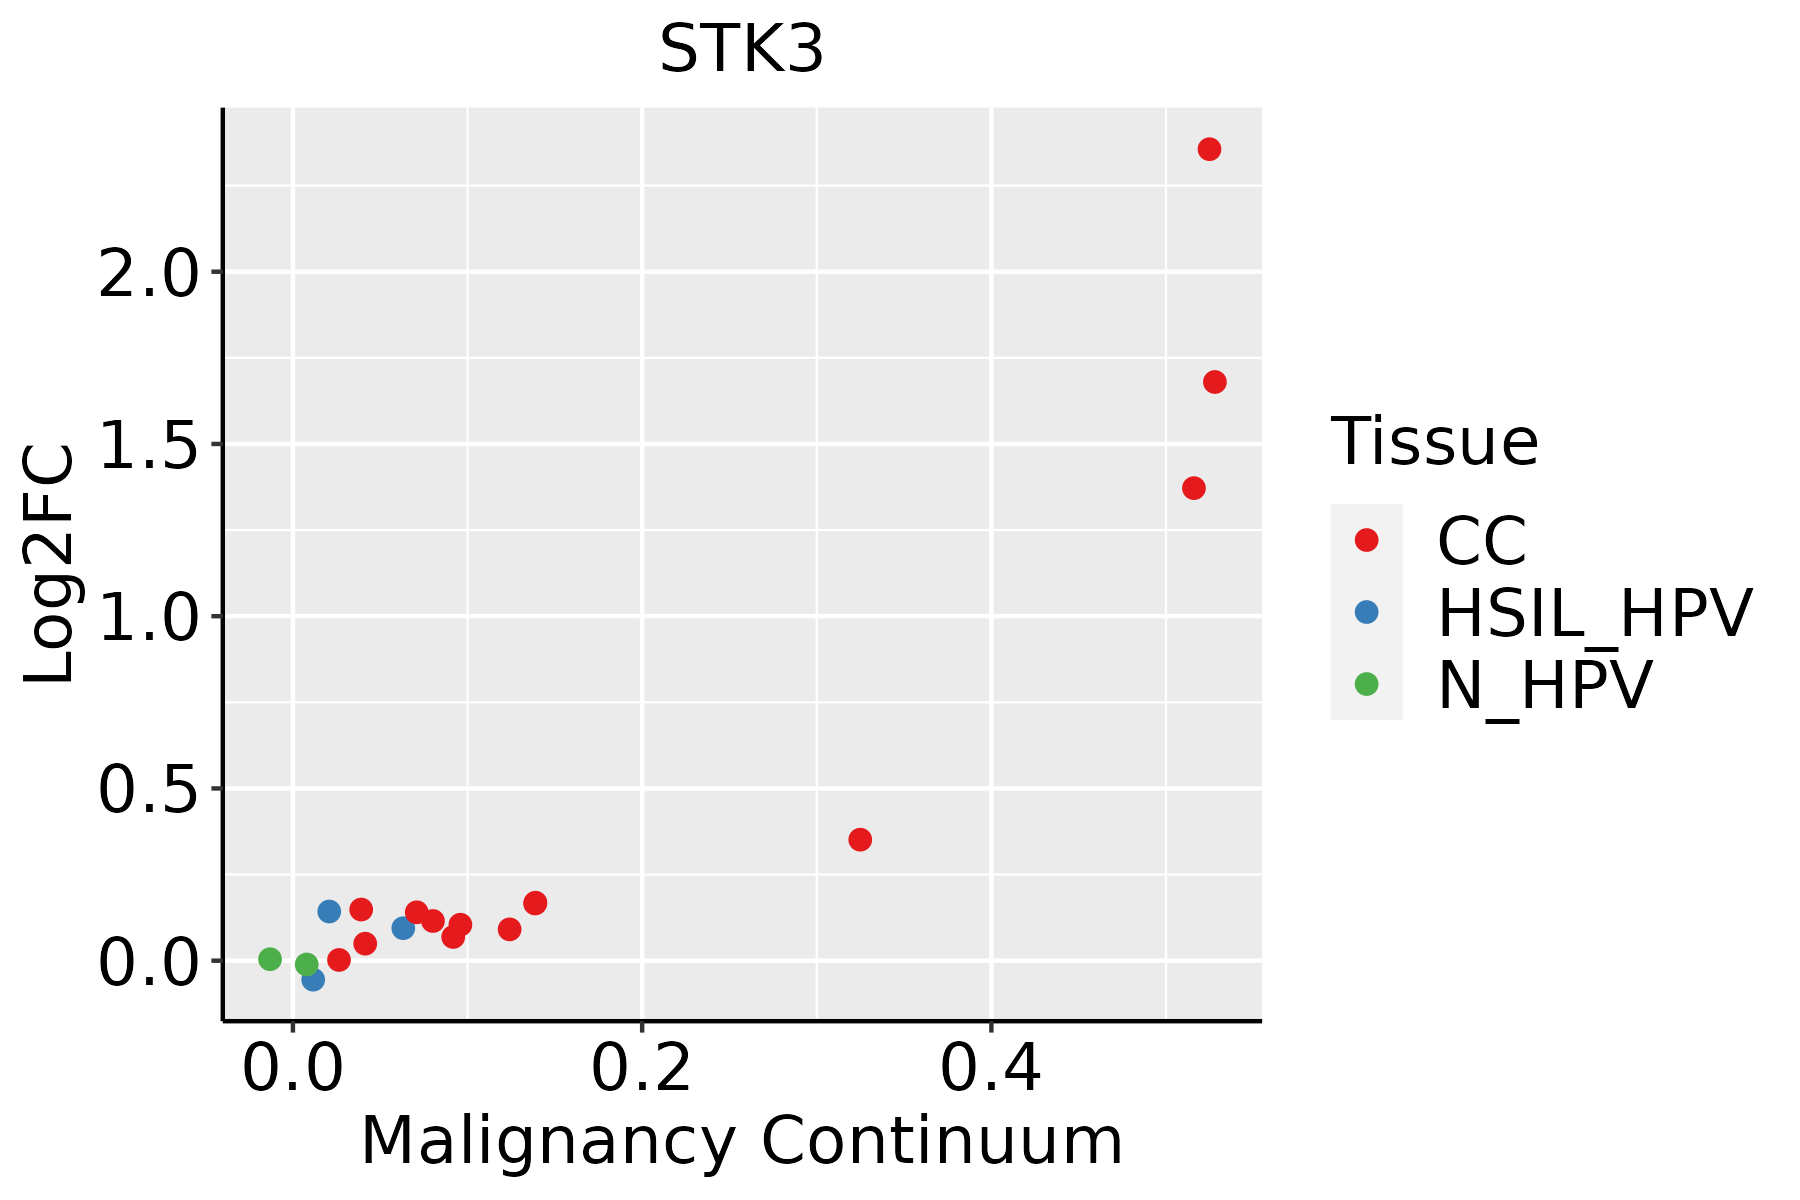 | CC: Cervix cancer |
| HSIL_HPV: HPV-infected high-grade squamous intraepithelial lesions | ||
| N_HPV: HPV-infected normal cervix | ||
| Colorectum (GSE201348) |  | FAP: Familial adenomatous polyposis |
| CRC: Colorectal cancer | ||
| Colorectum (HTA11) |  | AD: Adenomas |
| SER: Sessile serrated lesions | ||
| MSI-H: Microsatellite-high colorectal cancer | ||
| MSS: Microsatellite stable colorectal cancer | ||
| Endometrium | 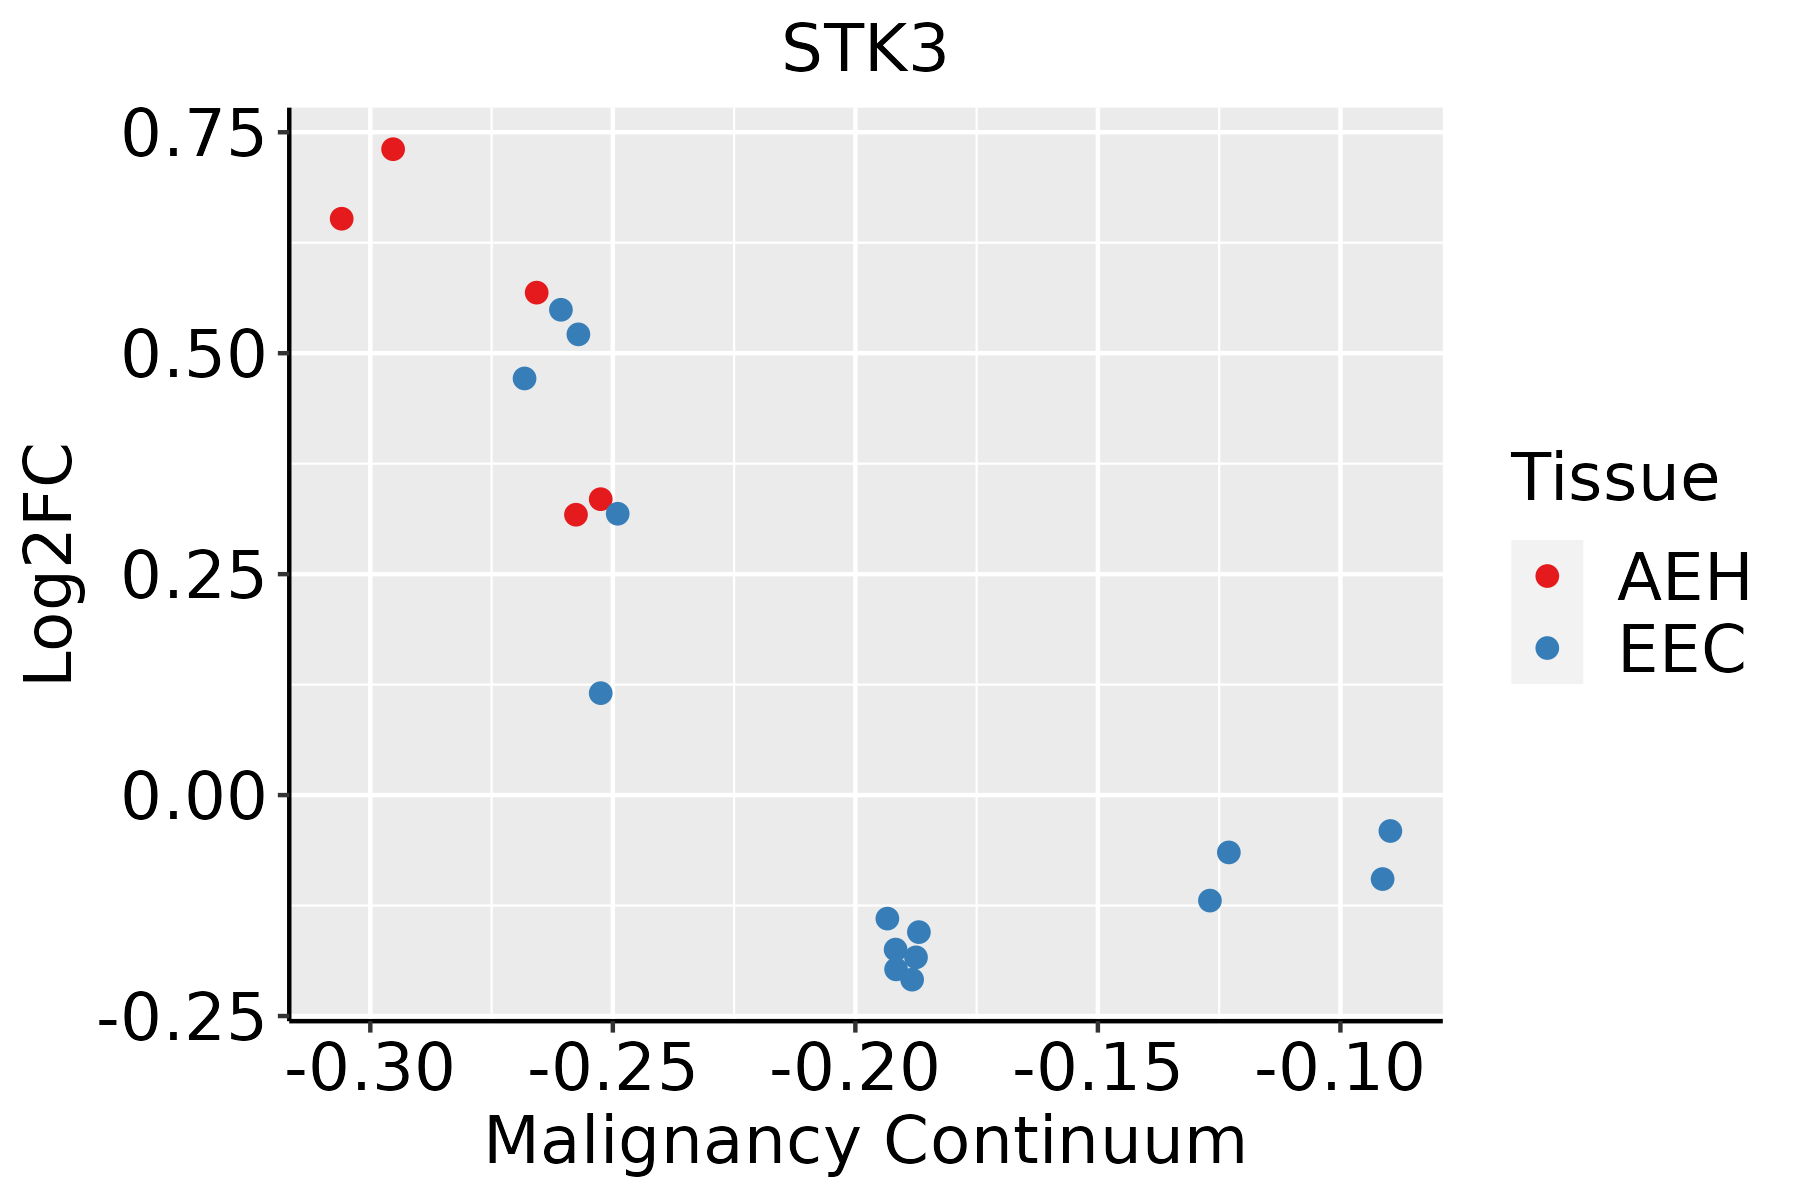 | AEH: Atypical endometrial hyperplasia |
| EEC: Endometrioid Cancer | ||
| Esophagus | 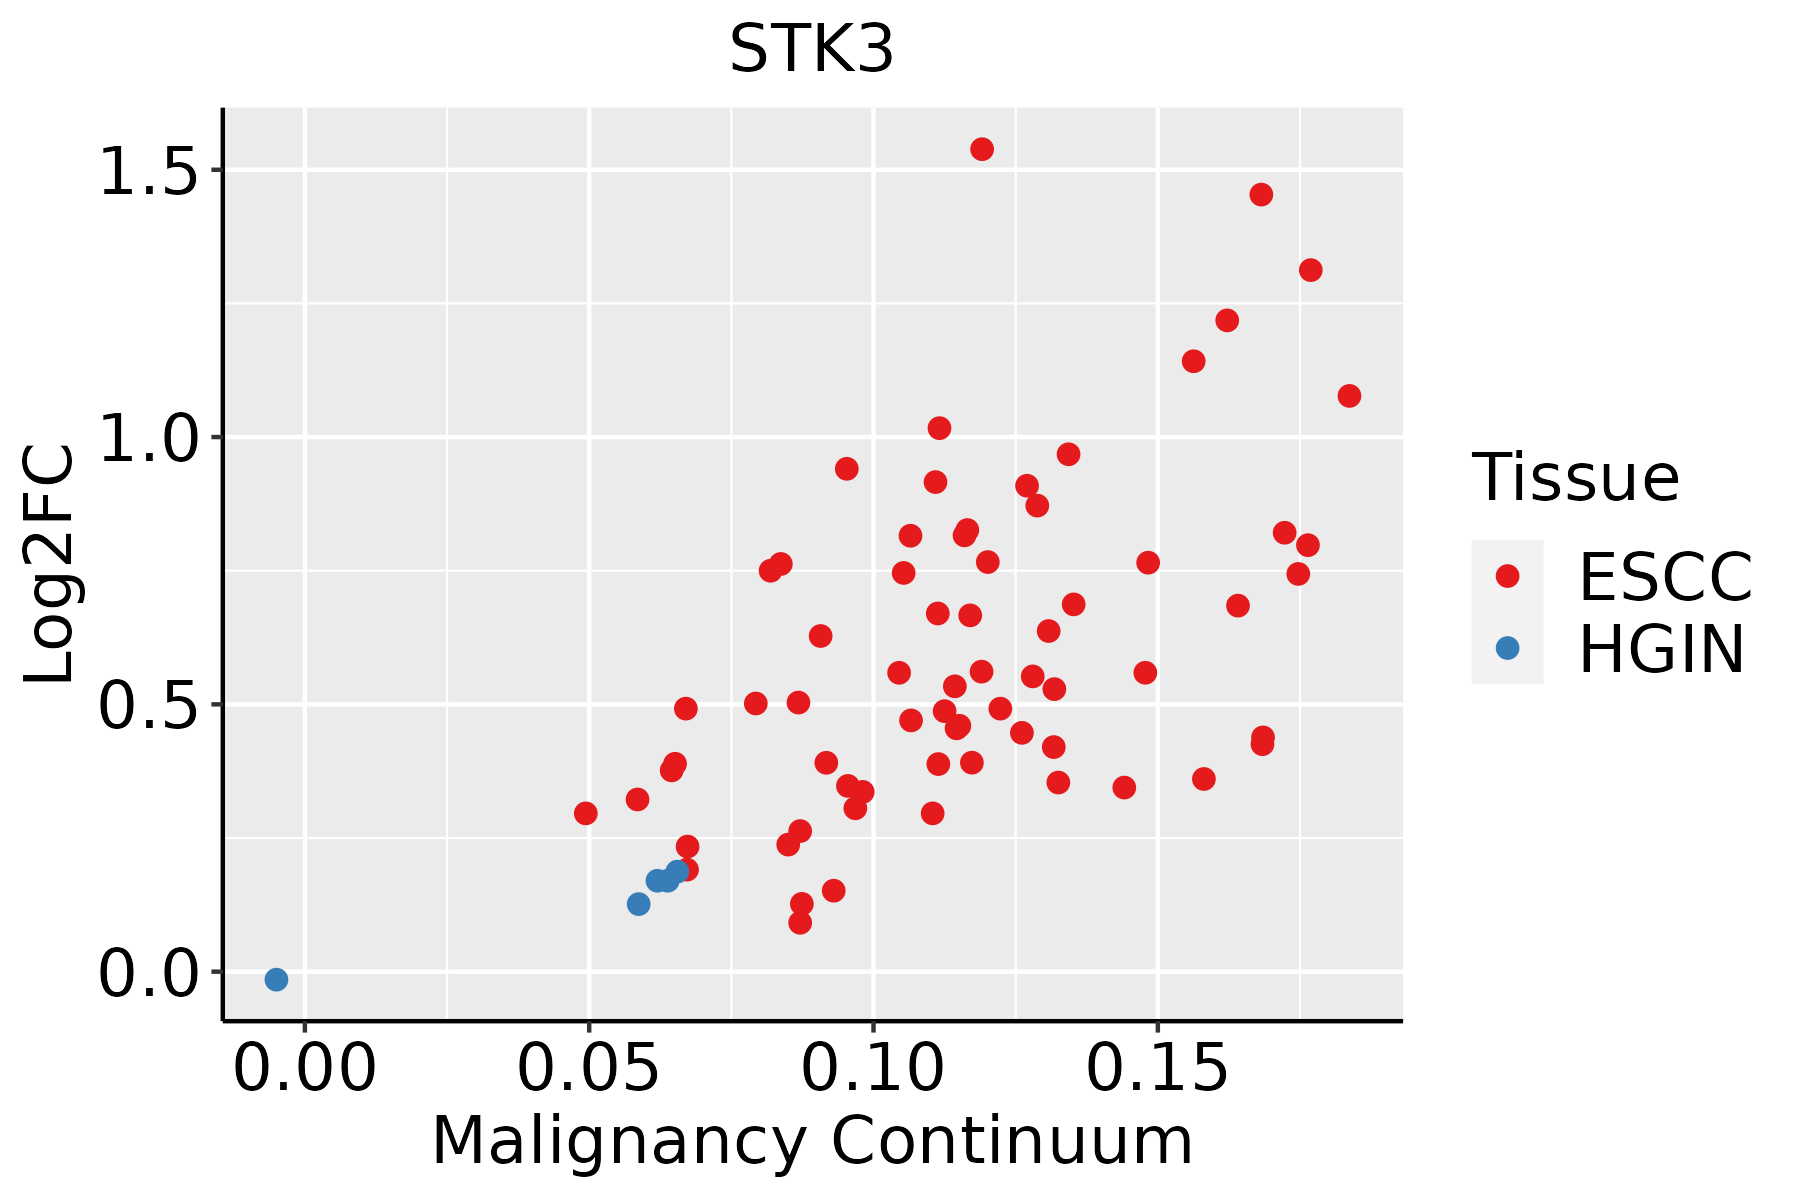 | ESCC: Esophageal squamous cell carcinoma |
| HGIN: High-grade intraepithelial neoplasias | ||
| LGIN: Low-grade intraepithelial neoplasias | ||
| GC | 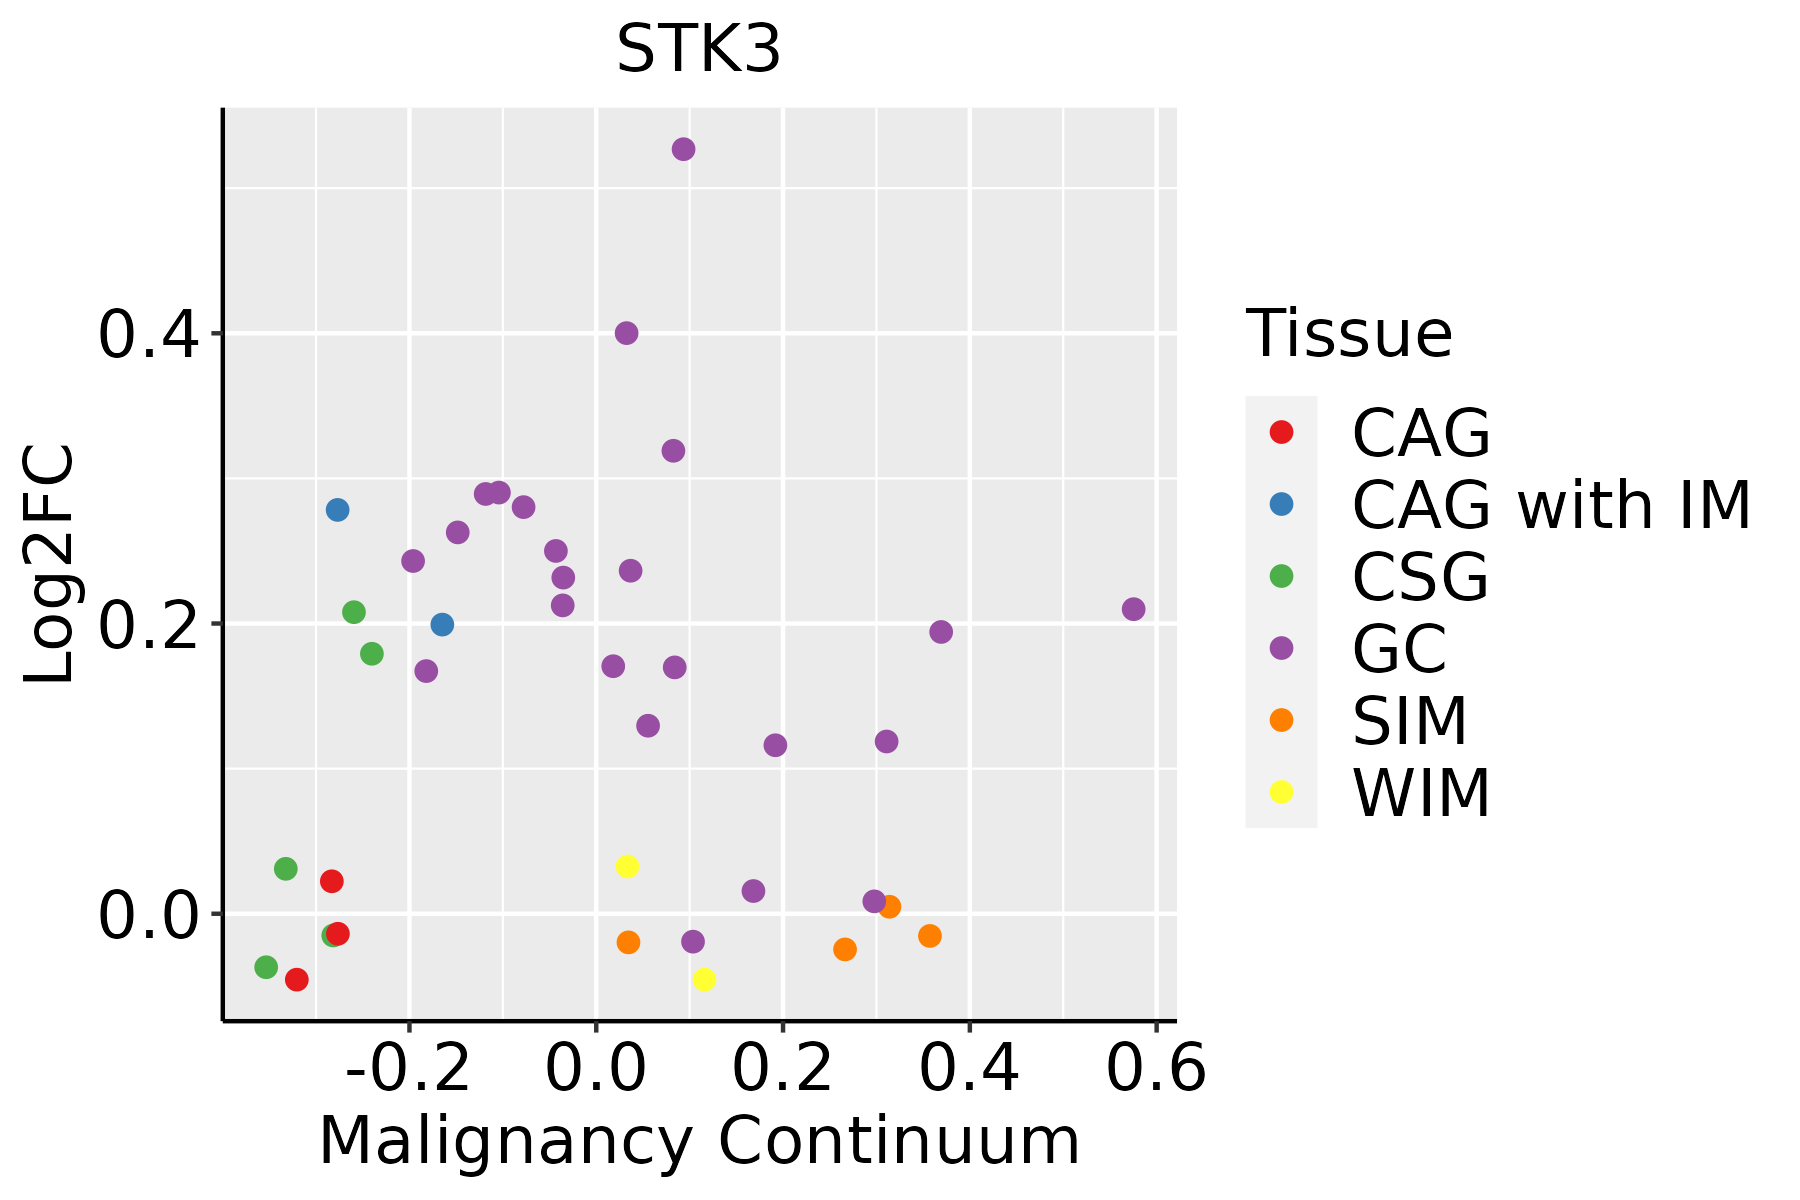 | CAG: Chronic atrophic gastritis |
| CAG with IM: Chronic atrophic gastritis with intestinal metaplasia | ||
| CSG: Chronic superficial gastritis | ||
| GC: Gastric cancer | ||
| SIM: Severe intestinal metaplasia | ||
| WIM: Wild intestinal metaplasia | ||
| Liver | 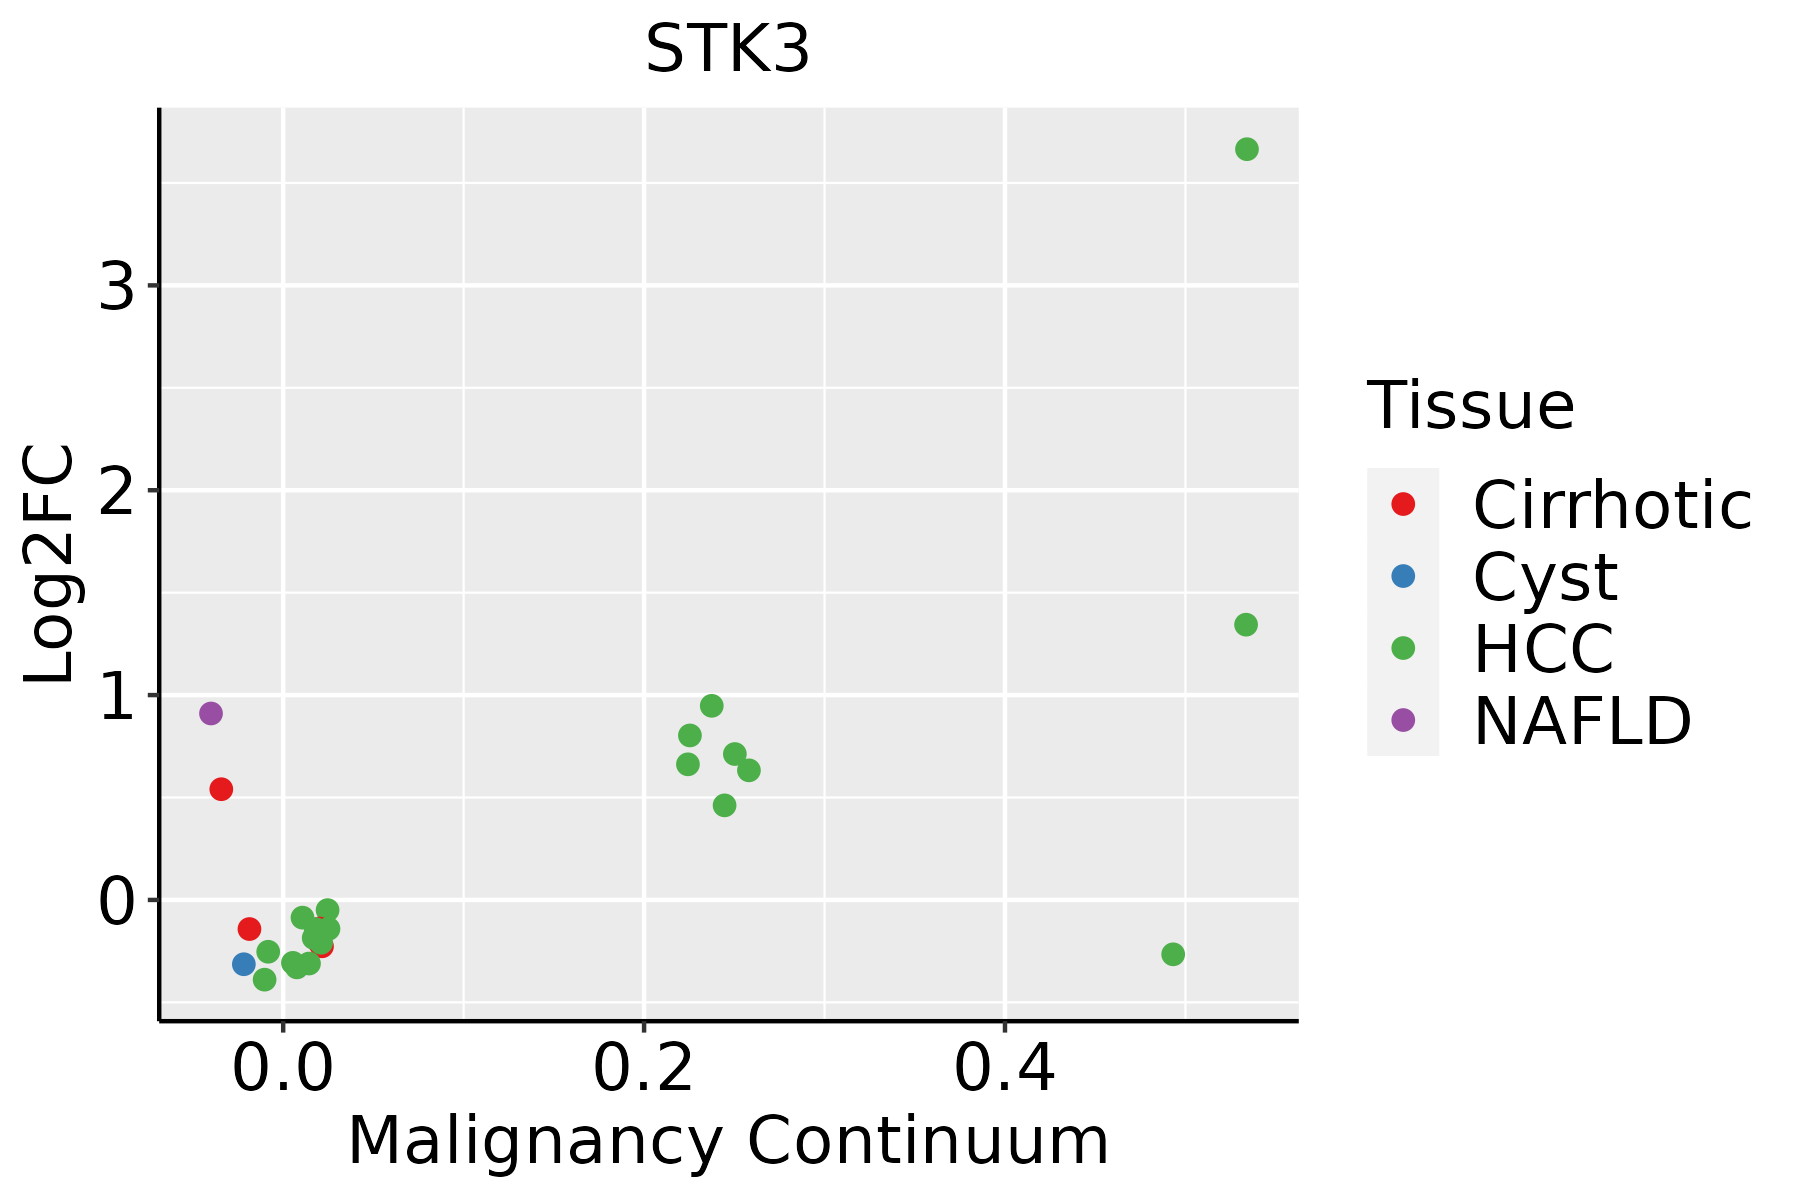 | HCC: Hepatocellular carcinoma |
| NAFLD: Non-alcoholic fatty liver disease | ||
| Lung |  | AAH: Atypical adenomatous hyperplasia |
| AIS: Adenocarcinoma in situ | ||
| IAC: Invasive lung adenocarcinoma | ||
| MIA: Minimally invasive adenocarcinoma | ||
| Oral Cavity | 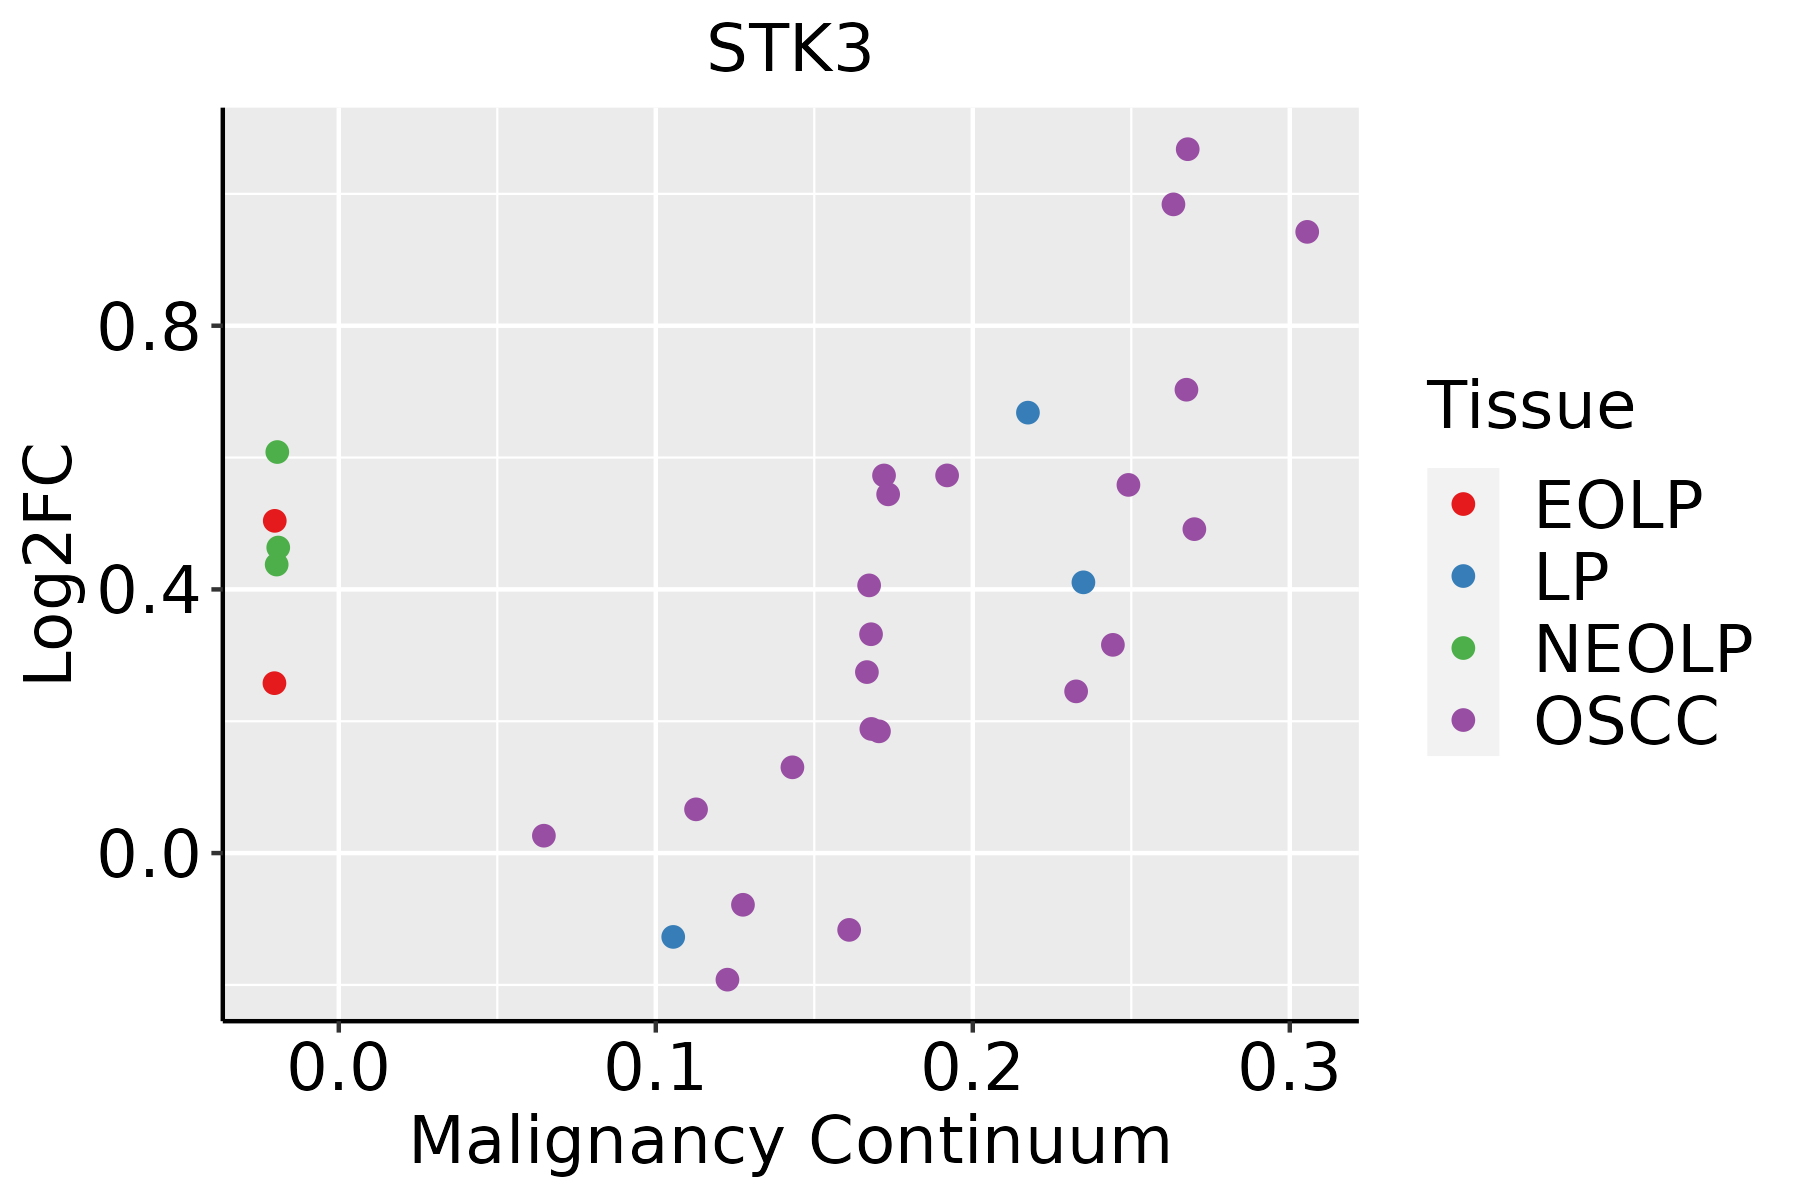 | EOLP: Erosive Oral lichen planus |
| LP: leukoplakia | ||
| NEOLP: Non-erosive oral lichen planus | ||
| OSCC: Oral squamous cell carcinoma | ||
| Prostate | 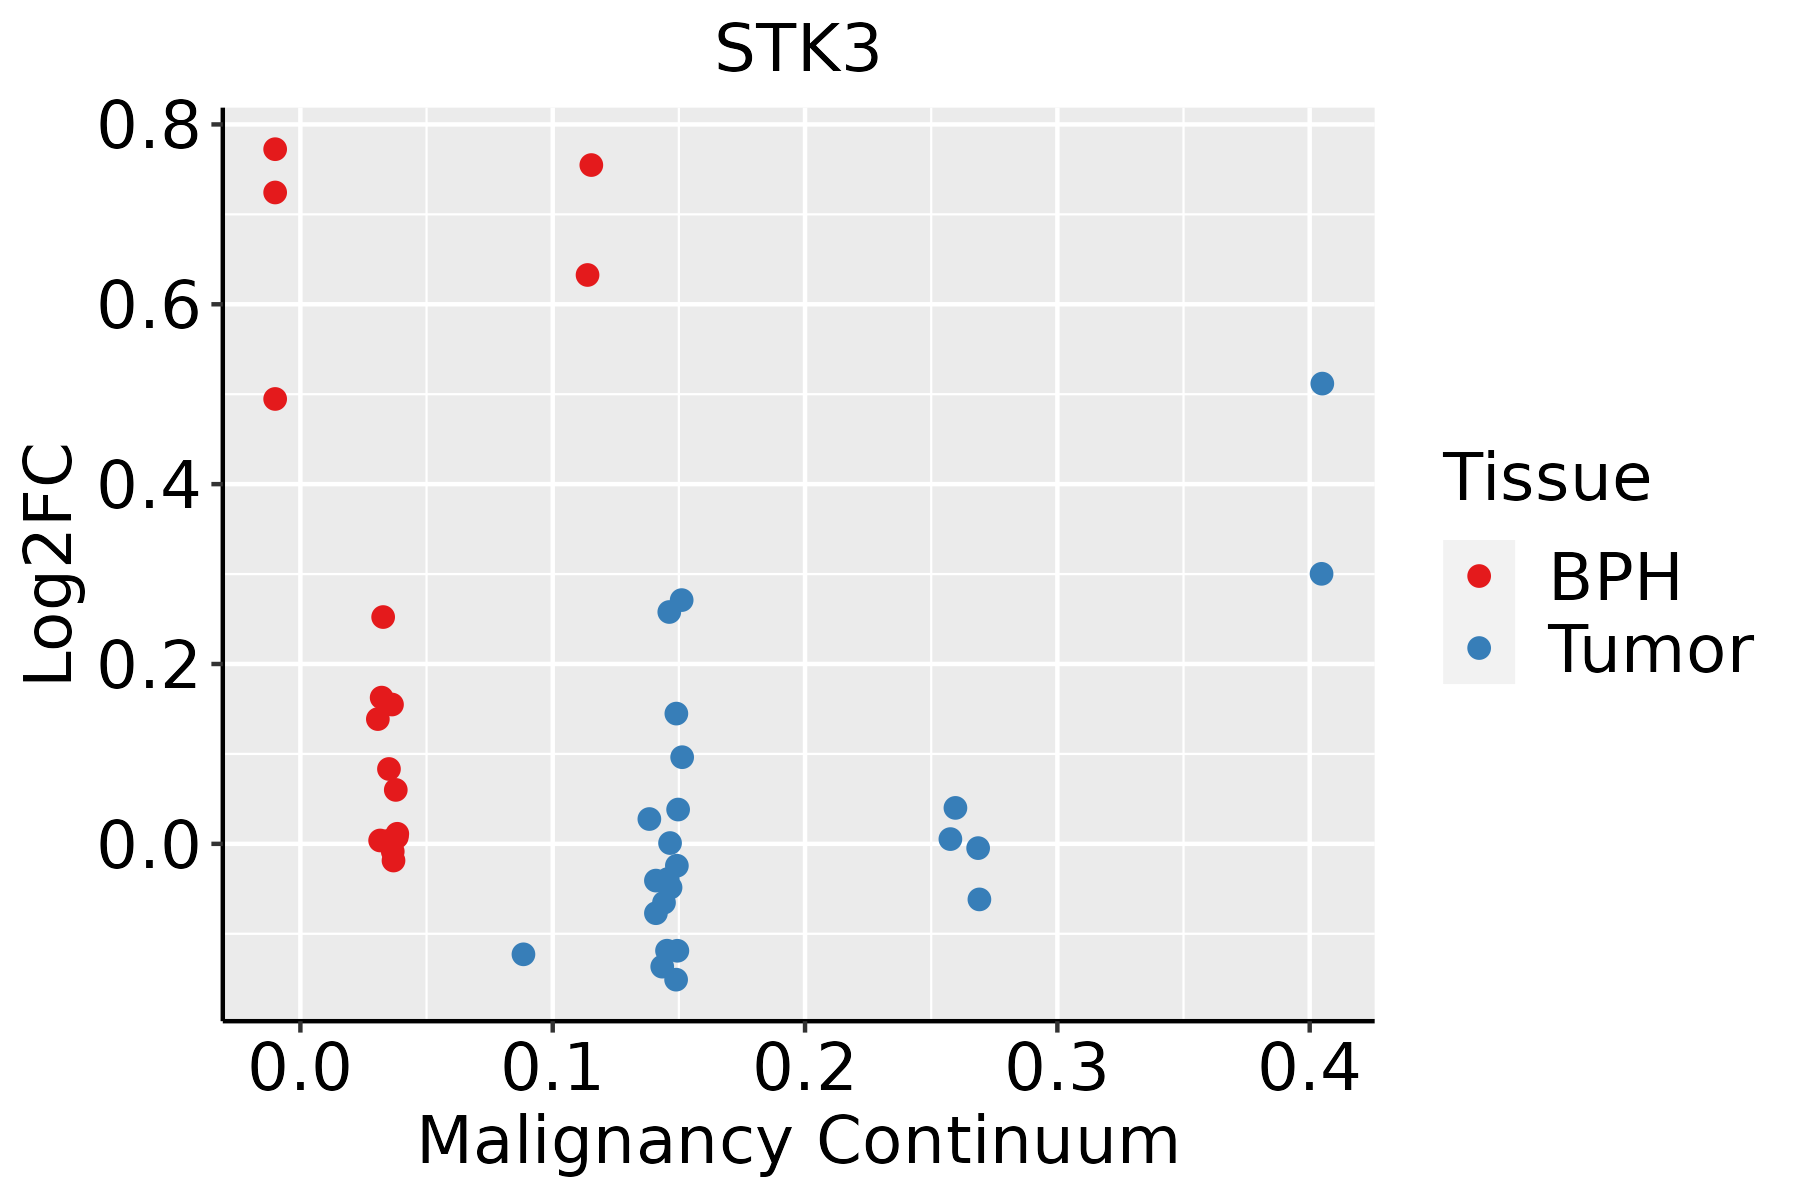 | BPH: Benign Prostatic Hyperplasia |
| Skin | 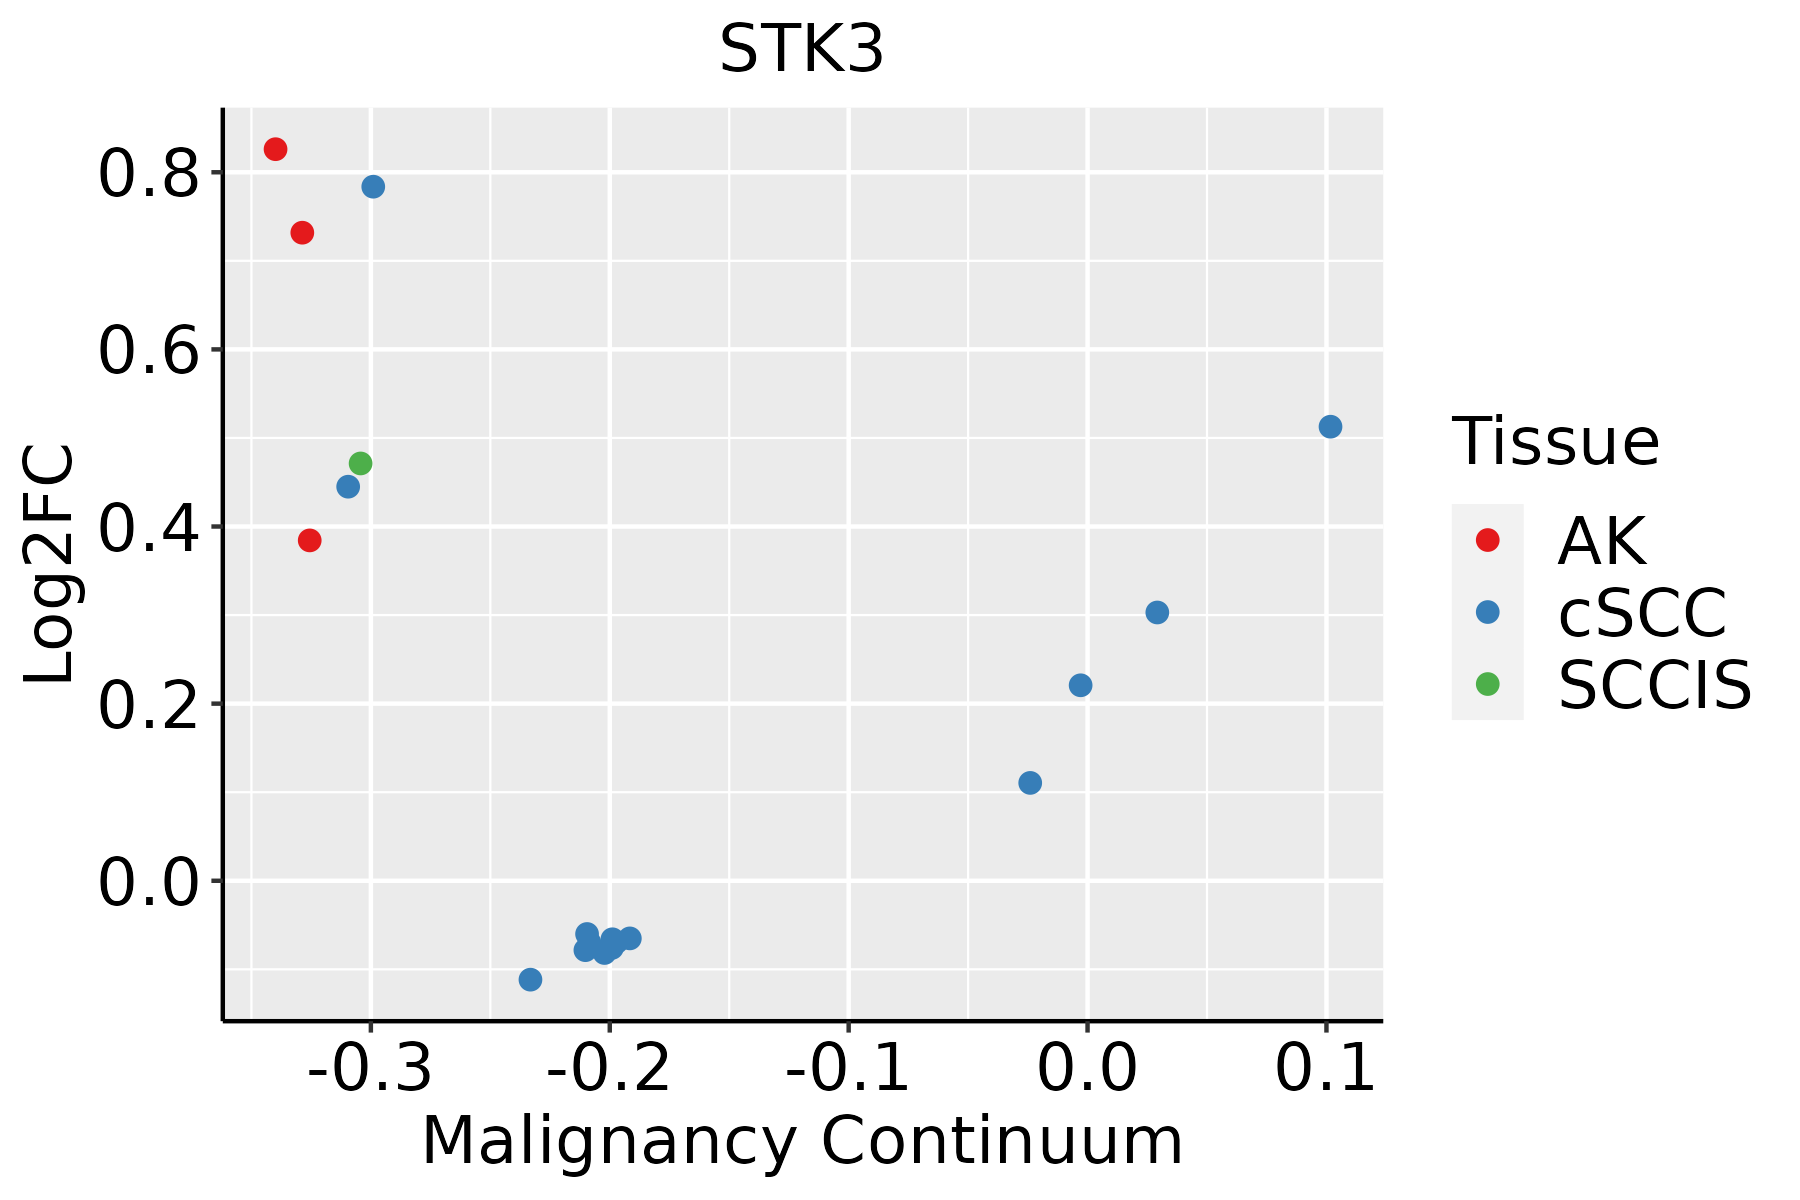 | AK: Actinic keratosis |
| cSCC: Cutaneous squamous cell carcinoma | ||
| SCCIS:squamous cell carcinoma in situ | ||
| Thyroid | 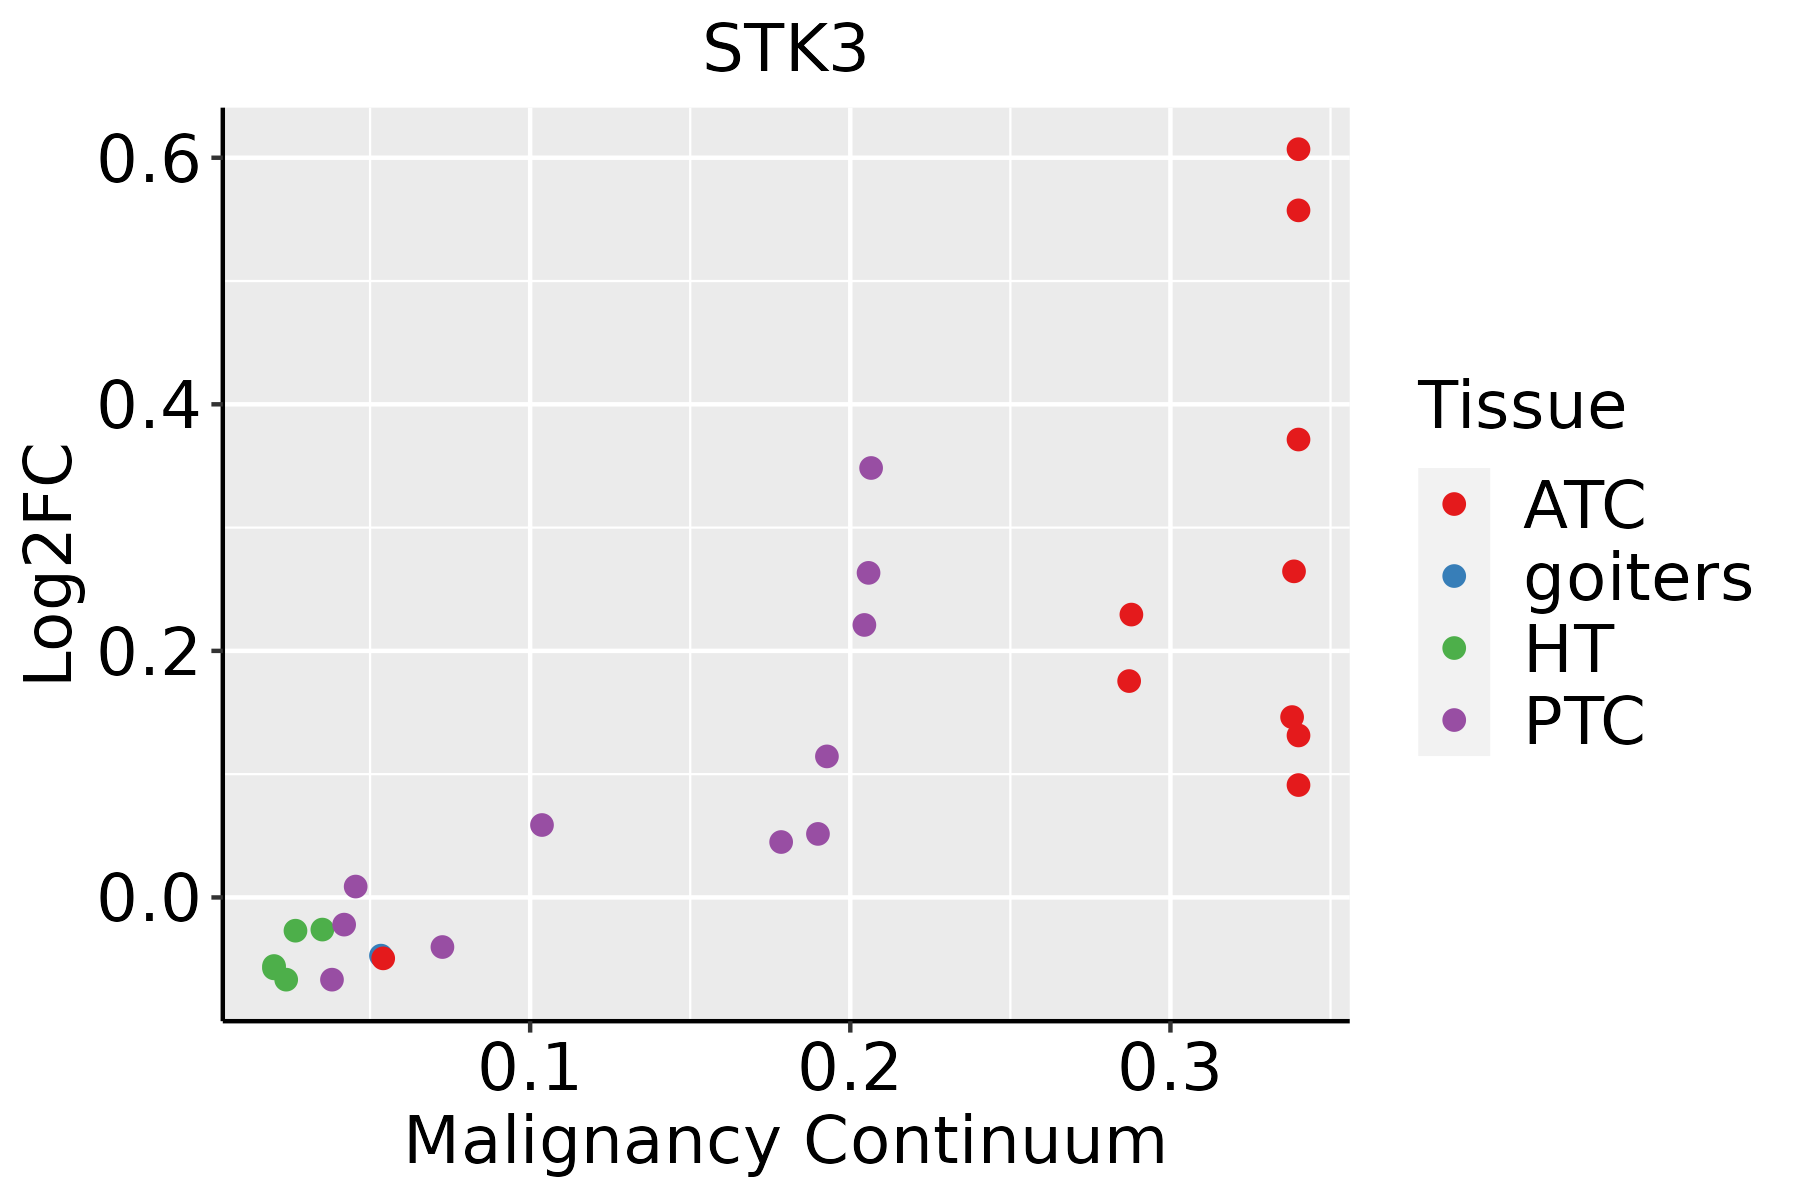 | ATC: Anaplastic thyroid cancer |
| HT: Hashimoto's thyroiditis | ||
| PTC: Papillary thyroid cancer |
| ∗log2FC in expression of this searched gene in stem-like cells from each diseased tissue sample relative to stem-like cells in normal samples in each tissue plotted against the malignancy continuum. Samples are colored based on if they are from different disease stage. |
Top |
Malignant transformation related pathway analysis |
| Find out the enriched GO biological processes and KEGG pathways involved in transition from healthy to precancer to cancer |
| Tissue | Disease Stage | Enriched GO biological Processes |
| Colorectum | AD |  |
| Colorectum | SER |  |
| Colorectum | MSS |  |
| Colorectum | MSI-H |  |
| Colorectum | FAP |  |
| ∗Top 15 enriched GO BP terms are showed in the bar plot of each disease state in each tissue. Each row represents a significant GO biological process which is colored according to the -log10(p.adjust). |
| Page: 1 2 3 4 5 6 7 8 9 |
| GO ID | Tissue | Disease Stage | Description | Gene Ratio | Bg Ratio | pvalue | p.adjust | Count |
| GO:200123310 | Cervix | CC | regulation of apoptotic signaling pathway | 96/2311 | 356/18723 | 4.08e-14 | 3.05e-11 | 96 |
| GO:00160557 | Cervix | CC | Wnt signaling pathway | 98/2311 | 444/18723 | 4.82e-09 | 4.65e-07 | 98 |
| GO:00321035 | Cervix | CC | positive regulation of response to external stimulus | 95/2311 | 427/18723 | 5.44e-09 | 5.03e-07 | 95 |
| GO:01987387 | Cervix | CC | cell-cell signaling by wnt | 98/2311 | 446/18723 | 6.16e-09 | 5.58e-07 | 98 |
| GO:003367410 | Cervix | CC | positive regulation of kinase activity | 101/2311 | 467/18723 | 8.66e-09 | 7.22e-07 | 101 |
| GO:00603267 | Cervix | CC | cell chemotaxis | 73/2311 | 310/18723 | 2.82e-08 | 1.96e-06 | 73 |
| GO:00301117 | Cervix | CC | regulation of Wnt signaling pathway | 76/2311 | 328/18723 | 3.05e-08 | 2.08e-06 | 76 |
| GO:00458608 | Cervix | CC | positive regulation of protein kinase activity | 85/2311 | 386/18723 | 5.61e-08 | 3.29e-06 | 85 |
| GO:006219710 | Cervix | CC | cellular response to chemical stress | 76/2311 | 337/18723 | 1.01e-07 | 5.25e-06 | 76 |
| GO:005109810 | Cervix | CC | regulation of binding | 80/2311 | 363/18723 | 1.32e-07 | 6.42e-06 | 80 |
| GO:00305957 | Cervix | CC | leukocyte chemotaxis | 57/2311 | 230/18723 | 1.48e-07 | 7.07e-06 | 57 |
| GO:20012357 | Cervix | CC | positive regulation of apoptotic signaling pathway | 37/2311 | 126/18723 | 2.70e-07 | 1.12e-05 | 37 |
| GO:00018908 | Cervix | CC | placenta development | 40/2311 | 144/18723 | 4.59e-07 | 1.77e-05 | 40 |
| GO:00310988 | Cervix | CC | stress-activated protein kinase signaling cascade | 58/2311 | 247/18723 | 8.02e-07 | 2.89e-05 | 58 |
| GO:00509007 | Cervix | CC | leukocyte migration | 78/2311 | 369/18723 | 1.09e-06 | 3.80e-05 | 78 |
| GO:00614588 | Cervix | CC | reproductive system development | 87/2311 | 427/18723 | 1.37e-06 | 4.55e-05 | 87 |
| GO:00608287 | Cervix | CC | regulation of canonical Wnt signaling pathway | 58/2311 | 253/18723 | 1.83e-06 | 5.89e-05 | 58 |
| GO:00486088 | Cervix | CC | reproductive structure development | 86/2311 | 424/18723 | 1.90e-06 | 5.97e-05 | 86 |
| GO:009719110 | Cervix | CC | extrinsic apoptotic signaling pathway | 52/2311 | 219/18723 | 2.06e-06 | 6.34e-05 | 52 |
| GO:00600707 | Cervix | CC | canonical Wnt signaling pathway | 66/2311 | 303/18723 | 2.47e-06 | 7.35e-05 | 66 |
| Page: 1 2 3 4 5 6 7 8 9 10 11 12 13 14 15 16 17 18 19 20 21 22 23 24 25 26 27 28 29 30 31 32 33 34 35 36 37 38 39 40 41 42 43 44 45 46 47 48 49 50 51 52 53 54 55 56 57 58 59 60 61 62 63 64 65 66 67 68 69 70 71 72 73 74 75 76 77 78 79 80 81 82 83 84 85 86 87 88 89 |
| Pathway ID | Tissue | Disease Stage | Description | Gene Ratio | Bg Ratio | pvalue | p.adjust | qvalue | Count |
| hsa043908 | Cervix | CC | Hippo signaling pathway | 40/1267 | 157/8465 | 3.64e-04 | 1.82e-03 | 1.07e-03 | 40 |
| hsa040109 | Cervix | CC | MAPK signaling pathway | 62/1267 | 302/8465 | 4.89e-03 | 1.67e-02 | 9.86e-03 | 62 |
| hsa0439013 | Cervix | CC | Hippo signaling pathway | 40/1267 | 157/8465 | 3.64e-04 | 1.82e-03 | 1.07e-03 | 40 |
| hsa0401012 | Cervix | CC | MAPK signaling pathway | 62/1267 | 302/8465 | 4.89e-03 | 1.67e-02 | 9.86e-03 | 62 |
| hsa04390 | Colorectum | MSS | Hippo signaling pathway | 48/1875 | 157/8465 | 8.32e-03 | 3.10e-02 | 1.90e-02 | 48 |
| hsa043901 | Colorectum | MSS | Hippo signaling pathway | 48/1875 | 157/8465 | 8.32e-03 | 3.10e-02 | 1.90e-02 | 48 |
| hsa043902 | Colorectum | FAP | Hippo signaling pathway | 41/1404 | 157/8465 | 1.49e-03 | 7.91e-03 | 4.81e-03 | 41 |
| hsa04010 | Colorectum | FAP | MAPK signaling pathway | 68/1404 | 302/8465 | 4.00e-03 | 1.67e-02 | 1.02e-02 | 68 |
| hsa043903 | Colorectum | FAP | Hippo signaling pathway | 41/1404 | 157/8465 | 1.49e-03 | 7.91e-03 | 4.81e-03 | 41 |
| hsa040101 | Colorectum | FAP | MAPK signaling pathway | 68/1404 | 302/8465 | 4.00e-03 | 1.67e-02 | 1.02e-02 | 68 |
| hsa040102 | Colorectum | CRC | MAPK signaling pathway | 56/1091 | 302/8465 | 2.76e-03 | 1.77e-02 | 1.20e-02 | 56 |
| hsa043904 | Colorectum | CRC | Hippo signaling pathway | 32/1091 | 157/8465 | 5.17e-03 | 2.72e-02 | 1.84e-02 | 32 |
| hsa040103 | Colorectum | CRC | MAPK signaling pathway | 56/1091 | 302/8465 | 2.76e-03 | 1.77e-02 | 1.20e-02 | 56 |
| hsa043905 | Colorectum | CRC | Hippo signaling pathway | 32/1091 | 157/8465 | 5.17e-03 | 2.72e-02 | 1.84e-02 | 32 |
| hsa043909 | Endometrium | AEH | Hippo signaling pathway | 38/1197 | 157/8465 | 4.79e-04 | 3.38e-03 | 2.47e-03 | 38 |
| hsa0439014 | Endometrium | AEH | Hippo signaling pathway | 38/1197 | 157/8465 | 4.79e-04 | 3.38e-03 | 2.47e-03 | 38 |
| hsa0439023 | Endometrium | EEC | Hippo signaling pathway | 39/1237 | 157/8465 | 4.54e-04 | 3.47e-03 | 2.59e-03 | 39 |
| hsa0439033 | Endometrium | EEC | Hippo signaling pathway | 39/1237 | 157/8465 | 4.54e-04 | 3.47e-03 | 2.59e-03 | 39 |
| hsa0439018 | Esophagus | ESCC | Hippo signaling pathway | 92/4205 | 157/8465 | 1.46e-02 | 3.31e-02 | 1.69e-02 | 92 |
| hsa0439019 | Esophagus | ESCC | Hippo signaling pathway | 92/4205 | 157/8465 | 1.46e-02 | 3.31e-02 | 1.69e-02 | 92 |
| Page: 1 2 3 |
Top |
Cell-cell communication analysis |
| Identification of potential cell-cell interactions between two cell types and their ligand-receptor pairs for different disease states |
| Ligand | Receptor | LRpair | Pathway | Tissue | Disease Stage |
| Page: 1 |
Top |
Single-cell gene regulatory network inference analysis |
| Find out the significant the regulons (TFs) and the target genes of each regulon across cell types for different disease states |
| TF | Cell Type | Tissue | Disease Stage | Target Gene | RSS | Regulon Activity |
| ∗The dot plots of a searched regulon are shown for all cell subpopulations in each disease state of each tissue based on the regulon specific score inferred using pySCENIC and by calculating the average expression. |
| Page: 1 |
Top |
Somatic mutation of malignant transformation related genes |
| Annotation of somatic variants for genes involved in malignant transformation |
| Hugo Symbol | Variant Class | Variant Classification | dbSNP RS | HGVSc | HGVSp | HGVSp Short | SWISSPROT | BIOTYPE | SIFT | PolyPhen | Tumor Sample Barcode | Tissue | Histology | Sex | Age | Stage | Therapy Types | Drugs | Outcome |
| STK3 | SNV | Missense_Mutation | c.533N>T | p.Gly178Val | p.G178V | Q13188 | protein_coding | deleterious(0) | probably_damaging(1) | TCGA-AN-A041-01 | Breast | breast invasive carcinoma | Female | <65 | I/II | Unknown | Unknown | SD | |
| STK3 | SNV | Missense_Mutation | rs545643657 | c.1306N>A | p.Glu436Lys | p.E436K | Q13188 | protein_coding | tolerated(0.62) | benign(0.007) | TCGA-AN-A046-01 | Breast | breast invasive carcinoma | Female | >=65 | I/II | Unknown | Unknown | SD |
| STK3 | SNV | Missense_Mutation | novel | c.1419N>T | p.Leu473Phe | p.L473F | Q13188 | protein_coding | tolerated(0.63) | benign(0.013) | TCGA-AO-A128-01 | Breast | breast invasive carcinoma | Female | <65 | I/II | Chemotherapy | doxorubicin | SD |
| STK3 | insertion | Nonsense_Mutation | novel | c.775_776insAGAAATCAG | p.Phe259delinsTer | p.F259delins* | Q13188 | protein_coding | TCGA-A7-A26I-01 | Breast | breast invasive carcinoma | Female | >=65 | I/II | Chemotherapy | cytoxan | SD | ||
| STK3 | insertion | Frame_Shift_Ins | novel | c.1417_1418insCC | p.Leu473SerfsTer2 | p.L473Sfs*2 | Q13188 | protein_coding | TCGA-AO-A128-01 | Breast | breast invasive carcinoma | Female | <65 | I/II | Chemotherapy | doxorubicin | SD | ||
| STK3 | insertion | Frame_Shift_Ins | novel | c.719_720insCCTCAGACCAAAGAAG | p.Glu241LeufsTer9 | p.E241Lfs*9 | Q13188 | protein_coding | TCGA-AR-A0U0-01 | Breast | breast invasive carcinoma | Female | >=65 | I/II | Unknown | Unknown | SD | ||
| STK3 | SNV | Missense_Mutation | c.244N>A | p.Ala82Thr | p.A82T | Q13188 | protein_coding | deleterious(0.02) | probably_damaging(0.981) | TCGA-2W-A8YY-01 | Cervix | cervical & endocervical cancer | Female | <65 | I/II | Chemotherapy | cisplatin | CR | |
| STK3 | SNV | Missense_Mutation | novel | c.541N>T | p.Leu181Phe | p.L181F | Q13188 | protein_coding | deleterious(0.01) | probably_damaging(0.999) | TCGA-EA-A3Y4-01 | Cervix | cervical & endocervical cancer | Female | <65 | I/II | Unknown | Unknown | SD |
| STK3 | SNV | Missense_Mutation | c.721N>C | p.Glu241Gln | p.E241Q | Q13188 | protein_coding | deleterious(0.04) | probably_damaging(0.987) | TCGA-LP-A4AV-01 | Cervix | cervical & endocervical cancer | Female | <65 | I/II | Unknown | Unknown | SD | |
| STK3 | SNV | Missense_Mutation | c.425N>A | p.Arg142Gln | p.R142Q | Q13188 | protein_coding | tolerated(0.06) | possibly_damaging(0.723) | TCGA-AA-3510-01 | Colorectum | colon adenocarcinoma | Male | >=65 | I/II | Unknown | Unknown | SD |
| Page: 1 2 3 4 5 6 7 8 |
Top |
Related drugs of malignant transformation related genes |
| Identification of chemicals and drugs interact with genes involved in malignant transfromation |
| (DGIdb 4.0) |
| Entrez ID | Symbol | Category | Interaction Types | Drug Claim Name | Drug Name | PMIDs |
| 6788 | STK3 | DRUGGABLE GENOME, KINASE, SERINE THREONINE KINASE, ENZYME | SOTRASTAURIN | SOTRASTAURIN | ||
| 6788 | STK3 | DRUGGABLE GENOME, KINASE, SERINE THREONINE KINASE, ENZYME | ALSTERPAULLONE | ALSTERPAULLONE | ||
| 6788 | STK3 | DRUGGABLE GENOME, KINASE, SERINE THREONINE KINASE, ENZYME | SP-600125 | SP-600125 | 23634759 | |
| 6788 | STK3 | DRUGGABLE GENOME, KINASE, SERINE THREONINE KINASE, ENZYME | inhibitor | 249565869 | CEP-11981 | |
| 6788 | STK3 | DRUGGABLE GENOME, KINASE, SERINE THREONINE KINASE, ENZYME | BAY-613606 | CHEMBL541400 | ||
| 6788 | STK3 | DRUGGABLE GENOME, KINASE, SERINE THREONINE KINASE, ENZYME | TAE-684 | TAE-684 | ||
| 6788 | STK3 | DRUGGABLE GENOME, KINASE, SERINE THREONINE KINASE, ENZYME | LAUROGUADINE | LAUROGUADINE | ||
| 6788 | STK3 | DRUGGABLE GENOME, KINASE, SERINE THREONINE KINASE, ENZYME | PF-562271 | PF-00562271 | ||
| 6788 | STK3 | DRUGGABLE GENOME, KINASE, SERINE THREONINE KINASE, ENZYME | GW441756X | GW441756X | ||
| 6788 | STK3 | DRUGGABLE GENOME, KINASE, SERINE THREONINE KINASE, ENZYME | ILORASERTIB | ILORASERTIB |
| Page: 1 2 3 |

Copyright 2023-Present -The University of Texas Health Science Center at Houston |