
|
|||||
|
 | |
| |
| |
| |
| |
| |
|
Gene: STK25 |
Gene summary for STK25 |
| Gene information | Species | Human | Gene symbol | STK25 | Gene ID | 10494 |
| Gene name | serine/threonine kinase 25 | |
| Gene Alias | SOK1 | |
| Cytomap | 2q37.3 | |
| Gene Type | protein-coding | GO ID | GO:0000165 | UniProtAcc | A0A024R4B2 |
Top |
Malignant transformation analysis |
| Identification of the aberrant gene expression in precancerous and cancerous lesions by comparing the gene expression of stem-like cells in diseased tissues with normal stem cells |
| Entrez ID | Symbol | Replicates | Species | Organ | Tissue | Adj P-value | Log2FC | Malignancy |
| 10494 | STK25 | LZE4T | Human | Esophagus | ESCC | 9.43e-07 | 7.32e-02 | 0.0811 |
| 10494 | STK25 | LZE5T | Human | Esophagus | ESCC | 9.92e-05 | 2.36e-01 | 0.0514 |
| 10494 | STK25 | LZE7T | Human | Esophagus | ESCC | 1.86e-04 | 2.35e-01 | 0.0667 |
| 10494 | STK25 | LZE8T | Human | Esophagus | ESCC | 3.44e-02 | 1.12e-01 | 0.067 |
| 10494 | STK25 | LZE20T | Human | Esophagus | ESCC | 1.08e-09 | 3.37e-01 | 0.0662 |
| 10494 | STK25 | LZE21D1 | Human | Esophagus | HGIN | 6.62e-03 | 1.64e-01 | 0.0632 |
| 10494 | STK25 | LZE22D1 | Human | Esophagus | HGIN | 1.91e-04 | 1.20e-01 | 0.0595 |
| 10494 | STK25 | LZE24T | Human | Esophagus | ESCC | 2.83e-22 | 6.14e-01 | 0.0596 |
| 10494 | STK25 | LZE21T | Human | Esophagus | ESCC | 3.86e-06 | 3.50e-01 | 0.0655 |
| 10494 | STK25 | LZE6T | Human | Esophagus | ESCC | 5.70e-04 | 2.41e-01 | 0.0845 |
| 10494 | STK25 | P1T-E | Human | Esophagus | ESCC | 9.04e-18 | 5.15e-01 | 0.0875 |
| 10494 | STK25 | P2T-E | Human | Esophagus | ESCC | 1.55e-31 | 6.03e-01 | 0.1177 |
| 10494 | STK25 | P4T-E | Human | Esophagus | ESCC | 5.22e-22 | 3.82e-01 | 0.1323 |
| 10494 | STK25 | P5T-E | Human | Esophagus | ESCC | 1.61e-27 | 4.92e-01 | 0.1327 |
| 10494 | STK25 | P8T-E | Human | Esophagus | ESCC | 6.40e-26 | 5.99e-01 | 0.0889 |
| 10494 | STK25 | P9T-E | Human | Esophagus | ESCC | 6.02e-27 | 3.74e-01 | 0.1131 |
| 10494 | STK25 | P10T-E | Human | Esophagus | ESCC | 7.25e-51 | 9.02e-01 | 0.116 |
| 10494 | STK25 | P11T-E | Human | Esophagus | ESCC | 2.00e-22 | 7.37e-01 | 0.1426 |
| 10494 | STK25 | P12T-E | Human | Esophagus | ESCC | 4.57e-33 | 7.32e-01 | 0.1122 |
| 10494 | STK25 | P15T-E | Human | Esophagus | ESCC | 6.09e-49 | 1.03e+00 | 0.1149 |
| Page: 1 2 3 4 5 6 |
| Tissue | Expression Dynamics | Abbreviation |
| Esophagus |  | ESCC: Esophageal squamous cell carcinoma |
| HGIN: High-grade intraepithelial neoplasias | ||
| LGIN: Low-grade intraepithelial neoplasias | ||
| Liver | 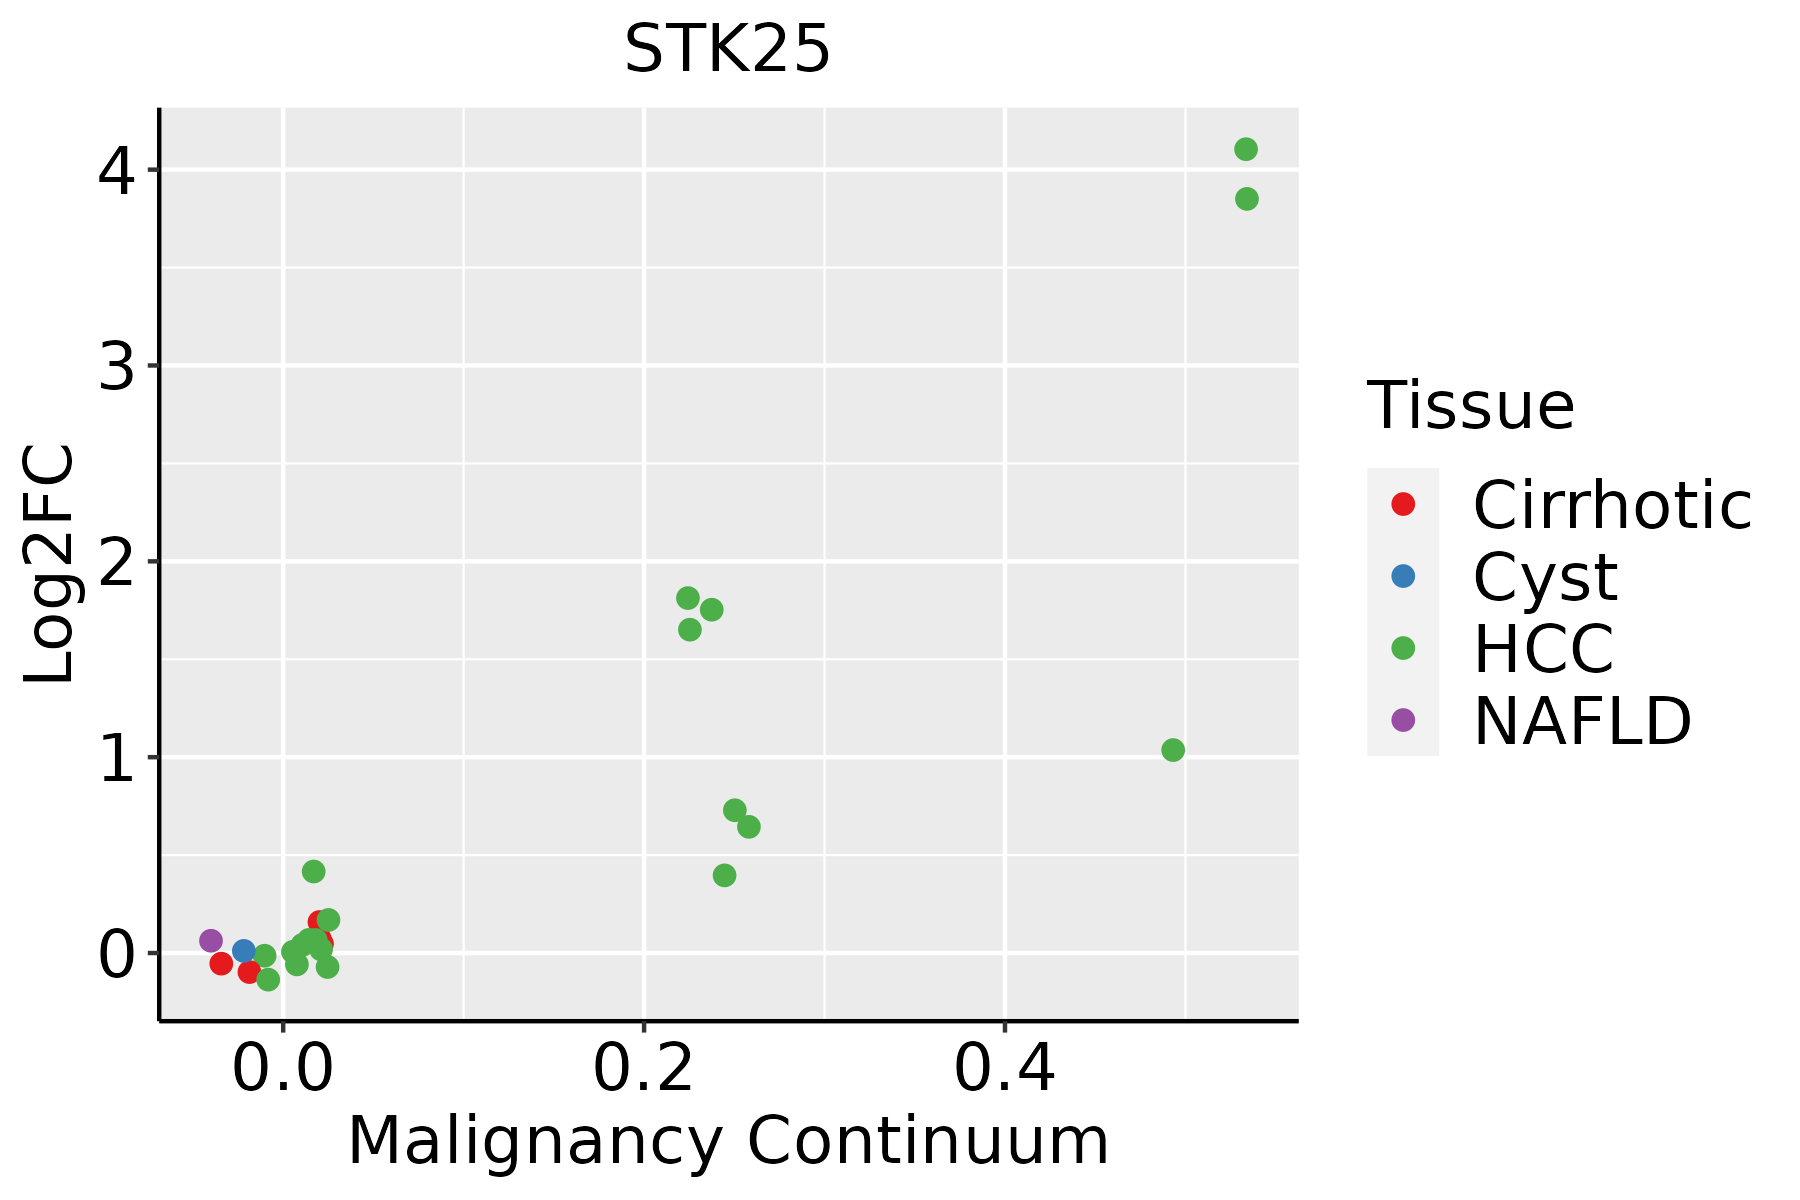 | HCC: Hepatocellular carcinoma |
| NAFLD: Non-alcoholic fatty liver disease | ||
| Oral Cavity | 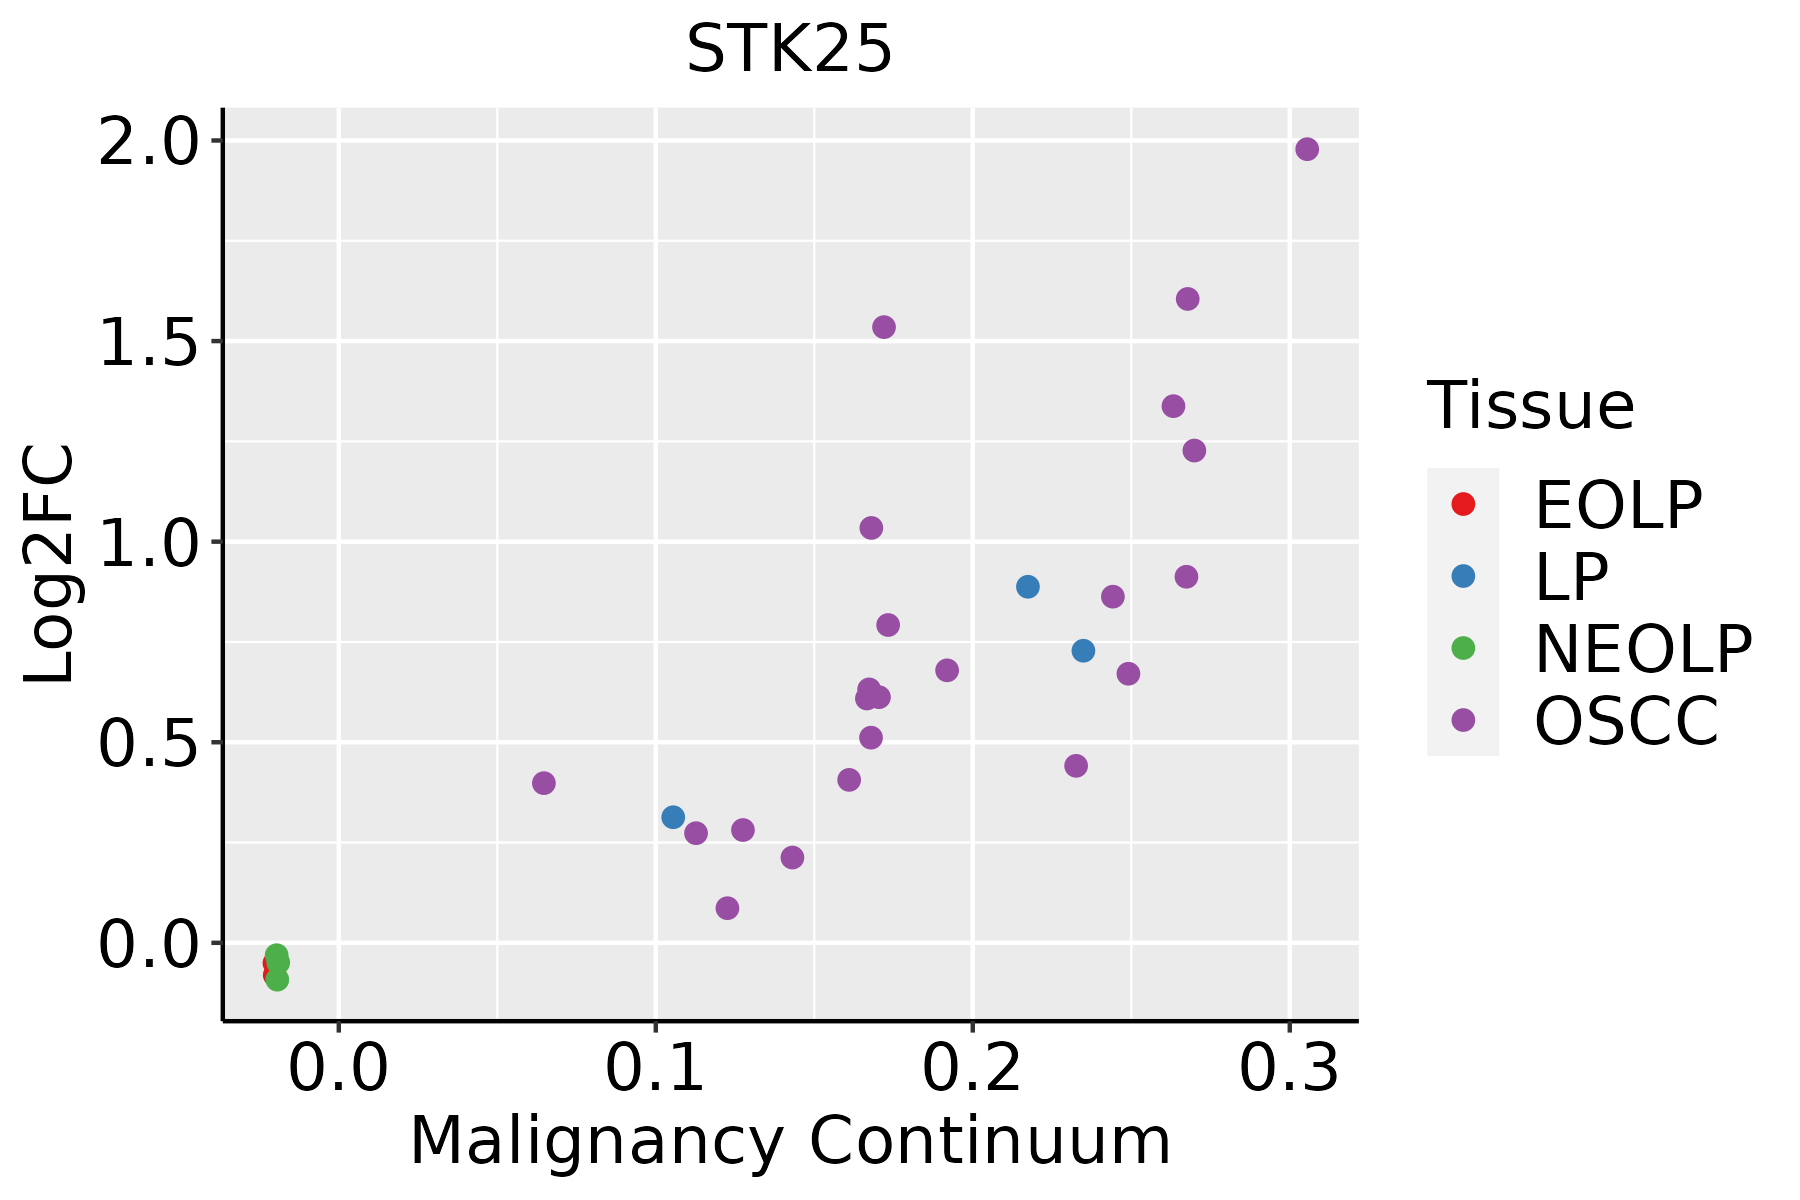 | EOLP: Erosive Oral lichen planus |
| LP: leukoplakia | ||
| NEOLP: Non-erosive oral lichen planus | ||
| OSCC: Oral squamous cell carcinoma | ||
| Skin |  | AK: Actinic keratosis |
| cSCC: Cutaneous squamous cell carcinoma | ||
| SCCIS:squamous cell carcinoma in situ | ||
| Thyroid | 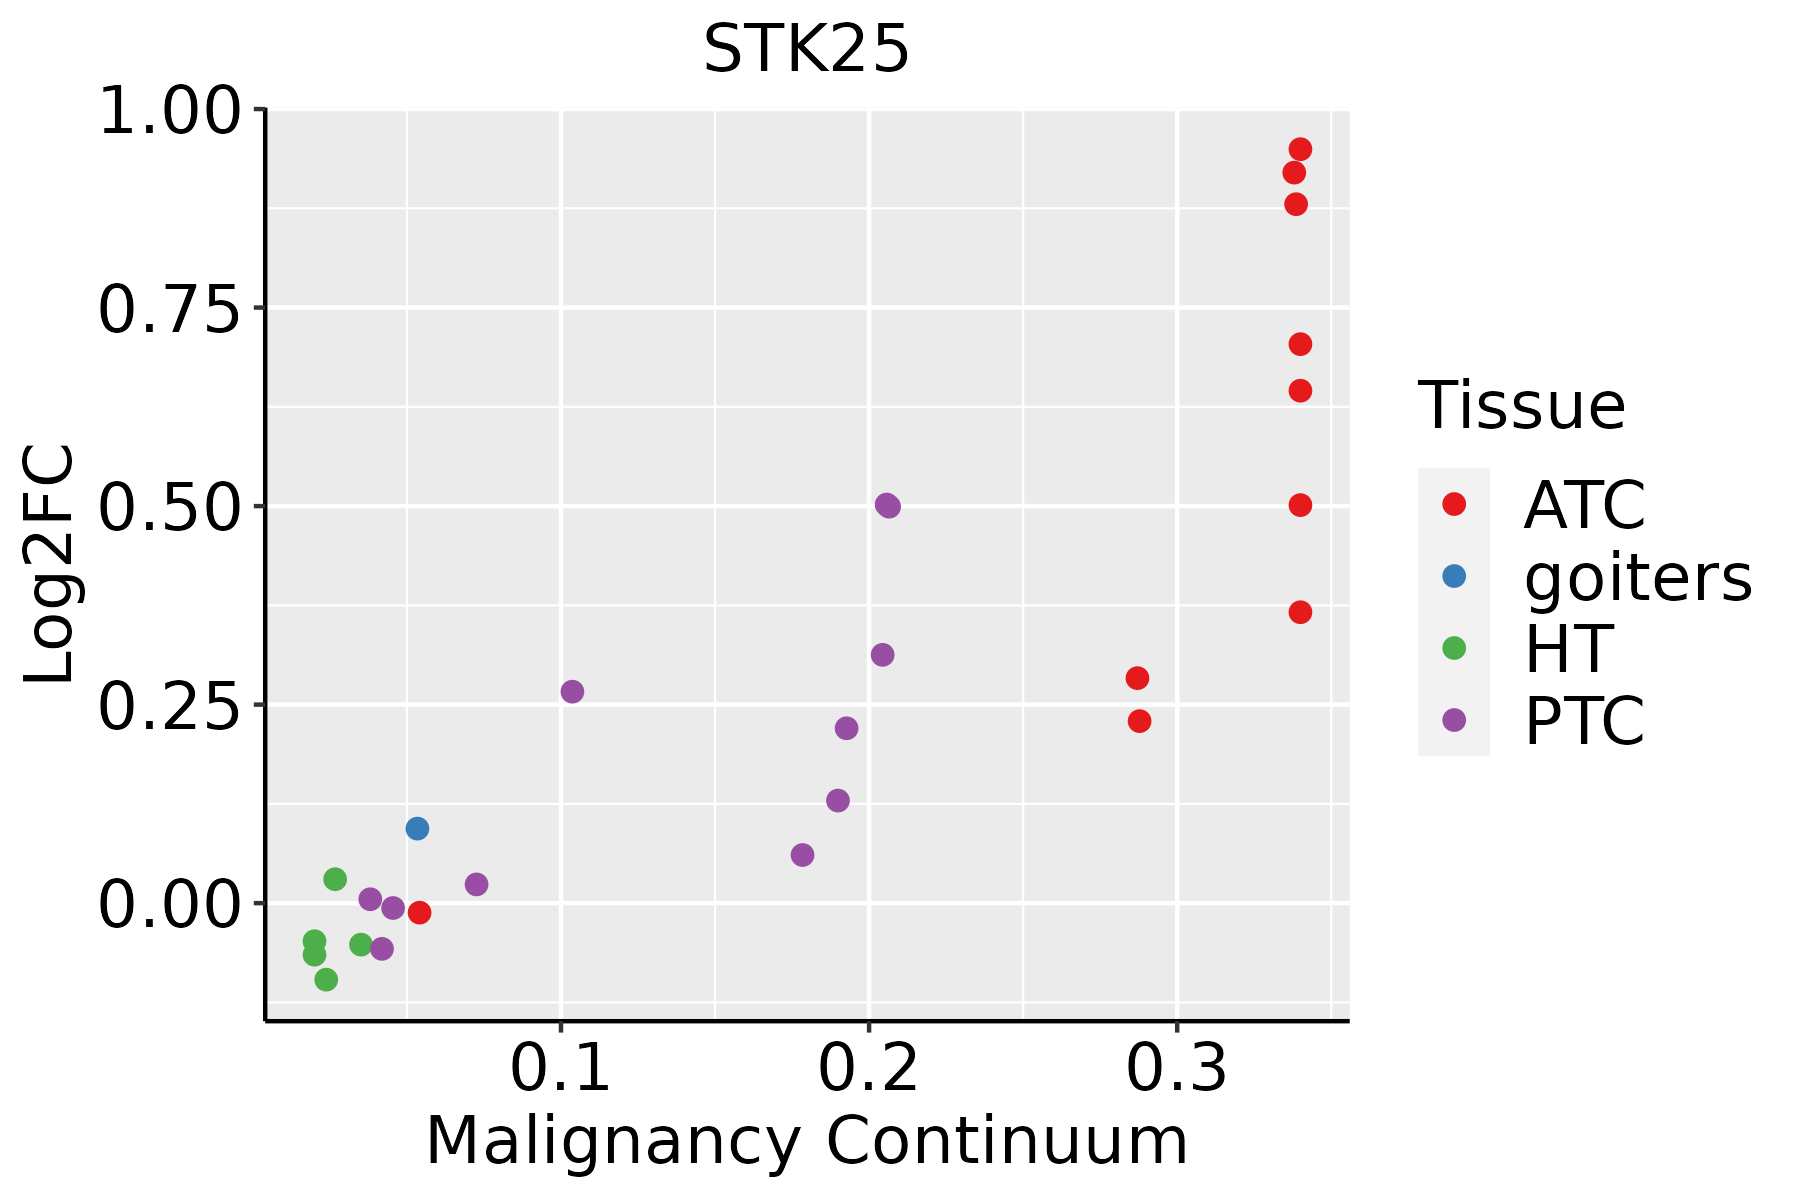 | ATC: Anaplastic thyroid cancer |
| HT: Hashimoto's thyroiditis | ||
| PTC: Papillary thyroid cancer |
| ∗log2FC in expression of this searched gene in stem-like cells from each diseased tissue sample relative to stem-like cells in normal samples in each tissue plotted against the malignancy continuum. Samples are colored based on if they are from different disease stage. |
Top |
Malignant transformation related pathway analysis |
| Find out the enriched GO biological processes and KEGG pathways involved in transition from healthy to precancer to cancer |
| Tissue | Disease Stage | Enriched GO biological Processes |
| Colorectum | AD |  |
| Colorectum | SER |  |
| Colorectum | MSS |  |
| Colorectum | MSI-H |  |
| Colorectum | FAP |  |
| ∗Top 15 enriched GO BP terms are showed in the bar plot of each disease state in each tissue. Each row represents a significant GO biological process which is colored according to the -log10(p.adjust). |
| Page: 1 2 3 4 5 6 7 8 9 |
| GO ID | Tissue | Disease Stage | Description | Gene Ratio | Bg Ratio | pvalue | p.adjust | Count |
| GO:009719327 | Esophagus | HGIN | intrinsic apoptotic signaling pathway | 90/2587 | 288/18723 | 1.50e-14 | 2.80e-12 | 90 |
| GO:000697927 | Esophagus | HGIN | response to oxidative stress | 107/2587 | 446/18723 | 3.91e-09 | 2.76e-07 | 107 |
| GO:005165616 | Esophagus | HGIN | establishment of organelle localization | 90/2587 | 390/18723 | 4.27e-07 | 1.94e-05 | 90 |
| GO:006219727 | Esophagus | HGIN | cellular response to chemical stress | 76/2587 | 337/18723 | 8.00e-06 | 2.41e-04 | 76 |
| GO:003459926 | Esophagus | HGIN | cellular response to oxidative stress | 65/2587 | 288/18723 | 3.42e-05 | 8.66e-04 | 65 |
| GO:000030226 | Esophagus | HGIN | response to reactive oxygen species | 52/2587 | 222/18723 | 7.30e-05 | 1.66e-03 | 52 |
| GO:000863119 | Esophagus | HGIN | intrinsic apoptotic signaling pathway in response to oxidative stress | 16/2587 | 45/18723 | 2.04e-04 | 3.78e-03 | 16 |
| GO:004254220 | Esophagus | HGIN | response to hydrogen peroxide | 35/2587 | 146/18723 | 6.58e-04 | 9.01e-03 | 35 |
| GO:00516455 | Esophagus | HGIN | Golgi localization | 7/2587 | 14/18723 | 1.34e-03 | 1.57e-02 | 7 |
| GO:0097193111 | Esophagus | ESCC | intrinsic apoptotic signaling pathway | 222/8552 | 288/18723 | 5.87e-28 | 2.02e-25 | 222 |
| GO:005165617 | Esophagus | ESCC | establishment of organelle localization | 273/8552 | 390/18723 | 9.13e-23 | 1.81e-20 | 273 |
| GO:0006979111 | Esophagus | ESCC | response to oxidative stress | 303/8552 | 446/18723 | 7.15e-22 | 1.30e-19 | 303 |
| GO:0062197111 | Esophagus | ESCC | cellular response to chemical stress | 234/8552 | 337/18723 | 5.37e-19 | 5.97e-17 | 234 |
| GO:0034599111 | Esophagus | ESCC | cellular response to oxidative stress | 197/8552 | 288/18723 | 3.76e-15 | 2.15e-13 | 197 |
| GO:0000302111 | Esophagus | ESCC | response to reactive oxygen species | 150/8552 | 222/18723 | 3.06e-11 | 1.02e-09 | 150 |
| GO:000716320 | Esophagus | ESCC | establishment or maintenance of cell polarity | 143/8552 | 218/18723 | 2.05e-09 | 4.65e-08 | 143 |
| GO:0042542111 | Esophagus | ESCC | response to hydrogen peroxide | 102/8552 | 146/18723 | 2.64e-09 | 5.81e-08 | 102 |
| GO:0008631110 | Esophagus | ESCC | intrinsic apoptotic signaling pathway in response to oxidative stress | 38/8552 | 45/18723 | 8.42e-08 | 1.43e-06 | 38 |
| GO:003109818 | Esophagus | ESCC | stress-activated protein kinase signaling cascade | 154/8552 | 247/18723 | 8.53e-08 | 1.44e-06 | 154 |
| GO:003461420 | Esophagus | ESCC | cellular response to reactive oxygen species | 103/8552 | 155/18723 | 1.34e-07 | 2.17e-06 | 103 |
| Page: 1 2 3 4 5 6 7 8 9 10 11 12 |
| Pathway ID | Tissue | Disease Stage | Description | Gene Ratio | Bg Ratio | pvalue | p.adjust | qvalue | Count |
| Page: 1 |
Top |
Cell-cell communication analysis |
| Identification of potential cell-cell interactions between two cell types and their ligand-receptor pairs for different disease states |
| Ligand | Receptor | LRpair | Pathway | Tissue | Disease Stage |
| Page: 1 |
Top |
Single-cell gene regulatory network inference analysis |
| Find out the significant the regulons (TFs) and the target genes of each regulon across cell types for different disease states |
| TF | Cell Type | Tissue | Disease Stage | Target Gene | RSS | Regulon Activity |
| ∗The dot plots of a searched regulon are shown for all cell subpopulations in each disease state of each tissue based on the regulon specific score inferred using pySCENIC and by calculating the average expression. |
| Page: 1 |
Top |
Somatic mutation of malignant transformation related genes |
| Annotation of somatic variants for genes involved in malignant transformation |
| Hugo Symbol | Variant Class | Variant Classification | dbSNP RS | HGVSc | HGVSp | HGVSp Short | SWISSPROT | BIOTYPE | SIFT | PolyPhen | Tumor Sample Barcode | Tissue | Histology | Sex | Age | Stage | Therapy Types | Drugs | Outcome |
| STK25 | SNV | Missense_Mutation | novel | c.810N>G | p.Ile270Met | p.I270M | O00506 | protein_coding | deleterious(0.02) | possibly_damaging(0.88) | TCGA-A8-A09I-01 | Breast | breast invasive carcinoma | Female | >=65 | I/II | Hormone Therapy | anastrozole | SD |
| STK25 | SNV | Missense_Mutation | c.1027C>A | p.Gln343Lys | p.Q343K | O00506 | protein_coding | tolerated(0.3) | benign(0.001) | TCGA-AO-A0J9-01 | Breast | breast invasive carcinoma | Female | <65 | III/IV | Chemotherapy | cyclophosphamide | PD | |
| STK25 | SNV | Missense_Mutation | c.298G>A | p.Gly100Ser | p.G100S | O00506 | protein_coding | deleterious(0.01) | probably_damaging(0.998) | TCGA-B6-A0IM-01 | Breast | breast invasive carcinoma | Female | >=65 | I/II | Unknown | Unknown | SD | |
| STK25 | SNV | Missense_Mutation | c.1025N>T | p.Ser342Leu | p.S342L | O00506 | protein_coding | tolerated(0.3) | benign(0.045) | TCGA-E9-A1RH-01 | Breast | breast invasive carcinoma | Female | <65 | I/II | Chemotherapy | 5-fluorouracil | SD | |
| STK25 | insertion | Frame_Shift_Ins | novel | c.1270_1271insATGTTAGTTTTCATAGAACATTGAGAGG | p.Ser424TyrfsTer109 | p.S424Yfs*109 | O00506 | protein_coding | TCGA-A8-A0AB-01 | Breast | breast invasive carcinoma | Female | <65 | I/II | Chemotherapy | 5-fluorouracil | CR | ||
| STK25 | SNV | Missense_Mutation | novel | c.979N>T | p.Pro327Ser | p.P327S | O00506 | protein_coding | tolerated(0.12) | benign(0.003) | TCGA-5M-AAT6-01 | Colorectum | colon adenocarcinoma | Female | <65 | III/IV | Unknown | Unknown | PD |
| STK25 | SNV | Missense_Mutation | c.773N>A | p.Arg258Gln | p.R258Q | O00506 | protein_coding | deleterious(0) | probably_damaging(1) | TCGA-A6-6781-01 | Colorectum | colon adenocarcinoma | Male | <65 | III/IV | Chemotherapy | oxaliplatin | SD | |
| STK25 | SNV | Missense_Mutation | c.571G>A | p.Ala191Thr | p.A191T | O00506 | protein_coding | deleterious(0.01) | benign(0.237) | TCGA-AA-3710-01 | Colorectum | colon adenocarcinoma | Female | >=65 | I/II | Unknown | Unknown | SD | |
| STK25 | SNV | Missense_Mutation | c.700A>G | p.Thr234Ala | p.T234A | O00506 | protein_coding | tolerated(0.08) | benign(0.003) | TCGA-AD-A5EJ-01 | Colorectum | colon adenocarcinoma | Female | >=65 | I/II | Unknown | Unknown | SD | |
| STK25 | SNV | Missense_Mutation | c.571G>A | p.Ala191Thr | p.A191T | O00506 | protein_coding | deleterious(0.01) | benign(0.237) | TCGA-AM-5821-01 | Colorectum | colon adenocarcinoma | Female | >=65 | I/II | Unknown | Unknown | SD |
| Page: 1 2 3 4 |
Top |
Related drugs of malignant transformation related genes |
| Identification of chemicals and drugs interact with genes involved in malignant transfromation |
| (DGIdb 4.0) |
| Entrez ID | Symbol | Category | Interaction Types | Drug Claim Name | Drug Name | PMIDs |
| Page: 1 |

Copyright 2023-Present -The University of Texas Health Science Center at Houston |